A deep learning framework with positional attention for modeling enhancer-promoter interactions
*Correspondence to:
Qinhu Zhang, Eastern Institute of Technology, Ningbo 315201, Zhejiang, China.
E-mail: qhzhang@idt.eitech.edu.cn
Comput Biomed. 2026;1:202525. 10.70401/cbm.2026.0013
Received: November 21, 2025Accepted: April 07, 2026Published: April 08, 2026
This manuscript is made available in its unedited form to allow early access to the
reported findings. Further editing will be completed before final publication. As such,
the content may include errors, and standard legal disclaimers are applicable.
Abstract
Aims: Since distal enhancers are involved in regulating target genes through physical contacting with proximal promoters, identifying enhancer-promoter interactions (EPIs) is critical to deepening our understanding of gene expression. However, high-throughput experimental methods for identifying EPIs are time-consuming and expensive. Therefore, computational methods for predicting EPIs would be valuable and important, but also face a lot of challenges.
Methods: In this paper, we propose a novel deep learning-based method, namely EPIPAM, to predict EPIs only using genomic sequences. EPIPAM firstly uses a deep convolutional neural network to extract high-level sequence features, and then uses a position attention mechanism to compute the positional correlation coefficients of two subregions separately coming from enhancers and promoters, aiming to focus on important regions of them.
Results: Benchmarking comparisons on six different cell lines show that EPIPAM performs better than the state-of-the-art methods in the task of EPIs prediction. More importantly, we notice that, almost without exception, the predictive performance of all methods is really poor once applying a strategy of splitting training and test data by chromosome. Therefore, we explain the possible reason that leads to this situation by systematically exploring the structure of EPI datasets, and indirectly analyze the difficulty of predicting EPIs only using genomic sequences through ChIA-PET contact datasets.
Conclusion: This study presents a novel deep learning-based method to predict EPIs only using genomic sequences. Although the proposed method achieves higher predictive accuracy, it suffers from several limitations, such as highly selective matching bias, negative sample selection issues, and constraints of pre-trained vectors.
Keywords
Genomic sequences, enhancer-promoter interactions, deep learning, position attention mechanism
1. Introduction
At kilobase to megabase scales, distal enhancers are key cis-regulatory elements that control cell-type-specific gene expression by being involved in physical contacts with their target genes, often through long-range chromosomal interactions[1,2]. Sequence variants in enhancers that disrupt enhancer-promoter interactions (EPIs) may be relevant to human diseases, such as developmental malformations, autoimmune and cardiovascular diseases[3,4], emphasizing the central role of enhancers in transcriptional control. Therefore, accurately identifying EPIs is crucial to deepening our understanding of gene regulatory mechanisms and human diseases and their causality. With the development of high-throughput sequencing technologies and chromosome conformation capture technologies, several biological experimental methods for identifying EPIs have been developed, such as Hi-C[5], ChIA-PET[6], and HiChIP[7]. Accordingly, these experimental methods provide a large amount of data, making it possible to predict EPIs in a computational way.
In recent years, machine learning (ML) has been successfully applied to EPIs prediction and proven to be effective for accurately and quickly predicting EPIs on a genome-wide scale. These ML-based methods are mainly concentrated in two types of data: (i) genomic data and epigenomic data; (ii) genomic sequences. For example, Whalen et al.[8] proposed TargetFinder that integrates genomic and epigenomic data for transcription factor (TF) ChIP-seq, histone marks, DNase-seq, DNA methylation, and gene expression to predict EPIs across the genome. Talukder et al.[9] proposed an ensemble approach called EPIP that utilizes functional genomic and epigenomic data to predict condition-specific EPIs. However, these methods not only require a large number of epigenomic and genomic data but also need relevant knowledge about how to select useful genomic and epigenomic features. By contrast, genomic sequences are easy to obtain and process. Therefore, a lot of research starts to focus on genomic sequences that directly reflect the information of EPIs. For instance, Yang et al.[10] developed a boosted tree-based ensemble algorithm that uses word embedding to generate features directly from genomic sequences to predict EPIs. Over the past five years, deep neural networks have achieved impressive performance in some biological fields, such as the prediction of chromatin accessibility[11], the recognition of
In this paper, we propose a deep learning-based method, namely EPIPAM, which is composed of a designed deep CNN architecture and a new position attention mechanism (PAM), to predict EPIs only using genomic sequences. In EPIPAM, the deep CNN is used to extract high-level sequence features from enhancers and promoters, and the PAM is used to learn the direct contact information of enhancers and promoters. The comparison results on six different cell lines show that EPIPAM performs better than the
2. Materials and Methods
2.1 Data preparation
In this article, we used the same EP pairs from TargetFinder as the primary datasets to evaluate our proposed method. These datasets are from six human cell lines: GM12878 (lymphoblastoid cells), HUVEC (umbilical vein endothelial cells), HeLaS3 (ectoderm-lineage cells from a patient with cervical cancer), IMR90 (fetal lung fibroblasts), K562 (mesoderm-lineage cells from a patient with leukemia) and NHEK (epidermal keratinocytes). TargetFinder used ENCODE and Roadmap Epigenomics annotations to label positive EP pairs and sampled 20 negative EP pairs for each positive EP pair by matching the same EP distance distribution.
We collected ChIA-PET contact datasets targeting CCCTC-binding factor (CTCF) and polymerase II (Pol2) from the ENCODE project. For each dataset, we first used ChIP-seq peaks of the corresponding TF to filter out the contact pairs that do not intersect with any peaks, and the rest of the contact pairs were used as the validation datasets. For each positive pair, we generated negative pairs by considering four situations: (i) 2,000 bp upstream of the positive pair; (ii) 2,000 bp downstream of the positive pair; (iii) the left one of the positive pair remains unchanged, whereas the right one is randomly sampled; (iv) the left one of the positive pair is randomly sampled, whereas the right one remains unchanged. The summary of EPI and ChIA-PET datasets is shown in Table 1.
Table 1. Summary of the primary datasets and the ChIA-PET datasets.
| Datasets | Positive samples | Negative samples |
| GM12878 | 2,113 | 42,200 |
| HUVEC | 1,524 | 30,400 |
| HeLa-S3 | 1,740 | 34,800 |
| IMR90 | 1,254 | 25,000 |
| K562 | 1,977 | 39,500 |
| NHEK | 1,291 | 25,600 |
| HelaS3_pol2 | 2,590 | 10,360 |
| K562_pol2 | 7,031 | 28,124 |
| K562_ctcf | 20,853 | 83,412 |
| Mcf7_ctcf | 30,802 | 123,208 |
HUVEC: human umbilical vein endothelial cell; NHEK: normal human epidermal keratinocytes.
In this paper, we adopted the “split-by-chromosome” and “8-fold-cross-validation” strategy to generate training and test data, efficiently avoiding overlaps between them. In other words, all data are divided into 8 parts according to chromosome names
2.2 The framework of EPIPAM
In this work, we designed a deep CNN architecture and a PAM, called EPIPAM, which is capable of predicting EPIs based on genomic sequences. The framework of EPIPAM is shown in Figure 1. As we can see, the framework has three main parts: deep CNN, PAM, and the prediction module. The details about how EPIPAM works are described in the following subsections.
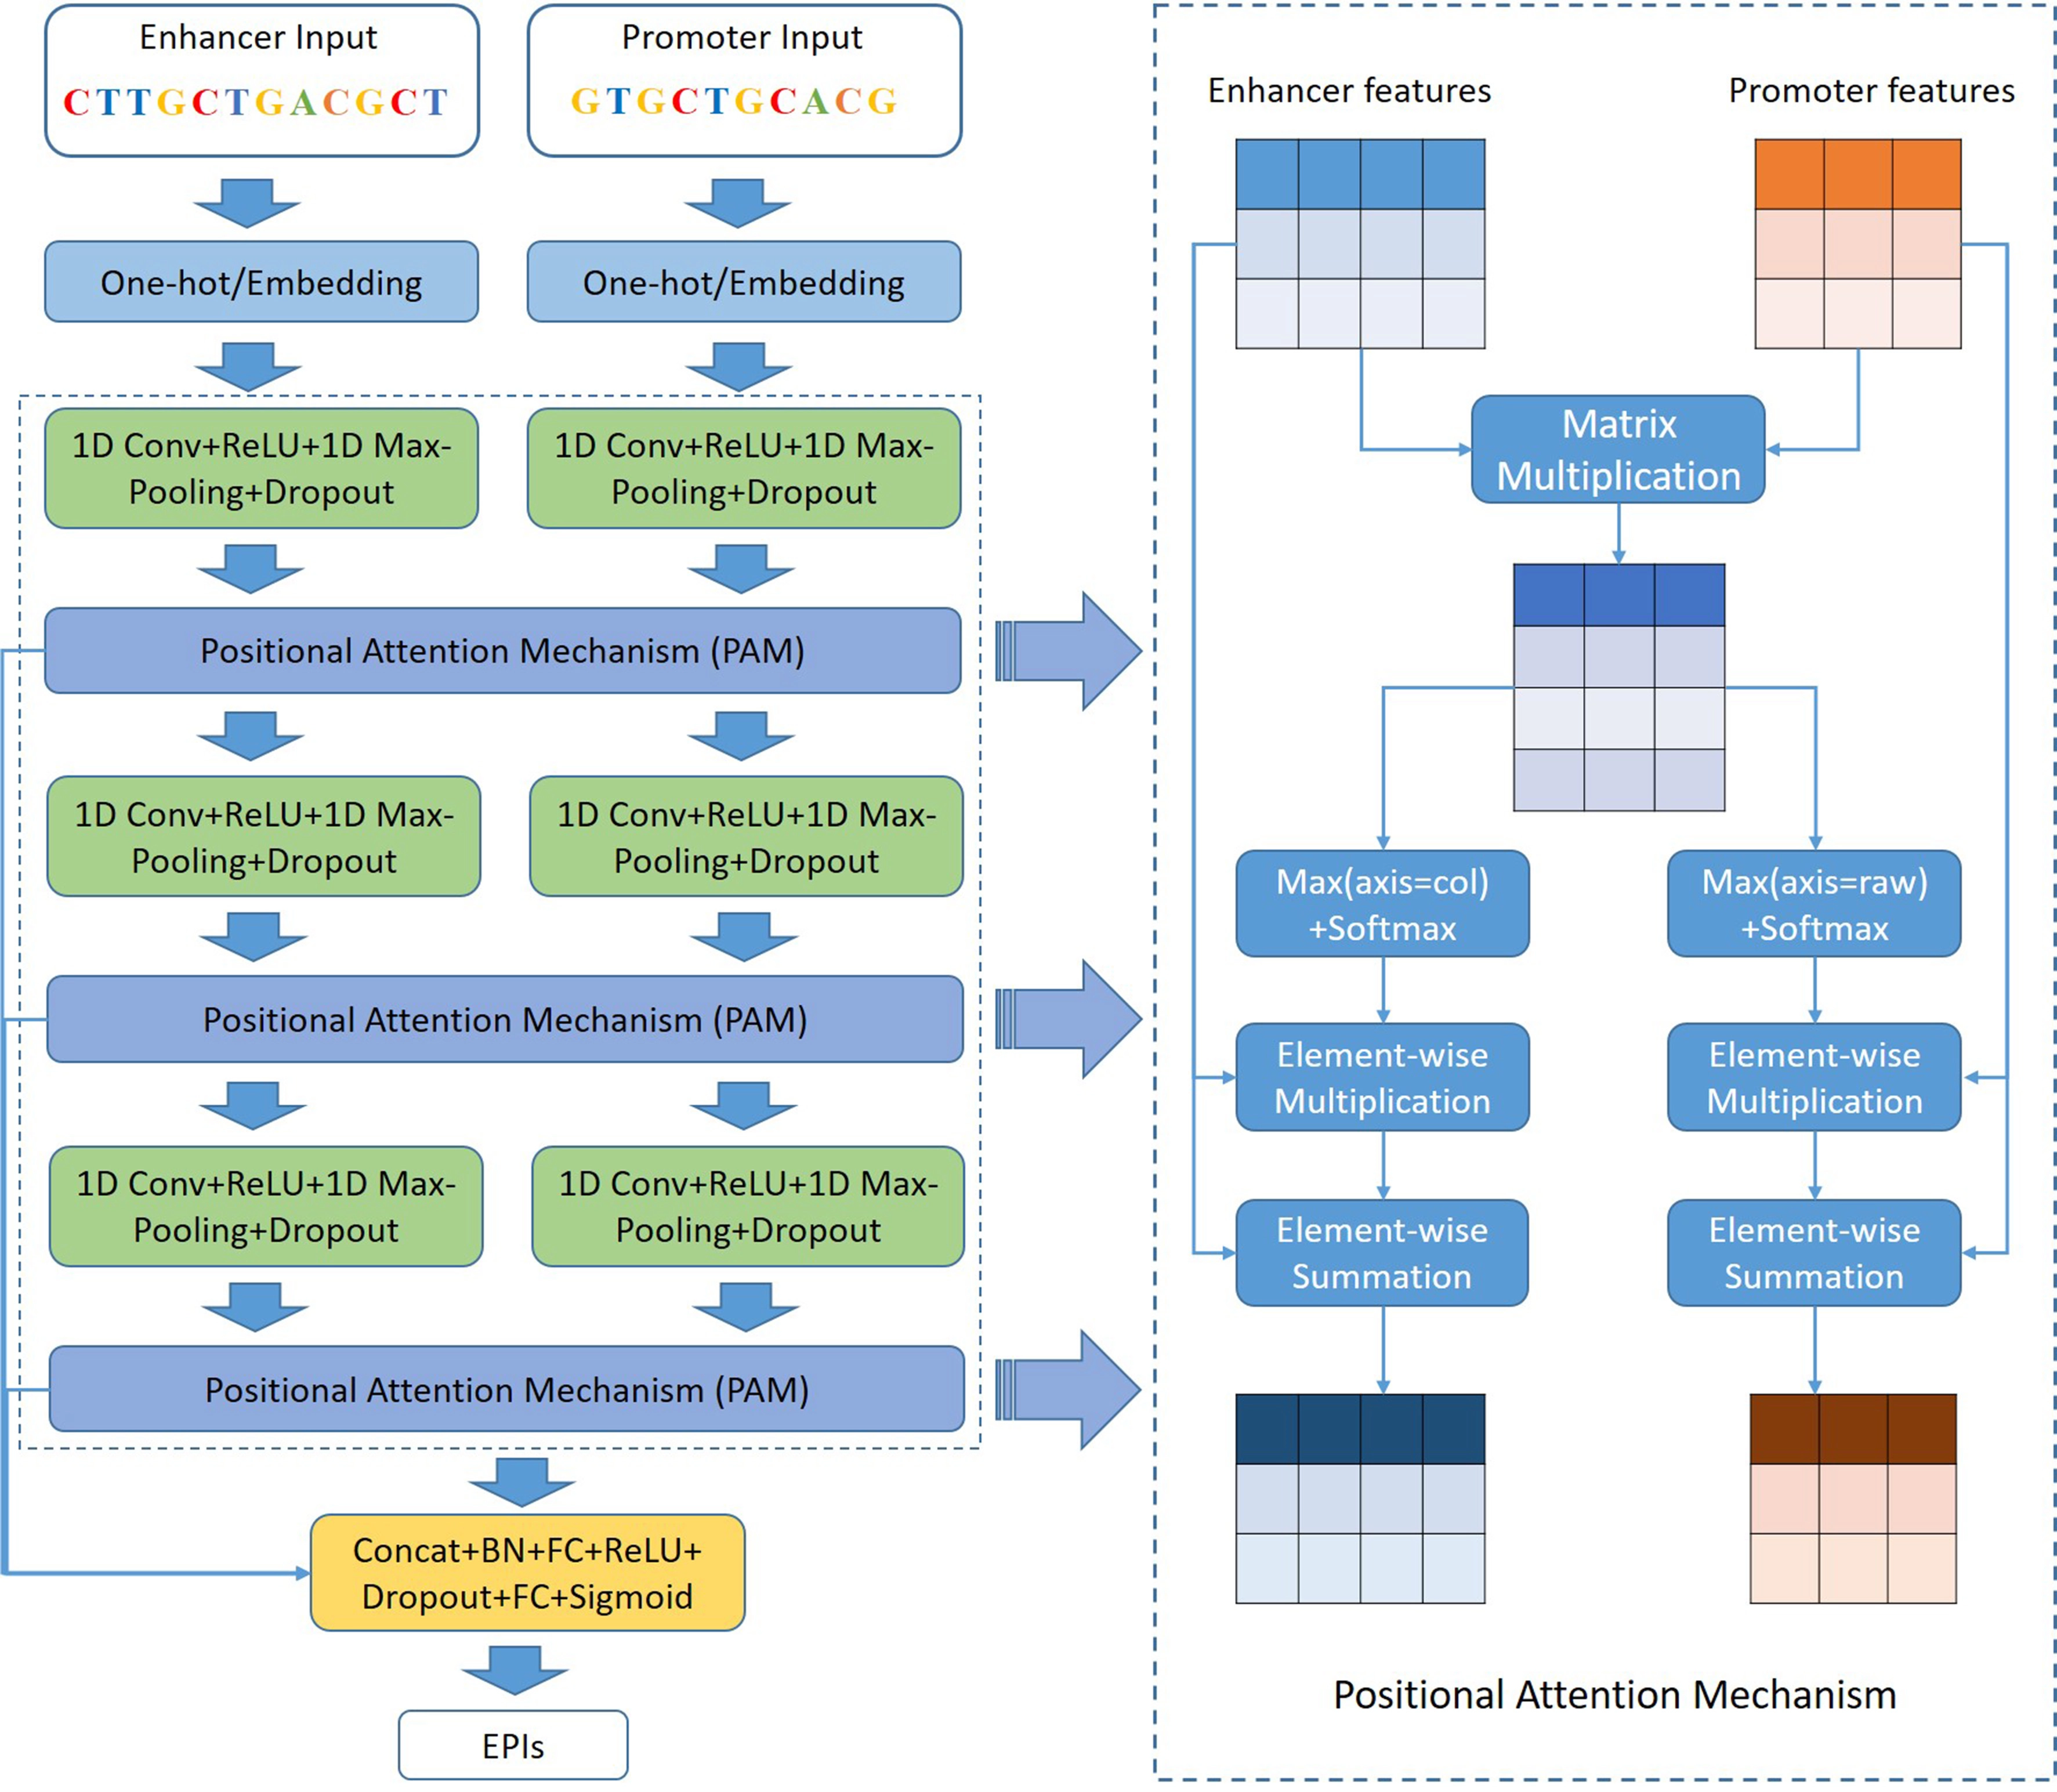
Figure 1. The framework of our proposed method EPIPAM. It mainly contains three parts: deep CNN, PAM, and prediction module. The outputs are probabilities of interaction between enhancer and promoter sequences. CNN: convolutional neural network; PAM: position attention mechanism.
2.2.1 Deep CNN
Inspired by our previous works on TFBS prediction[18], a deep CNN is better than a shallow CNN at capturing high-level sequence features. Therefore, we designed a deep CNN as the backbone network for predicting EPIs. It consists of three repeated blocks, where each block is composed of one convolutional layer, one ReLU layer, one max-pooling layer, and one dropout layer.
1D convolutional layer: The first convolutional layer is often used as motif scanners to detect potential motifs, in which the number of kernels is set to 64 and the size of the kernels is set to 25. The second one is used to learn the local dependency among sequence features, in which the number of kernels is set to 64 and the size of the kernels is set to 13. The third one is used to learn the
ReLU layer: It is set as the activation function, often following the convolutional layers and filtering the values below 0.
1D max-pooling layer: To reduce the complexity of models and prevent overfitting, a pooling layer is often used after a convolution layer. The first and second max-pool layers use a pool window size of 10 and a step size of 10, and the third one uses a pool window size of 5 and a step size of 5.
Dropout layer: It is often used to prevent overfitting in deep neural networks, which adopts a dropout rate of 0.2 to keep 80% of the connections.
Compared with the architectures of EPIVAN or DeepTACT, Deep CNN, unlike an LSTM or a GRU, can be calculated in parallel and save a lot of running time.
2.2.2 PAM
In this work, we proposed a PAM, which directly computes the positional relation matrix and focuses on the important regions of enhancers and promoters. EPIPAM contains three PAMs following each CNN block. After getting enhancer and promoter features from each block, the positional relation matrix was computed according to the Equation (1).
where Me ∈ Rc×n, Mp ∈ Rc×m and Mr ∈ Rn×m separately denote the feature maps of an enhancer, the feature maps of a promoter, and the positional relation matrix, in which
Following Equation (2), we first computed the maximum values along the row and column directions, respectively, and then used the softmax function to compute the attention scores for all positions, and finally used the element-wise multiplication and summation operation to output the new feature maps.
where Ve ∈ Rn×1 denotes the most responses for all enhancer positions, in which
Besides, in terms of Equation (3), we picked out the k top relation values from the positional relation matrix as auxiliary outputs to facilitate the training of EPIPAM.
where Mr ∈ Rn×m denotes the positional relation matrix, and the parameter k can be determined by the ratio that is set to 0.01, 0.1, and 1 for three PAMs in order. The detailed parameter settings were shown in Table S1.
2.2.3 Prediction module
The previous stage outputs two types of features, including the high-level enhancer and promoter features and the k top relation values from three PAMs, as shown in Equation (4). Therefore, we designed two identical prediction modules to compute the probability of existing EPIs. The prediction module consists of one concatenate layer, one batch normalization layer, one
where he and hp are produced by flattening the feature maps from the third PAM, and z1, z2, z3 are the auxiliary outputs from the three PAMs.
2.2.4 Model training
Since EPIPAM contains two prediction branches, we used the joint cross-entropy loss as shown in Equation (5), the Adam optimization algorithm with default settings, the L2-norm penalty, and a mini-batch of 100 samples to train EPIPAM. The weights of EPIPAM were randomly initialized by using the Glorot uniform initializer.
where y denotes the true labels of EP pairs, and α can be selected from a fixed set {1, 0.8, 0.6, 0.4, 0.2, 0}, which determines the relative contribution to the loss.
We implemented our proposed method in Pytorch. All experiments were run on a computer equipped with multi-core CPUs of 16 GB memory size and a GPU of 4 GB memory size (GeForce GTX 970).
2.3 Model variants
As described in EPIVAN, word embedding, initialized with pre-trained DNA vectors, may help to improve the performance of EPIs prediction. Therefore, to test the effect of embedding encoding and PAM, we considered four model variants based on the deep CNN in the experiments, including EPIPAM* that uses embedding encoding and PAM, EPIPAM that uses one-hot encoding and PAM, EPI* that only uses embedding encoding, and EPI that only uses one-hot encoding.
2.4 Evaluation metrics
In the experiments, we used the balanced (1:1) and imbalanced datasets to evaluate the performance of our proposed approach. Therefore, the evaluation metrics we used are the area under the receiver operating characteristic curve (AUROC) and the area under the precision-recall curve (AUPRC). The closer the value of AUROC gets to 1, the better the performance of the model is, and
3. Results
3.1 Prediction performance of model variants on six cell lines
To investigate the effect of embedding encoding and PAM, we designed four model variants and tested them with the balanced EPI datasets. Firstly, we compared EPIPAM* with EPIPAM, and compared EPI* with EPI to investigate the effect of embedding encoding. As shown in Figure 2, we observe that the models using one-hot encoding are generally better than the ones using embedding encoding across all datasets, which demonstrates that embedding encoding is not helpful for EPIs prediction. Then, we compared EPIPAM* with EPI*, and compared EPIPAM and EPI to investigate the effect of PAM. As shown in Figure 2, we find that the models using PAM perform better than the ones not using PAM across all datasets, which proves that PAM is effective in predicting EPIs. Therefore, EPIPAM was used to compare with other methods in the subsequent experiments.
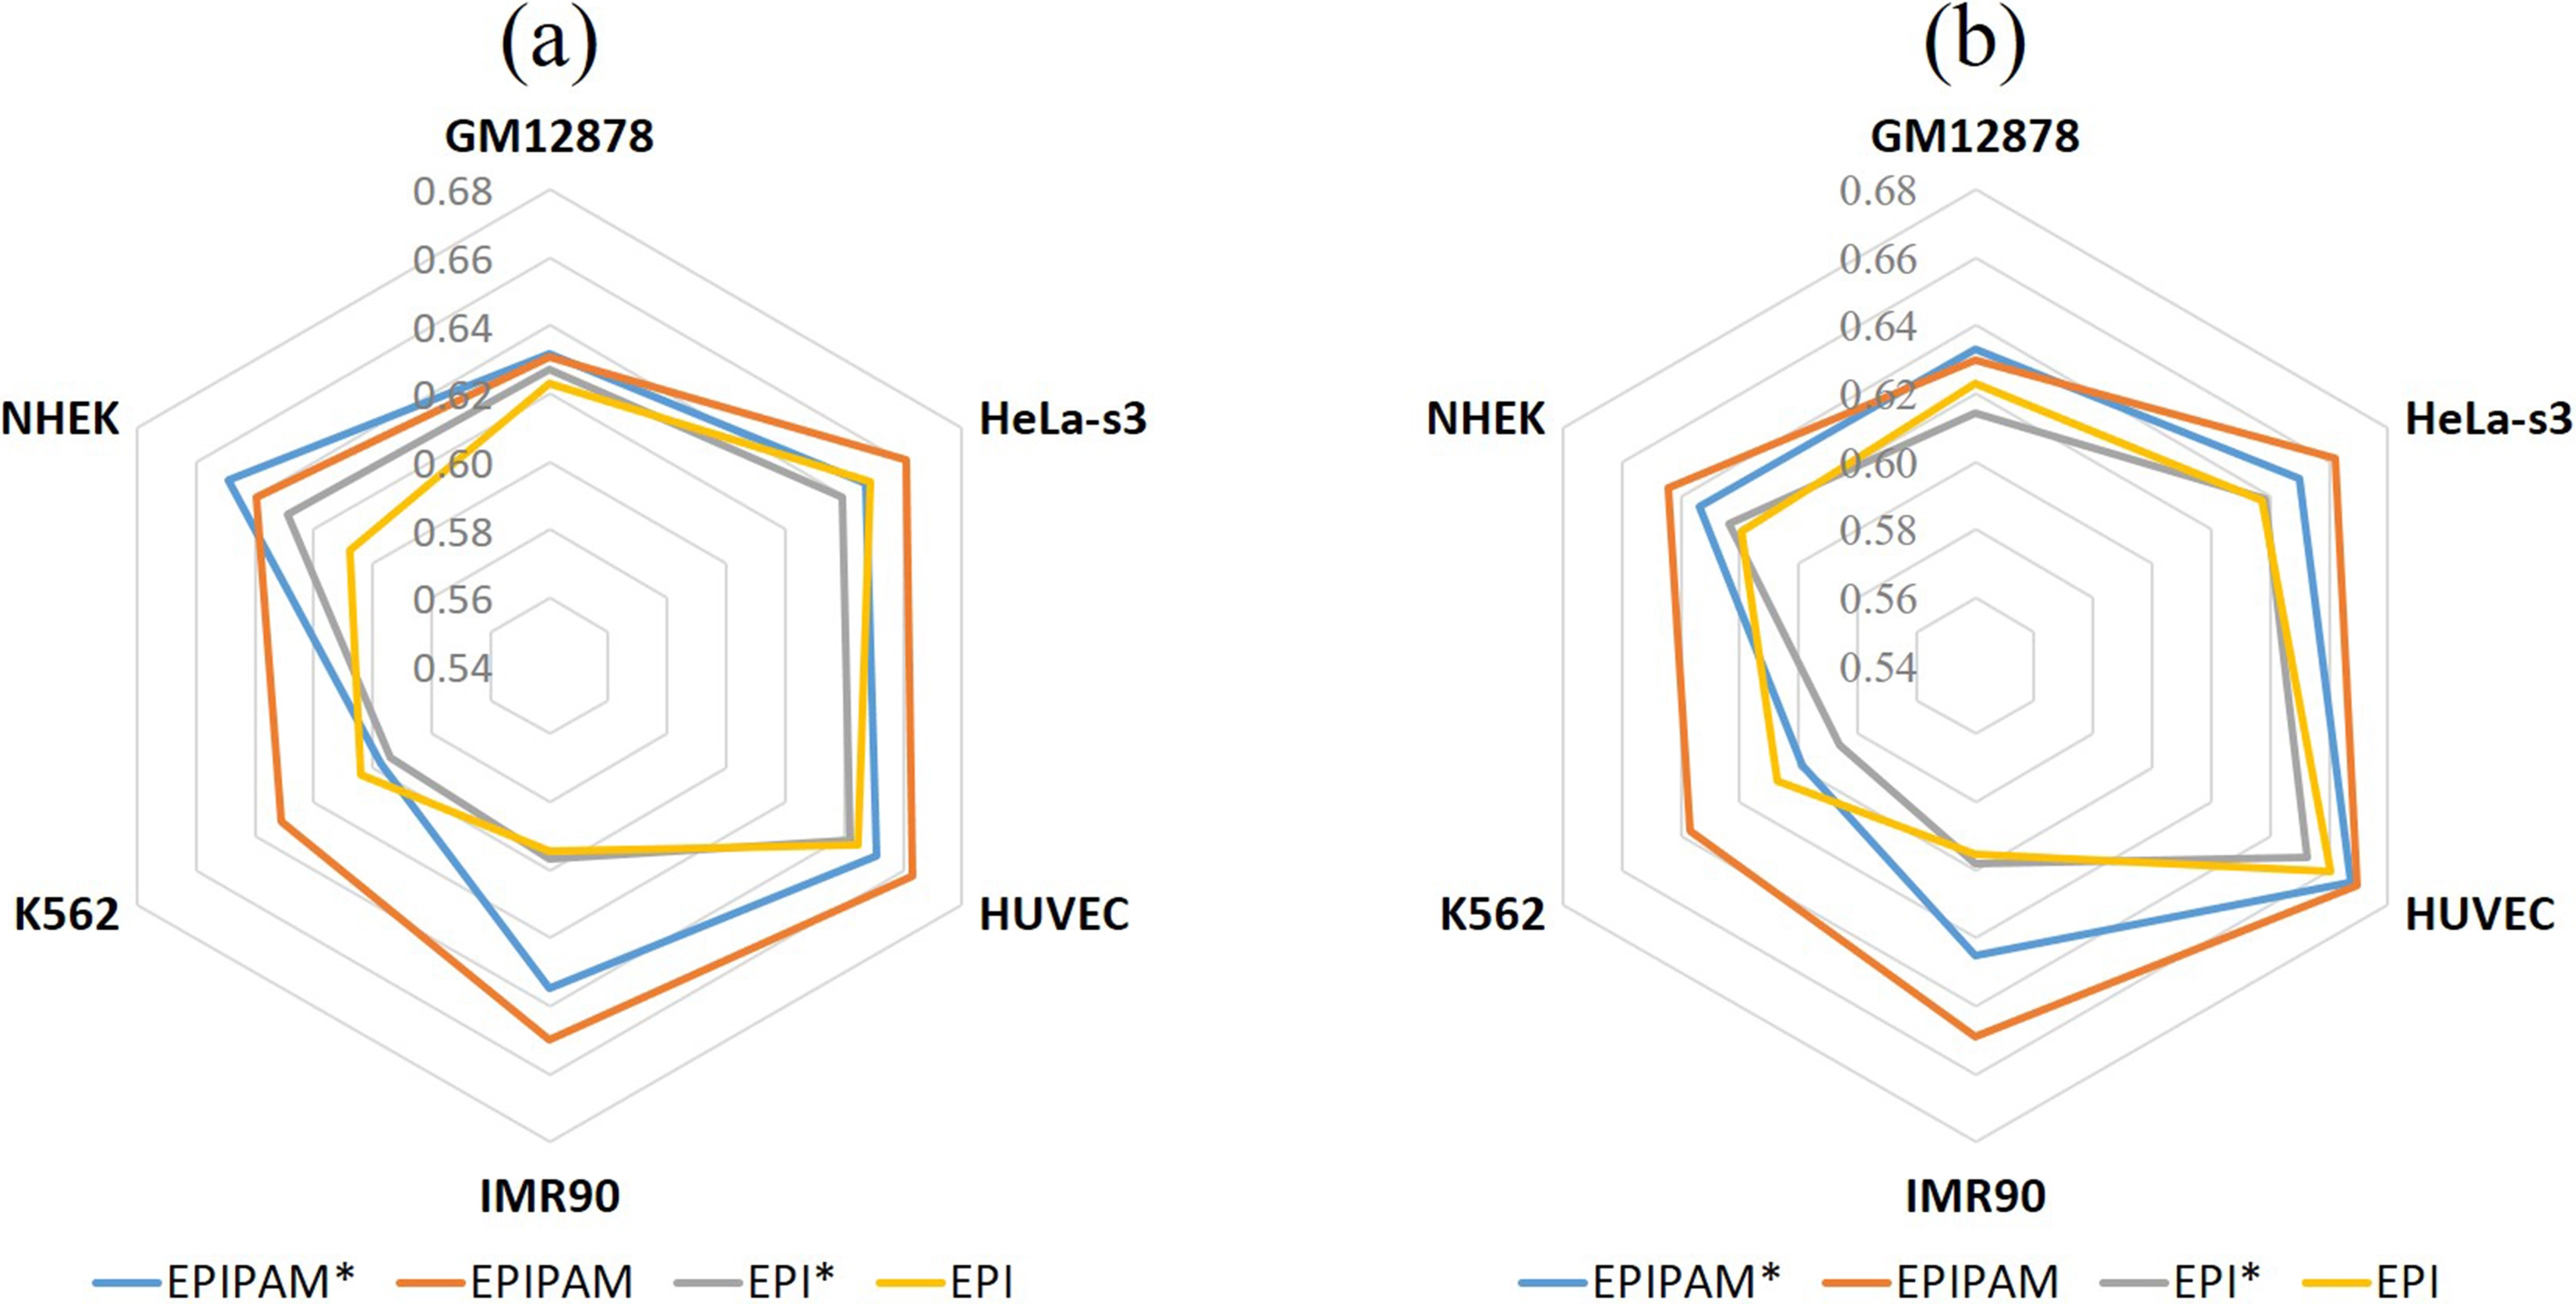
Figure 2. Performance of model variants on the balanced test data. (a) AUROC values of EPIPAM*, EPIPAM, EPI*, and EPI; (b) AUPRC values of EPIPAM*, EPIPAM, EPI*, and EPI. AUROC: area under the receiver operating characteristic curve; AUPRC: area under the precision-recall curve; EPI: enhancer-promoter interaction; NHEK: normal human epidermal keratinocytes; HUVEC: human umbilical vein endothelial cell.
3.2 Comparison of our proposed model and state-of-the-art models on six cell lines
In this section, we further compared the performance of EPIPAM with two state-of-the-art methods, including EPIVAN[16] and DeepTACT[17]. The competing methods were trained by using default settings as mentioned in their literature.
As shown in Figure 3, we observe that our proposed method has a superior performance over the competing methods on the balanced test data (1:1) across all datasets. Compared with EPIVAN and DeepTACT, the average AUROC values are improved by ~1.7% and ~1.3%, and the average AUPRC values are improved by ~1.5% and ~1.2%. As shown in Figure 4, it is obvious that the performance of our proposed method is better than that of the competing methods on the imbalanced test data (1:10) across all datasets. Compared with EPIVAN and DeepTACT, the average AUROC values are improved by ~1.9% and ~1.1%, and the average AUPRC values are improved by ~1.9% and ~1.2%. As a consequence, EPIPAM outperforms the state-of-the-art methods both on the balanced and imbalanced datasets.
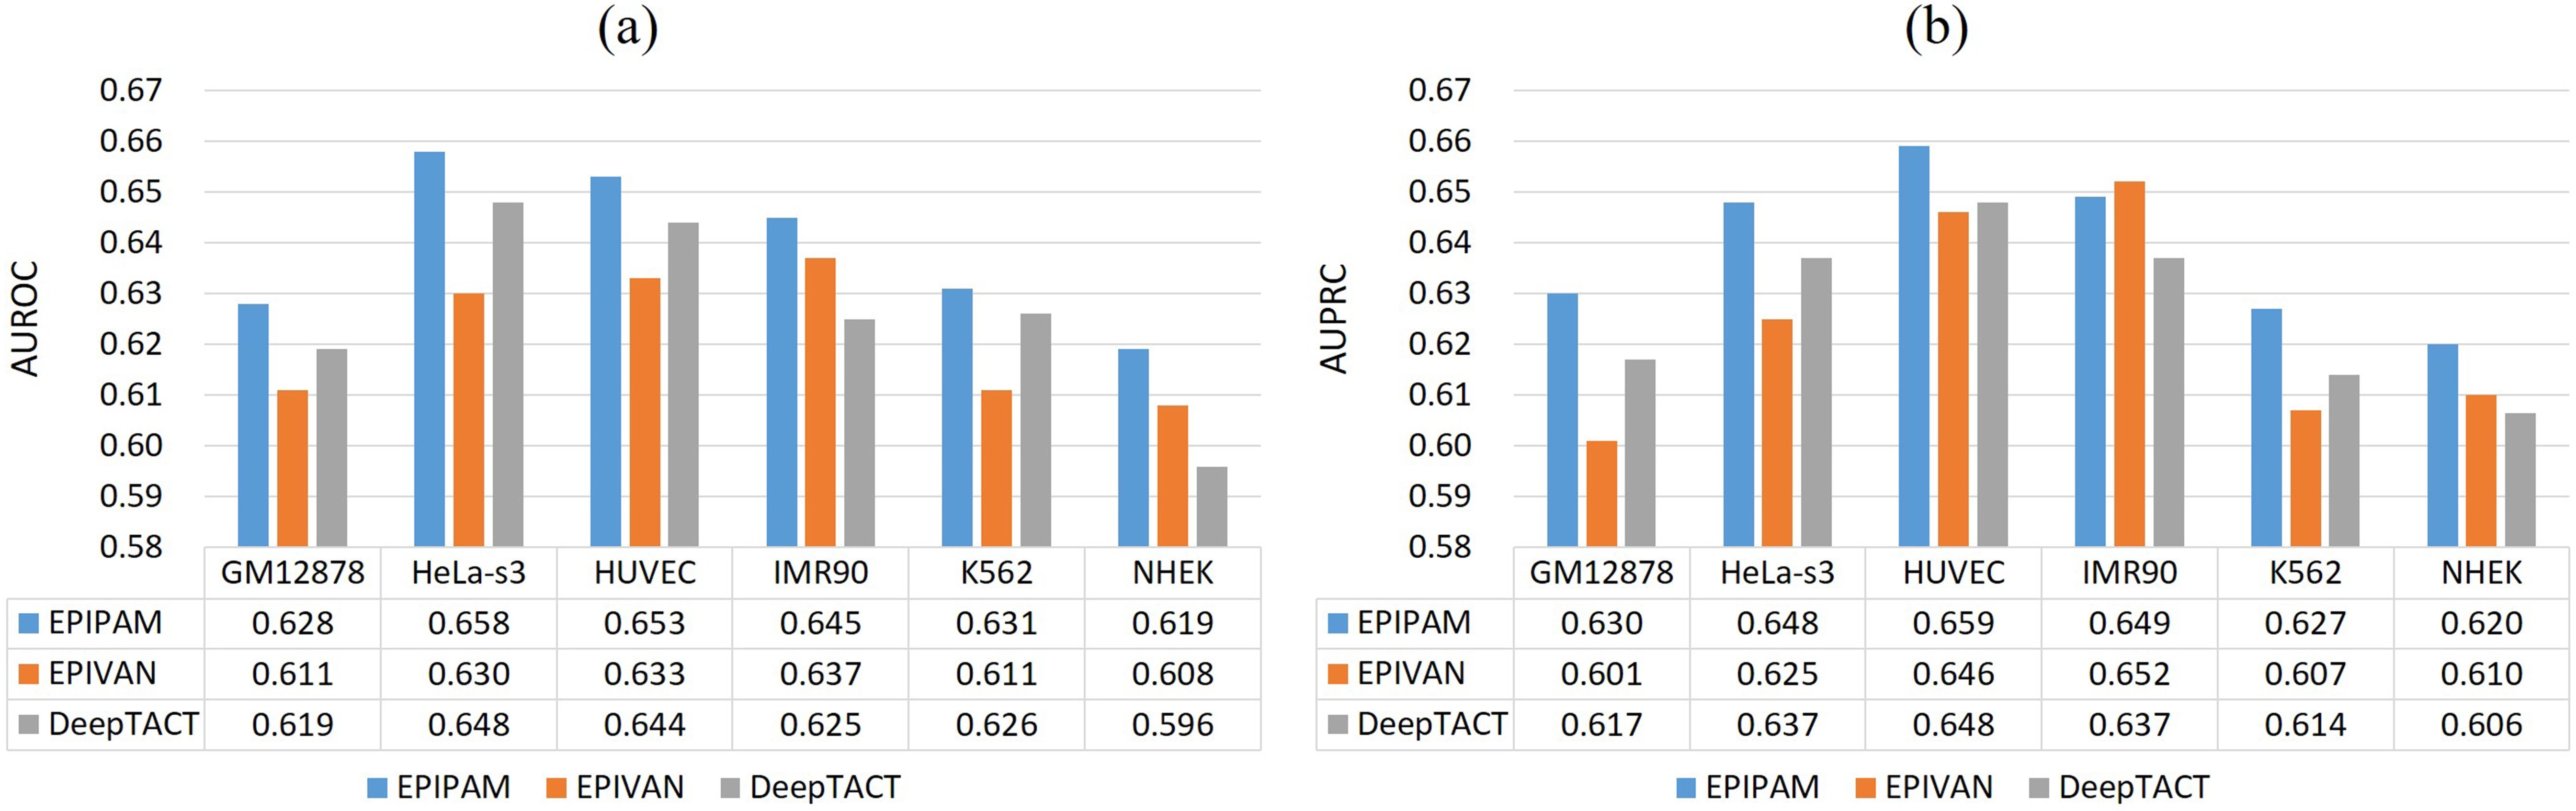
Figure 3. Performance of different methods on the balanced test data. (a) AUROC values of EPIPAM, EPIVAN, and DeepTACT; (b) AUPRC values of EPIPAM, EPIVAN, and DeepTACT. AUROC: area under the receiver operating characteristic curve; AUPRC: area under the precision-recall curve; NHEK: normal human epidermal keratinocytes; HUVEC: human umbilical vein endothelial cell.
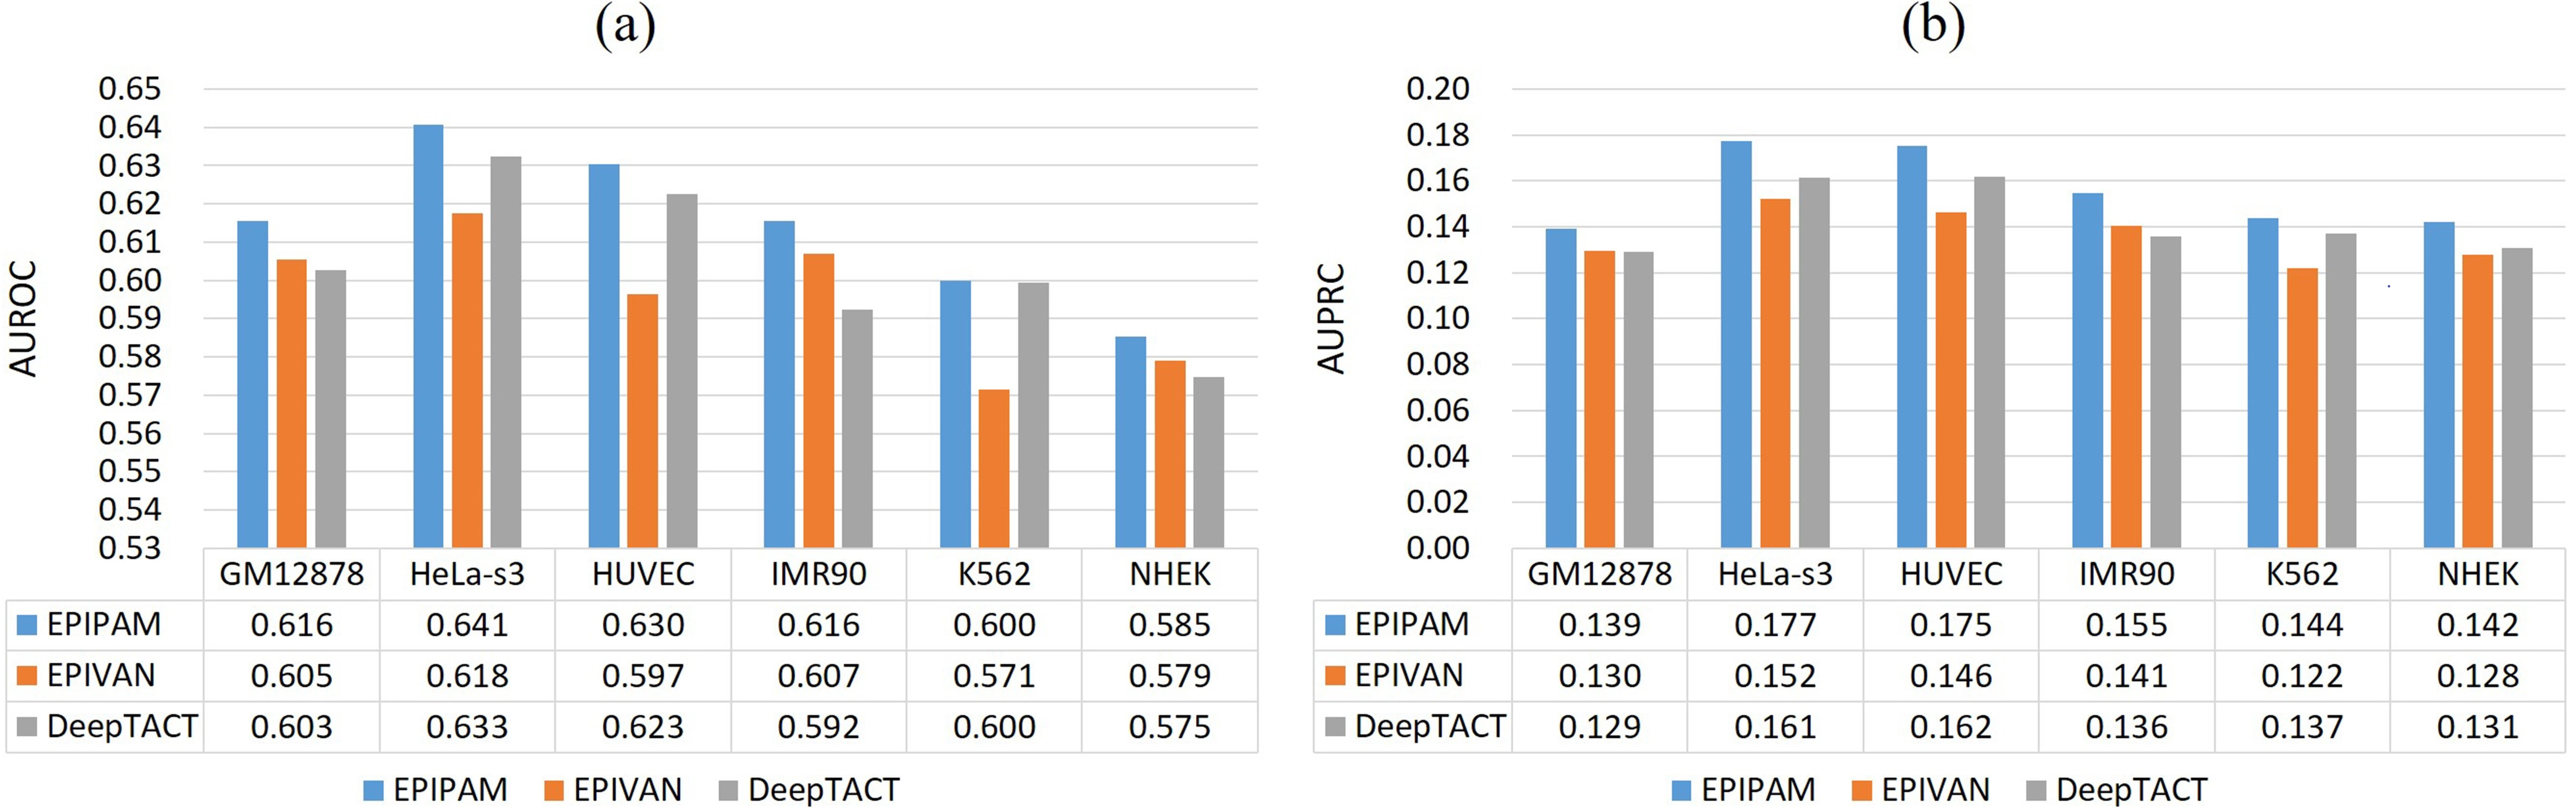
Figure 4. Performance of different methods on the imbalanced test data. (a) AUROC values of EPIPAM, EPIVAN, and DeepTACT; (b) AUPRC values of EPIPAM, EPIVAN, and DeepTACT. AUROC: area under the receiver operating characteristic curve; AUPRC: area under the precision-recall curve; NHEK: normal human epidermal keratinocytes; HUVEC: human umbilical vein endothelial cell.
It is worth noting that the performance of all methods in the experiments is very poor when the ‘split-by-chromosome’ strategy was adopted, and even worse on the imbalanced test data, (None of the AUROC values are over 0.65, and none of the AUPRC values are over 0.2). Therefore, all methods fail to predict EPIs only using genomic sequences. In the next section, we will explain why the predictive performance was overestimated in the previous works and demonstrate the difficulty of predicting EPIs only using genomic sequences.
3.3 The difficulty of predicting EPIs only using genomic sequences
According to the original report in the literature, EPIVAN achieved very high AUROC values ranging from 0.95 to 0.985 and high AUPRC values ranging from 0.773 to 0.899 using the same EPI datasets. Compared with the results in this study, we notice that different data splitting strategies cause these significantly different results. EPIVAN adopted the ‘split-by-random’ strategy to generate training and test data, whereas our study adopted the ‘split-by-chromosome’ strategy to generate training and test data. To better understand why all methods fail to predict EPIs, the structure of EPI datasets across six cell lines was explored. Since we find that most of the promoters simultaneously interact with multiple enhancers which are located close to each other, the regions of these multiple enhancers were firstly extended to 3,000 bp, and then the overlapping ratio between them was computed. As shown in Figure 5, we can see that the overlapping ratio between enhancers is very high, ranging from 57% to 81%. Therefore, the
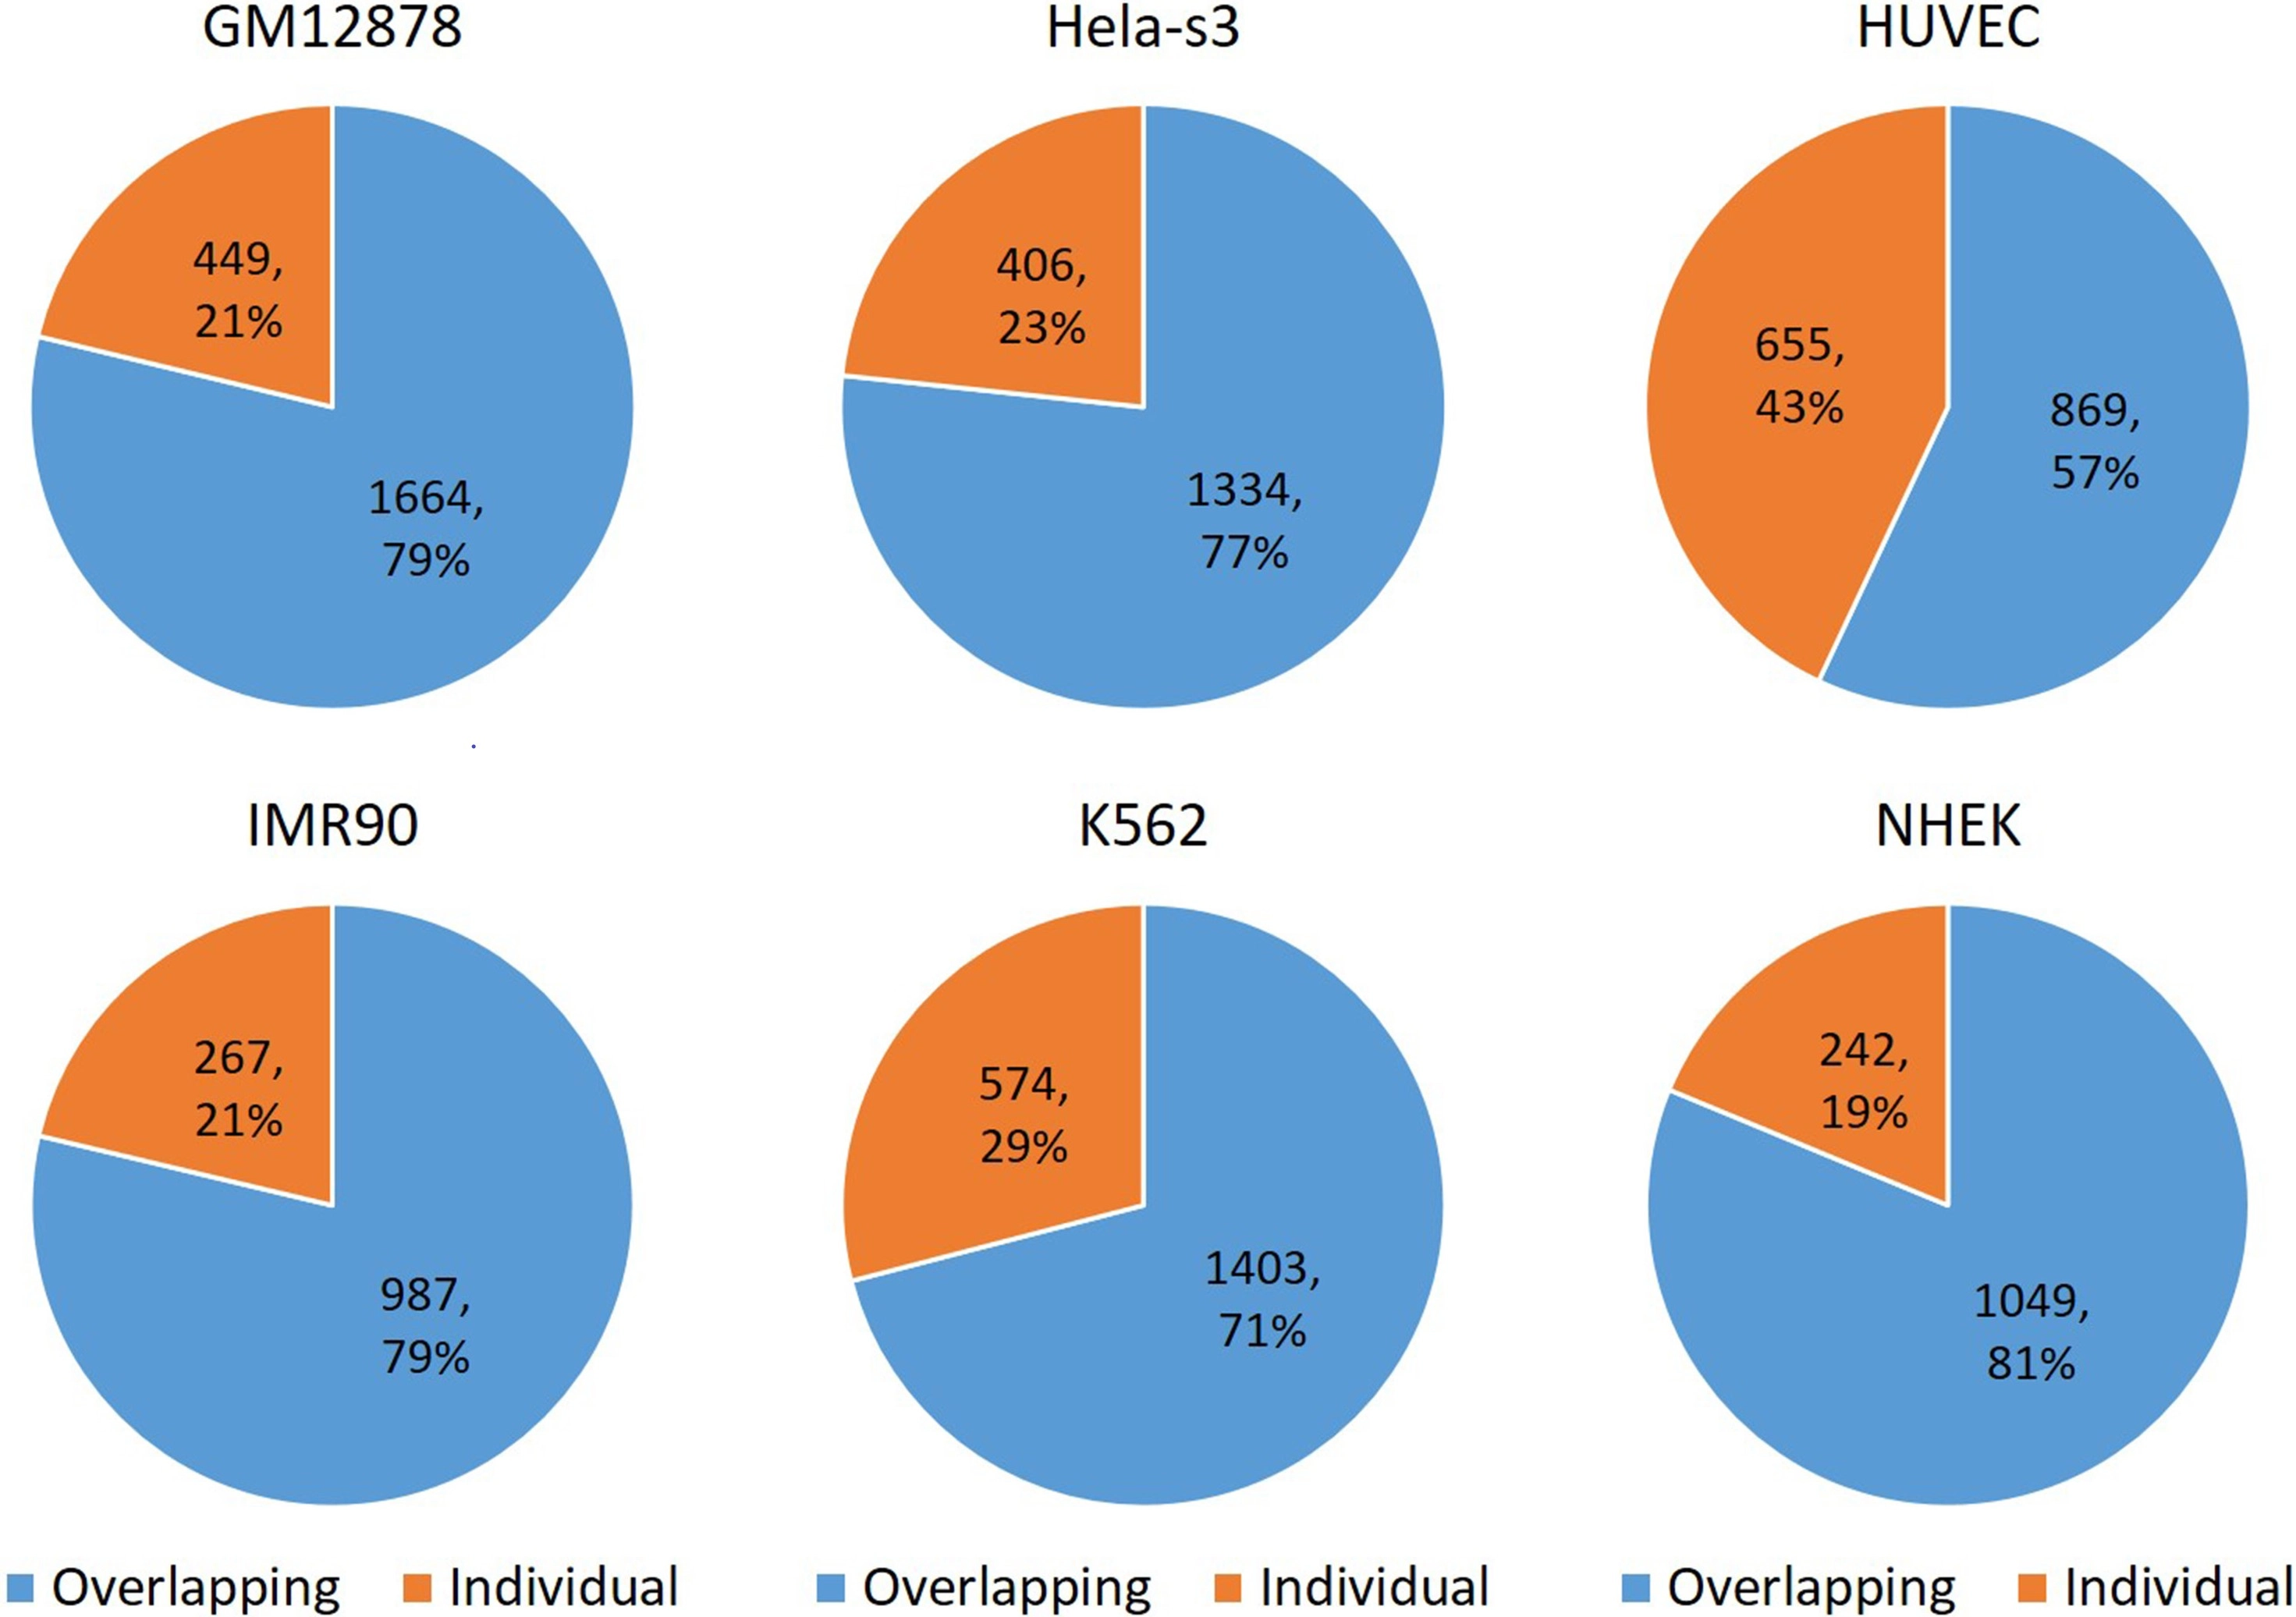
Figure 5. The overlapping ratio between enhancer sequences across six cell lines. 79% of GM12878 enhancers overlap; 77% of Hela-s3 enhancers overlap; 57% of HUVEC enhancers overlap; 79% of IMR90 enhancers overlap; 71% of K562 enhancers overlap; 81% of NHEK enhancers overlap. NHEK: normal human epidermal keratinocytes; HUVEC: human umbilical vein endothelial cell.
In this study, the ‘split-by-chromosome’ strategy was adopted to generate training and test data, resulting in very poor but true predictive performance. To directly show the difficulty of the EPI datasets, the mean and standard variance of the 8 folds
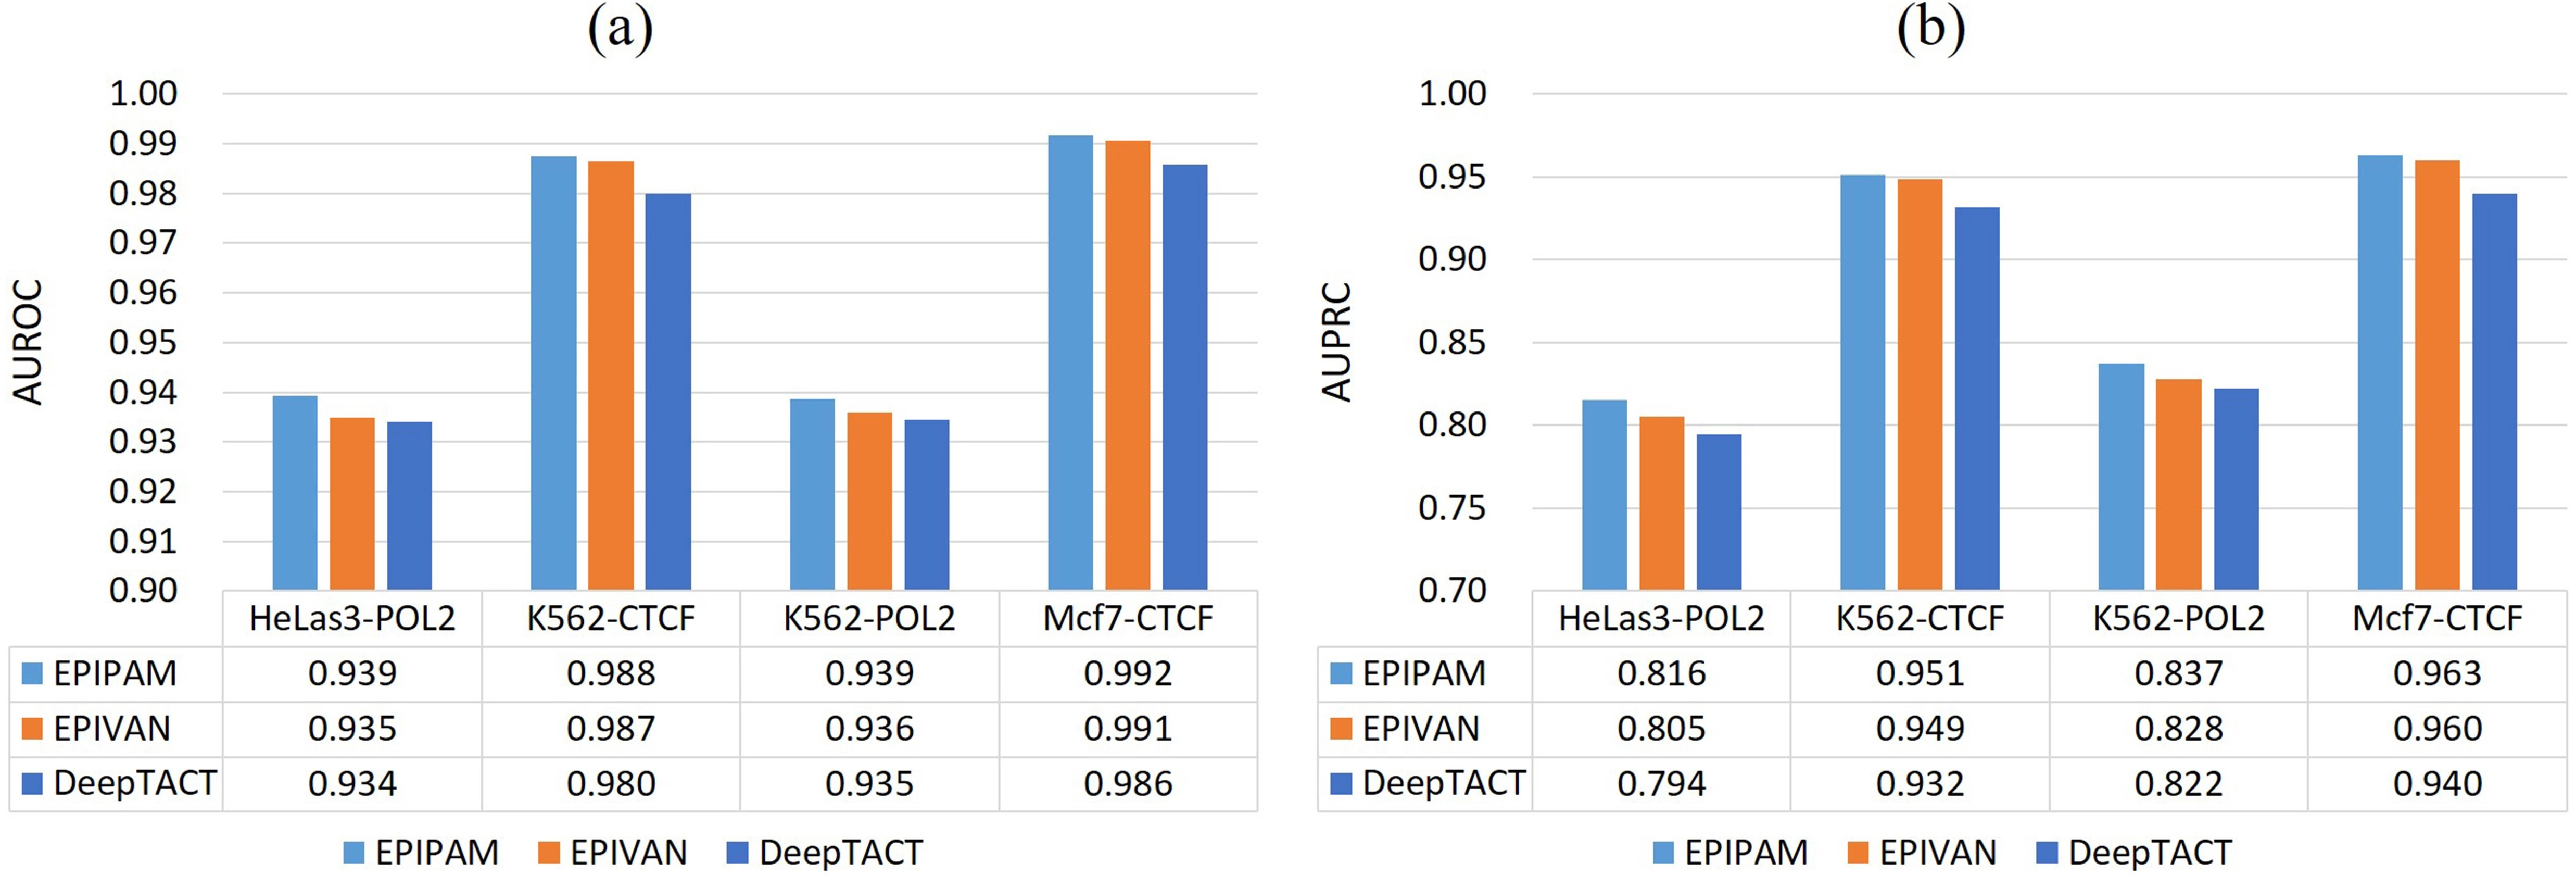
Figure 6. Performance of different methods on the test data in the ChIP-PET datasets. (a) AUROC values of EPIPAM, EPIVAN, and DeepTACT; (b) AUPRC values of EPIPAM, EPIVAN, and DeepTACT. AUROC: area under the receiver operating characteristic curve; AUPRC: area under the precision-recall curve; CTCF: CCCTC-binding factor.
Table 2. Visualization and matching of CTCF motif in K562 cell. The orientation of one end is normal while the orientation of the other end is reversed.
| Name: MA0139.1 (CTCF) Database: JASPAR2018_CORE_vertebrates_nonredundant p-value: 3.22e-09 E-value: 5.81e-06 q-value: 1.16e-05 Overlap: 19 Offset: -2 Orientation: Normal | Name: MA0139.1 (CTCF) Database: JASPAR2018_CORE_vertebrates_nonredundant p-value: 3.88e-10 E-value: 7.01e-07 q-value: 1.40e-06 Overlap: 18 Offset: -7 Orientation: Reverse Complement |
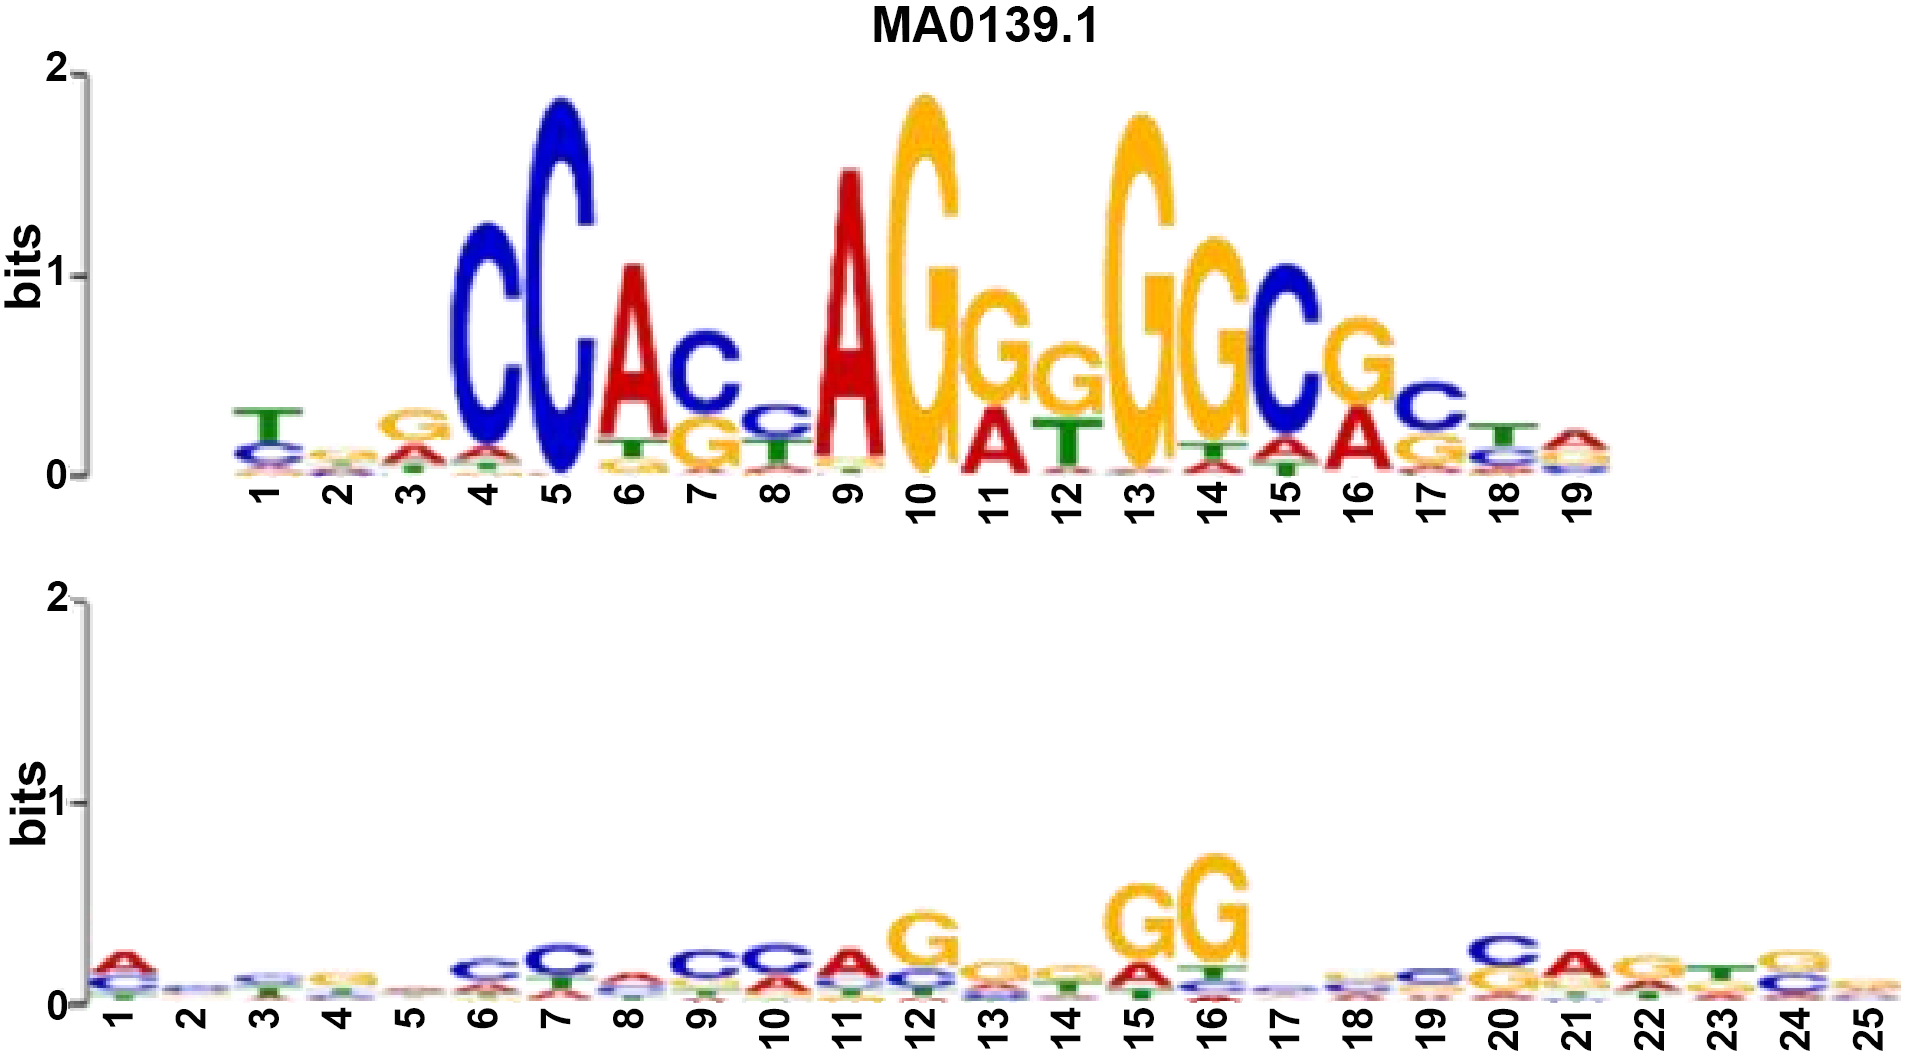 | 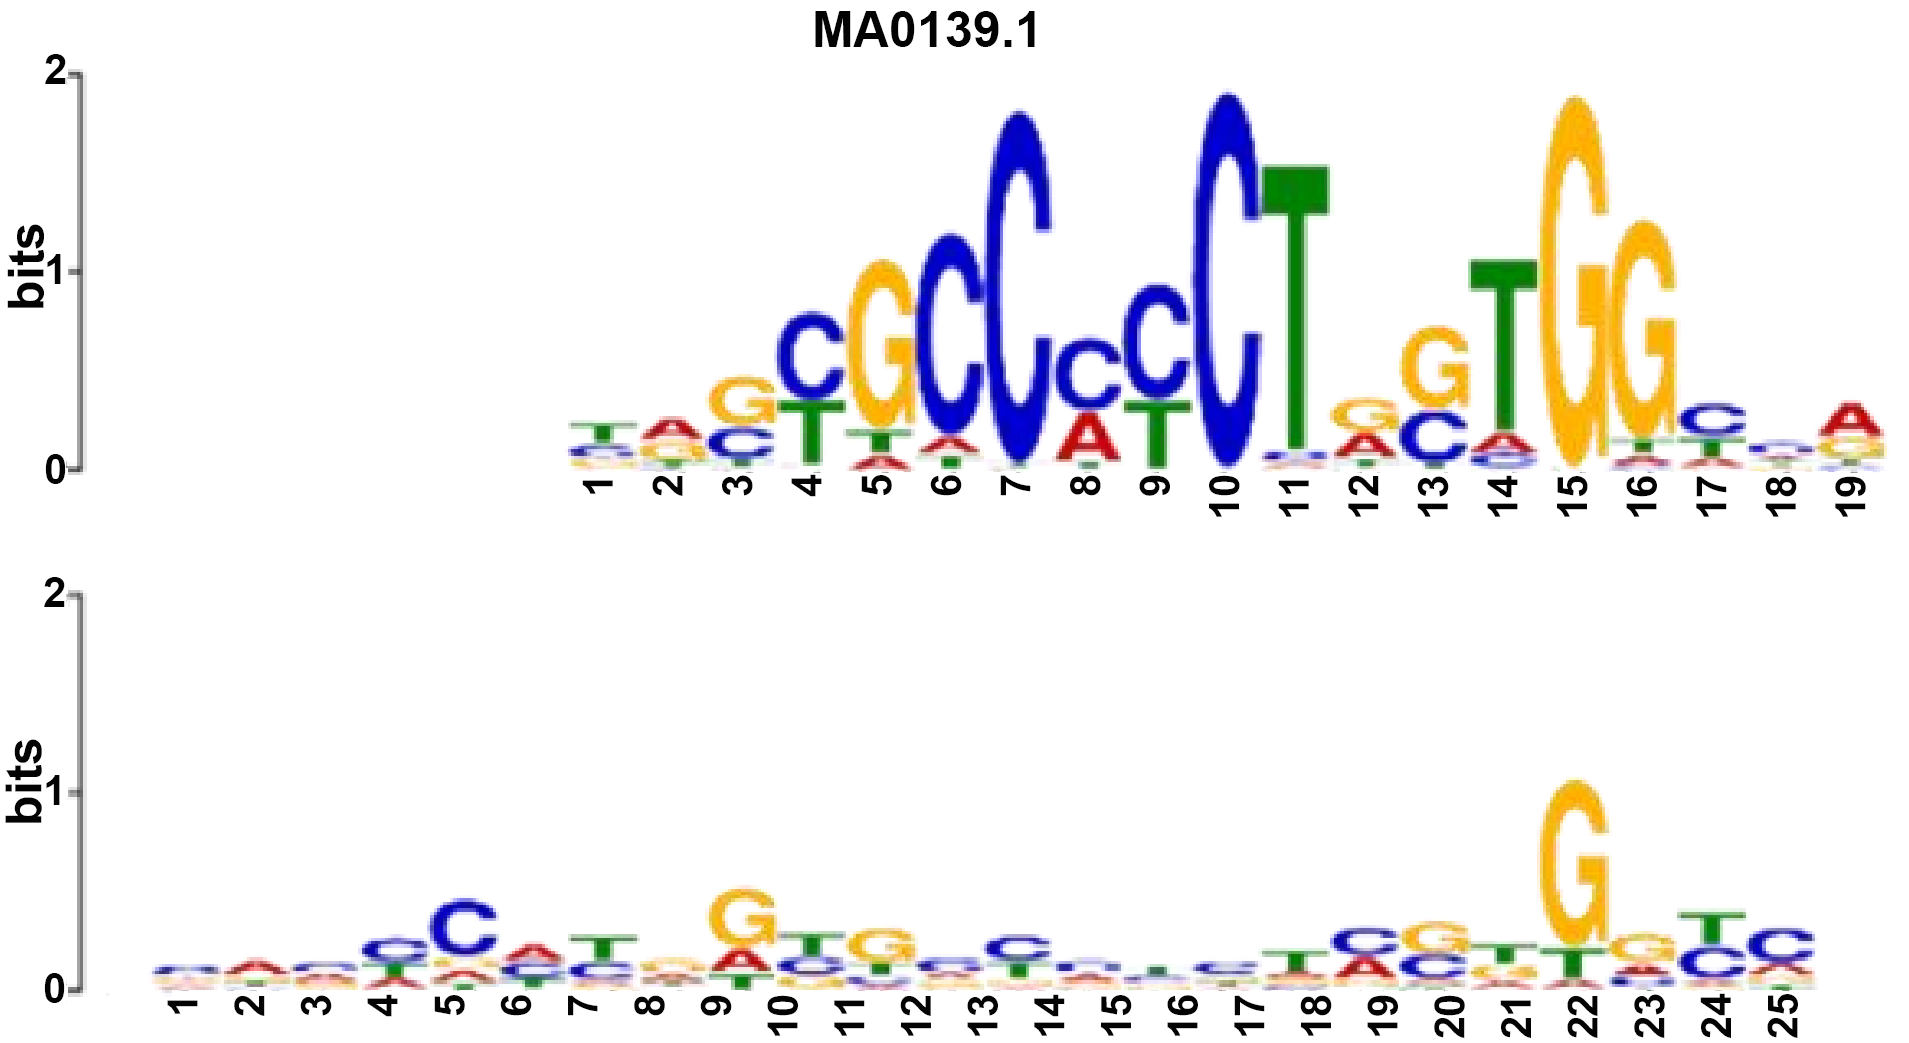 |
CTCF: CCCTC-binding factor.
4. Discussion and Conclusion
In this paper, we propose a new predictive method called EPIPAM, which uses a deep CNN architecture and a PAM to predict EPIs by only using genomic sequences. EPIPAM firstly uses the deep convolutional network to extract sequence features and then uses the PAM to compute the positional correlation coefficients of two sub-regions separately coming from enhancers and promoters. Experimental results on six cell lines indicate that our proposed method performs better than the state-of-the-art methods. More importantly, we explain why the predictive performance of all methods is overestimated, that is, the ‘split-by-random’ strategy makes the training and test data share the same EP pairs. Moreover, we analyze the possible reason that leads to the very poor predictive performance, and conduct some experiments on ChIA-PET datasets to indirectly validate the reason.
From the results, we understand the current difficulty and challenge of predicting EPIs only using genomic sequences, which makes us rethink how to accurately predict EPIs from the existing datasets. For example, instead of only using genomic sequences, whether we can integrate genomic sequences and epigenomic data to predict EPIs. However, epigenomic data also face the overlapping problem[21], and the epigenomic features of interacting and noninteracting EP pairs may not be discriminative since the enhancers and promoters of them are real ones that both have significant epigenomic marks. Another potential way is to find more discriminative predictors[22], such as CTCF motif orientation, CTCF ChIP-seq profiles, and genomic distance to CTCF. Generally speaking, EPIs prediction is still a very challenging task that needs so much effort to be done.
Several limitations of this study should be considered when interpreting the results. First, the current PAM design enforces a highly selective matching bias by emphasizing the strongest positional response between enhancer and promoter, which may underrepresent distributed or cooperative regulatory signals that depend on multiple regions. The model performs late fusion after intra-sequence reweighting and does not explicitly model token-level cross-sequence dependencies; extending the framework with multi-head or more flexible attention mechanisms may better capture such effects[23-26]. Second, the backbone uses three convolutional layers; although this configuration was chosen based on comparative experiments, depth-scaling studies were not conducted, so the relative contribution of depth versus other architectural choices remains to be fully disentangled. Third, negative samples were constructed mainly by distance-matched random sampling; although we showed that EPIPAM remains competitive under alternative negative sampling strategies, the use of more biologically representative negative sets could further strengthen claims about robustness and generalizability (Figure S1). Finally, in the comparison of the four model variants (one-hot versus embedding-based, with or without PAM), the embedding-based model was initialized with pre-trained DNA vectors, and these representations were fine-tuned during training rather than frozen; however, we did not systematically compare with other types of pretrained representations such as DNABERT or Nucleotide Transformer (Figure S2). Thus, the conclusion that one-hot encoding outperforms the embedding-based model is limited to the specific pre-trained vectors used, and the relative merit of one-hot encoding versus state-of-the-art foundation-model embeddings for EPI prediction remains to be established[27-29].
Supplementary materials
The supplementary material for this article is available at: Supplementary materials.
Authors contribution
Zhang Q: Conceptualization.
Liu L: Methodology, software,writing-original draft.
Zhu Y: Data curation, formal analysis.
Conflicts of interest
The authors declare no conflicts of interest.
Ethical approval
Not applicable.
Consent to participate
Not applicable.
Consent for publication
Not applicable.
Availability of data and materials
Data supporting the findings of this study are available from the corresponding author upon reasonable request.
Funding
This work was supported in part by the National Natural Science Foundation of China (Grant No. 62372255, No. 62333018, No. W2412087, No. 62402250, No. 62432013 and No. 62433001), the Natural Science Foundation of Zhejiang Province (Grant No. LMS25F020001), and the Key Research and Development Program of Ningbo City (Grant No. 2024Z112, No. 2023Z219 and No. 2023Z226).
Copyright
© The Author(s) 2026.
References
-
4. Schoenfelder S, Fraser P. Long-range enhancer–promoter contacts in gene expression control. Nat Rev Genet. 2019;20(8):437-455.[DOI]
-
5. Lieberman-Aiden E, van Berkum NL, Williams L, Imakaev M, Ragoczy T, Telling A, et al. Comprehensive mapping of long-range interactions reveals folding principles of the human genome. Science. 2009;326(5950):289-293.[DOI]
-
6. Fullwood MJ, Liu MH, Pan YF, Liu J, Xu H, Bin Mohamed Y, et al. An oestrogen-receptor-α-bound human chromatin interactome. Nature. 2009;462(7269):58-64.[DOI]
-
7. Mumbach MR, Rubin AJ, Flynn RA, Dai C, Khavari PA, Greenleaf WJ, et al. HiChIP: Efficient and sensitive analysis of protein-directed genome architecture. Nat Methods. 2016;13(11):919-922.[DOI]
-
8. Whalen S, Truty RM, Pollard KS. Enhancer–promoter interactions are encoded by complex genomic signatures on looping chromatin. Nat Genet. 2016;48(5):488-496.[DOI]
-
9. Talukder A, Saadat S, Li X, Hu H. EPIP: A novel approach for condition-specific enhancer–promoter interaction prediction. Bioinformatics. 2019;35(20):3877-3883.[DOI]
-
10. Yang Y, Zhang R, Singh S, Ma J. Exploiting sequence-based features for predicting enhancer–promoter interactions. Bioinformatics. 2017;33(14):i252-i260.[DOI]
-
13. Le NQK, Ho QT, Nguyen VN, Chang JS. BERT-Promoter: An improved sequence-based predictor of DNA promoter using BERT pre-trained model and SHAP feature selection. Comput Biol Chem. 2022;99:107732.[DOI]
-
14. Singh S, Yang Y, Póczos B, Ma J. Predicting enhancer-promoter interaction from genomic sequence with deep neural networks. Quant Biol. 2019;7(2):122-137.[DOI]
-
15. Zhuang Z, Shen X, Pan W. A simple convolutional neural network for prediction of enhancer–promoter interactions with DNA sequence data. Bioinformatics. 2019;35(17):2899-2906.[DOI]
-
16. Hong Z, Zeng X, Wei L, Liu X. Identifying enhancer–promoter interactions with neural network based on pre-trained DNA vectors and attention mechanism. Bioinformatics. 2020;36(4):1037-1043.[DOI]
-
17. Li W, Wong WH, Jiang R. DeepTACT: Predicting 3D chromatin contacts via bootstrapping deep learning. Nucleic Acids Res. 2019;47(10):e60.[DOI]
-
19. Gupta S, Stamatoyannopoulos JA, Bailey TL, Noble WS. Quantifying similarity between motifs. Genome Biol. 2007;8(2):R24.[DOI]
-
20. Fudenberg G, Imakaev M, Lu C, Goloborodko A, Abdennur N, Mirny LA. Formation of chromosomal domains by loop extrusion. Cell Rep. 2016;15(9):2038-2049.[DOI]
-
21. Whalen S, Pollard KS. Reply to ‘Inflated performance measures in enhancer–promoter interaction-prediction methods’. Nat Genet. 2019;51(8):1198-1200.[DOI]
-
22. Belokopytova PS, Nuriddinov MA, Mozheiko EA, Fishman D, Fishman V. Quantitative prediction of enhancer–promoter interactions. Genome Res. 2020;30(1):72-84.[DOI]
-
23. Ahmed FS, Aly S, Liu X. EPI-Trans: An effective transformer-based deep learning model for enhancer promoter interaction prediction. BMC Bioinform. 2024;25:216.[DOI]
-
24. Liu B, Zhang W, Zeng X, Loza M, Park SJ, Nakai K. TF-EPI: An interpretable enhancer-promoter interaction detection method based on Transformer. Front Genet. 2024;15:1444459.[DOI]
-
25. Avsec Ž, Agarwal V, Visentin D, Ledsam JR, Grabska-Barwinska A, Taylor KR, et al. Effective gene expression prediction from sequence by integrating long-range interactions. Nat Methods. 2021;18(10):1196-1203.[DOI]
-
26. Chen KM, Wong AK, Troyanskaya OG, Zhou J. A sequence-based global map of regulatory activity for deciphering human genetics. Nat Genet. 2022;54(7):940-949.[DOI]
-
27. Ji Y, Zhou Z, Liu H, Davuluri RV. DNABERT: Pre-trained Bidirectional Encoder Representations from Transformers model for
DNA-language in genome. Bioinformatics. 2021;37(15):2112-2120.[DOI] -
28. Zhou Z, Ji Y, Li W, Dutta P, Davuluri R, Liu H. DNABERT-2: Efficient foundation model and benchmark for multi-species genome. arXiv:2306.15006 [Preprint]. 2023.[DOI]
-
29. Dalla-Torre H, Gonzalez L, Mendoza-Revilla J, Lopez Carranza N, Grzywaczewski AH, Oteri F, et al. Nucleotide Transformer: Building and evaluating robust foundation models for human genomics. Nat Methods. 2025;22(2):287-297.[DOI]
Copyright
© The Author(s) 2026. This is an Open Access article licensed under a Creative Commons Attribution 4.0 International License (https://creativecommons.org/licenses/by/4.0/), which permits unrestricted use, sharing, adaptation, distribution and reproduction in any medium or format, for any purpose, even commercially, as long as you give appropriate credit to the original author(s) and the source, provide a link to the Creative Commons license, and indicate if changes were made.
Publisher’s Note
Science Exploration remains a neutral stance on jurisdictional claims in published
maps
and institutional affiliations. The views expressed in this article are solely those
of
the author(s) and do not reflect the opinions of the Editors or the publisher.
Share And Cite


Science Exploration Style
Liu L, Zhu Y, Zhang Q. A deep learning framework with positional attention for modeling enhancer-promoter interactions. Comput Biomed. 2026;1:202525. https://doi.org/10.70401/cbm.2026.0013
Tips
Copy completed.
Submit a Manuscript
Author Instructions
Cite this Article
Article Metrics
0
View
0
Download
Cited
Article Updates

Science Exploration Style
Liu L, Zhu Y, Zhang Q. A deep learning framework with positional attention for modeling enhancer-promoter interactions. Comput Biomed. 2026;1:202525. https://doi.org/10.70401/cbm.2026.0013
copy
Share Link
copy