Verification of seismic enforced-displacement pushover procedure on torsionally flexible, asymmetric, multi-storey r/c buildings
Athanasios P. Bakalis
1,2
,
Triantafyllos K. Makarios
1,2,*

*Correspondence to:
Triantafyllos K. Makarios, School of Civil Engineering, Aristotle University of Thessaloniki; Institute of Structural Analysis and Dynamics of Structures, Thessaloniki 54631, Greece.
E-mail: makariostr@civil.auth.gr
J Build Des Environ. 2023;1:8290. 10.37155/2811-0730-0201-2
Received: August 08, 2022Accepted: March 06, 2023Published: May 25, 2023
Abstract
A recently proposed direct Displacement-based procedure of nonlinear static (pushover) analysis on multi-storey reinforced concrete (r/c) buildings is verified here against the results of nonlinear response history analysis. An asymmetric, regular in elevation, torsionally flexible, multi-storey r/c building designed according to Eurocode EN 1998 is investigated. Taking fully into account the inelastic torsion and the higher mode effects, as well as the P-Delta effects, the proposed procedure applies a pattern of seismic floor enforced-displacements along the “Capable Near Collapse Principal Axes of the building”, aiming at the Near Collapse state. The envelope of the results of sixteen final non-linear static analyses on the investigated building shows that the main aspects of the spatial seismic action effects can be safely captured by the proposed procedure, especially regarding the inelastic interstorey drift ratios, as well as the plastic mechanism of the building.
Keywords
Seismic enforced-displacements, interstorey drift ratios, nonlinear static analysis, pushover analysis, response history analysis, capable near collapse centre of stiffness, torsionally flexible building
1. Introduction
The main weakness of the nonlinear static (pushover) procedure proposed by the contemporary seismic codes, as is Eurocode EN 1998-1, is its inability to properly predict the seismic interstorey drift ratios over the height of multistorey r/c buildings. Indeed, the interstorey drift ratios of asymmetric multi-storey buildings are the most representative response measure that controls the distribution of the local inelastic deformations of the structural elements, in plan and in height of the multistorey building, and hence of the structural damage[1,2]. Interstorey drift ratios are usually underestimated by the code-proposed pushover procedure due to the consideration that the building response is controlled only by the fundamental mode, ignoring the contribution of the higher and torsional modes that develop in the linear area and significantly affect the behavior in the non-linear area of response. Another weakness of the code-proposed pushover procedure is the use of the superposition technique on nonlinear analyses results, into the nonlinear area of response, to consider the spatial seismic action[3]. Additionally, the lack of proposals by the seismic codes about the main loading directions of buildings as well as for the proper consideration of the torsional sensitivity of buildings in pushover analysis raises questions about the correct/rational application of the pushover procedure. The last two issues are directly affected by the lack of definition on the one hand of the real inelastic centre of stiffness and on the other hand of the real inelastic torsional radii of the multi-storey buildings, which are continuously alter in the non-linear response region. These issues have been investigated recently by Bakalis and Makarios[4-7], Makarios and Bakalis[8,9] and Bakalis et al.[10]. Lastly, P-Delta effects should always be considered in the framework of non-linear analysis, an issue which is not emphasized enough in the seismic codes.
To deal with the inelastic torsion or/and the contribution of higher modes in the linear (and maybe into the nonlinear) response of buildings, a large number of improved pushover procedures have been developed the last two decades. These procedures use either an invariable loading vector or a variable one, usually consisting of monotonically increasing floor forces and torques (Forced-based procedures) but in some cases also of floor enforced displacements (Direct Displacement-based procedures). The first category includes the multi-mode procedures[11-17], pushover procedures combined with some kind of linear dynamic analysis[18-21] and pushover procedures that use dynamic or corrective eccentricities in order to apply the floor lateral loads[4-6,8,10,22,23]. The adaptive pushover procedures[24-29] belong to the second category. The effectiveness of the improved pushover procedures on the seismic assessment of buildings is discussed in several published research papers[30-36]. The computational cost and the complexity of implementing some of the improved pushover procedures is another important issue to emphasize, as simplicity and clearness are key points in order to have a useful tool for the assessment of the seismic capacity of structures.
To provide a comprehensive treatment of all the previously mentioned weaknesses of the code-proposed pushover procedure on multi-storey reinforced concrete (r/c) buildings, a simple Direct Displacement-based pushover procedure has been recently proposed by Makarios and Bakalis[10], Bakalis and Makarios[7]. According to this procedure, three seismic enforced-displacements are applied at each floor-diaphragm with respect to an ideal inelastic principal reference system of the multi-storey r/c building: two floor enforced-translations and one floor-enforced rotation. These seismic, drift-based, floor enforced-displacements are the outcome of a large parametric analysis on multi-storey r/c buildings and aim directly at the seismic performance level of Near Collapse (NC). Using all possible sign combinations of the three floor enforced displacements, eight final pushover analyses are performed along each main loading direction and the envelope of a total of sixteen analyses provides an accurate prediction of the seismic demand, especially as regards the distribution in-plan and in-elevation of the seismic interstorey drift ratios. Key point of the process is the definition of an ideal inelastic principal reference system of the multi-storey r/c building (CRsec (Isec, IIsec, IIIsec)) at the Near Collapse state, by considering that all the structural members have developed plastic hinges at their two ends. This reference system is called as “Capable Near Collapse Principal System of the multi-storey r/c building”. Also, the torsional sensitivity of the multi-storey r/c building is examined relative to this ideal principal system using an enchased formula. The proposed pushover procedure can be used for the seismic assessment of any asymmetric, torsionally flexible or not, ductile, multi-storey r/c building. Regularity in elevation of the building and the formation of whatever type of plastic mechanism (except the mechanism of soft-storey) are the mandatory conditions to apply the procedure. A possible practical implementation of the proposed pushover procedure into codification could concern the safe estimation of the seismic demands of asymmetric r/c buildings at the Near Collapse state, especially of the interstorey drift ratios at the stiff sides of torsionally flexible buildings.
It is noted that, the effectiveness of the proposed pushover procedure with enforced displacements has been fully verified in the first author’s doctoral dissertation[37]. Various regular in elevation, ductile, multistorey r/c buildings were examined there, with varying number of floors, structural type, static eccentricity, and torsional sensitivity. In this paper, the effectiveness of the proposed procedure is verified by the seismic assessment of an asymmetric, torsionally flexible, six-storey r/c building using the nonlinear response history analysis.
2. Application Steps of the Enforced-Displacement Pushover Procedure
The basic steps for the application of the enforced-displacement pushover procedure are summarized here. It is noted that the proposed procedure follows the rationale of Eurocode EN 1998-3 on the secant stiffness at yield of structural r/c elements (EIsec), to properly simulate the extreme capable Near Collapse state of the building. Full details of the proposed methodology can be found in References[7,9,37].
2.1 End-section analysis of r/c elements
Given the geometry and reinforcement details of the end-sections of all structural elements, section analysis provides the Moment-Curvature (M-φ) diagrams which are then bilinearized to extract the yield moment My of each end-section. These diagrams are converted to Moment-Chord Rotation (M-θ) diagrams by using the plastic hinge length Lpl proposed in the Informational Annex A of EN 1998-3 (Eqs. A4 and A9). In addition, Eqs. A10 or A11 in the same Annex of EN 1998-3 can be used for the calculation of the chord rotation at yield θy.
2.2 Secant stiffness at yield of r/c elements
The secant stiffness at yield of the end-sections of each structural element is calculated according to EN 1998-3 (Informational Annex A.3.2.4(5)):
Where My and θy are respectively the yield moment and the chord rotation at yield calculated in the previous step and Lv is the shear span, usually taken equal to half the clear length of the structural elements. The secant stiffness at yield to be assigned to each structural member of the non-linear model of the building is the average of the corresponding stiffness of their two end-sections for negative and positive bending.
2.3 Non-linear model. Definition of an ideal inelastic principal reference system of the multi-storey r/c building
The secant stiffness at yield must be assigned to each structural member in the nonlinear model of the r/c building. This is mandatory in EN 1998-3[38] for the verification in terms of deformations. The same rationale is adopted by the proposed procedure. This implies the formation of plastic hinges at both end-sections of all the structural members of the building model. But this is an ideal state, characterized by the authors as the extreme Capable Near Collapse state. By considering this state of full plastic mechanism at NC, the verification of the building is always on the safe side, because the building is more flexible, and the displacements and deformations are slightly enlarged at the NC state. To simulate the locations of all possible plastic deformations in the nonlinear model, concentrated plastic hinges should be inserted at the critical end-sections of each structural member.
In the previously formed non-linear model, the following must be determined: (a) the inelastic Centre of Stiffness (CRsec) of the multistorey r/c building and, hence, the in-plan location of the inelastic vertical Principal Axis (IIIsec) passing through it, (b) the inelastic horizontal Principal Axes (Isec, IIsec) of the multistorey r/c building, (c) the inelastic Torsional radii (γI,sec, γII,sec) of the multistorey r/c building. All the previously mentioned can be determined by performing a set of linear analyses, using the well-known methodology forC the identification of the vertical fictitious elastic axis (torsional optimum axis) of the multi-storey building[39-49]. CRsec is the pole of rotation into the floor-diaphragm closest to the height of 0.8 Htot, where Htot is the total building height. Thus, the above methodology approximately defines an inelastic, ideal, 3D Principal Reference System CRsec (Isec, IIsec, IIIsec) for the application of non-linear methods of analysis aiming at the NC state, which is the “Capable Near Collapse Principal System of the multi-storey r/c building” so named by the authors. The term inelastic was selected because of the non-linear characteristics (My, θy) used in the calculation of the secant stiffness at yield (Eq. 1). Therefore, all the above inelastic properties of the multi-storey r/c building are strength dependent. The inelastic static eccentricity of the multi-storey r/c building along the Isec or IIsec axis is equal to the distance along the same direction between the location of the center of mass CM in each floor and that of the vertical Principal axis IIIsec. The two main loading directions coincide with the directions of the horizontal Principal Axes Isec and IIsec.
The (mean) torsional sensitivity of the multi-storey r/c building is verified by the following equation:
where
2.4 Proposed vectors of floor enforced-displacements
Figure 1 and Figure 2 illustrate the proposed patterns in elevation of the seismic enforced interstorey drift ratios γI;II and of the seismic floor enforced-rotations ψR,III used in the framework of the proposed procedure for the verification of the building at the performance level of NC. These enforced displacements are the outcome of a large parametric analysis in various regular in elevation, ductile, multi-storey r/c buildings designed according to EN 1998-1 for Ductility Class High, by performing nonlinear response history analysis (N-LRHA) and always considering the influence of P-Delta effects. The parameters examined were the structure type (as defined in EN 1998-1[3]), the number of floors, the inelastic statistic eccentricity and the torsional sensitivity. The proposed values of Figure 1 and Figure 2 are mean values determined through a statistical processing.
Figure 1. Proposed seismic enforced interstorey drift ratios γI,i, or γII,i, (rad) in elevation for the NC performance level, at the location of the vertical axis IIIsec and along the horizontal directions Isec and IIsec (all cases of inelastic static eccentricity and torsional sensitivity). NC: near collapse.
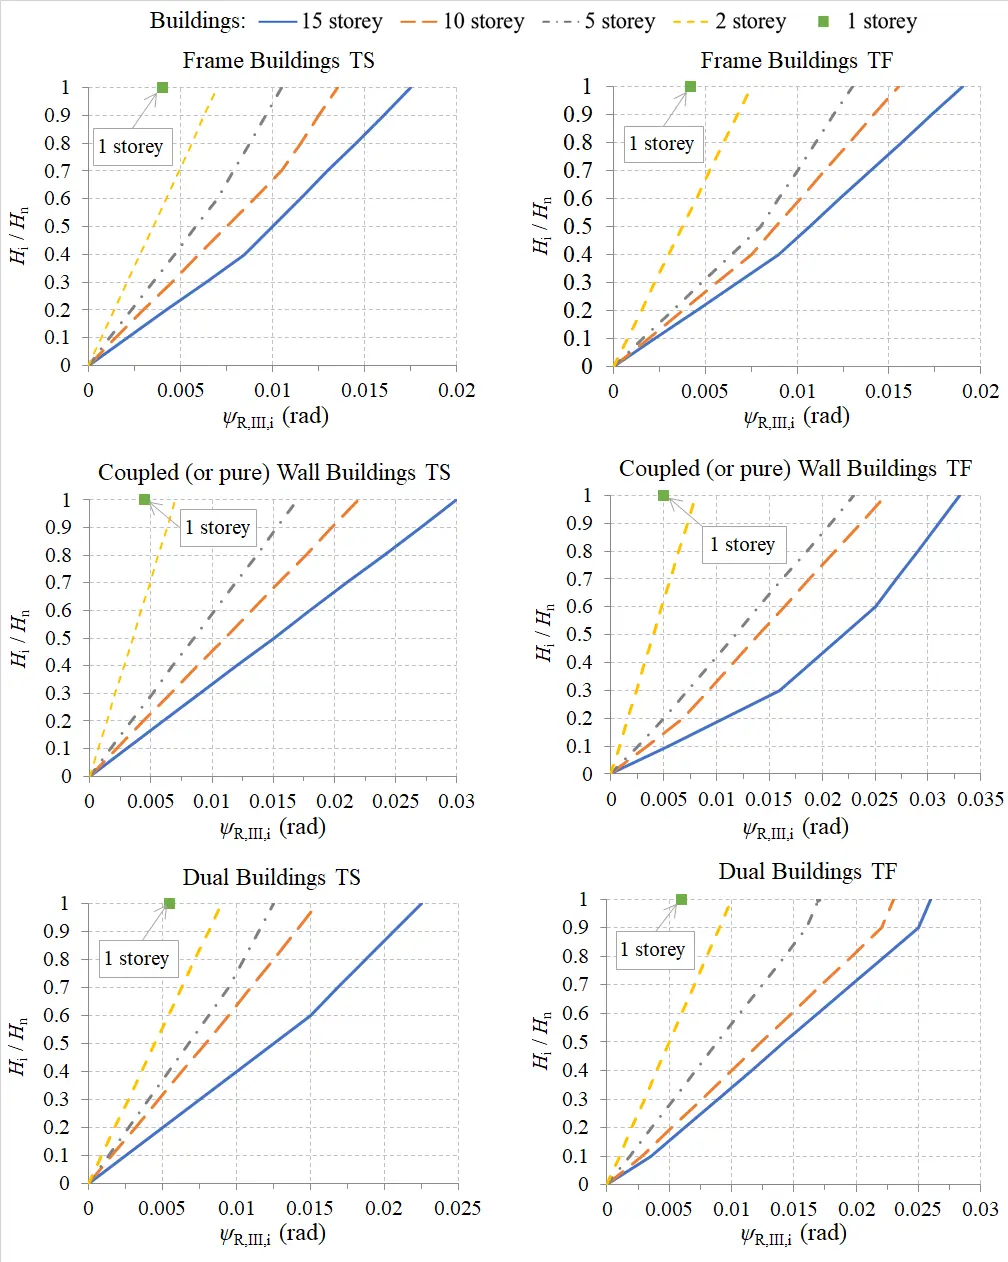
Figure 2. Proposed seismic floor enforced-rotations ψR,III,i (rad) about vertical axis in elevation for the NC performance level (all cases of inelastic static eccentricity). NC: near collapse.
In Figure 1 and Figure 2, Hi/Hn is the relative height of the examined level (Hi, measured from the ground level) to the total building height Hn. Linear interpolation can be performed for intermediate number of stories. The parameters used in Figure 1 are the structural type and the number of stories. In Figure 2, the torsional sensitivity is an additional parameter (TF for torsionally flexible buildings and TS for torsionally stiff buildings). Figure 1 and Figure 2 provide proposed patterns of γI;II and ψR,III along each horizontal direction Isec and IIsec, separately. Then, the unique values of the i-floor enforced-rotations ψR,III,i are obtained as the average of the corresponding values along each horizontal direction. The proposed values of seismic enforced interstorey drift ratios γI;II (rad) in elevation are converted to floor enforced translational displacements ψI;II using the following equations:
Where H is the floor height. It is noted that the value of γI,II,i·Hi gives directly the i-floor seismic drift along the horizontal direction Isec or IIsec. The proposed values of floor enforced-displacements given by Eq. 3 are further adapted to the building under seismic evaluation following the procedure of the next step.
2.5 Temporary nonlinear static analyses along the ideal principal axes Isec and IIsec of the multi-storey building
The proposed patterns of floor enforced interstorey drift ratios γI;II can be adapted more specifically to the examined r/c multi-storey building by the envelope of two temporary sets of pushover analyses (with lateral floor forces and considering the P-Delta effects) along the horizontal directions Isec and IIsec. In the first set of pushover analyses (2 analyses along the Isec axis and more 2 analyses along the IIsec axis, considering the two signs (±) of application of the floor lateral forces), the floor lateral forces are applied at the location of the vertical IIIsec axis having a pattern according to the first uncoupled fundamental translational mode along each horizontal ideal direction, Isec or IIsec.
The second set of pushover analyses is similar to the first (2 analyses along the Isec axis and 2 analyses along the IIsec axis, considering the two signs (±) of application of the floor lateral forces) with the difference that only the 80% of the base shear is used, while the remainder 20% of the base shear is applied as a concentrated lateral load at the top of the vertical IIIsec axis. In both sets, the value of the base shear that is distributed in elevation can be considered equal to one (unit base shear). The target displacement of the two temporary sets of pushovers can be obtained from Table 1. This table contains the results of a large parametric analysis on multi-storey r/c buildings about the mean value of the seismic drift ratio γt,top of the building top at the location of the vertical IIIsec axis, along the directions of the Isec and IIsec axes. For intermediate structural types of dual systems (consisting of frames and walls) or coupled (via beams) wall systems, as well as for various number of storeys, linear interpolation is performed. These values are valid for all cases of inelastic static eccentricity and torsional sensitivity. The final values of the proposed interstorey drift ratios, which will be used to calculate the floor enforced translational displacements of the proposed procedure along the Isec and IIsec axes (Eq.3), are calculated as the average of the proposed values of Figure 1 and of those computed from the envelope of the two temporary sets of pushover analyses[37]. It should be noted that, in[7], the envelope of the γI;II values from the three previous sources was initially proposed for the safe calculation of the enforced translational displacements. However, the difference is small and in the first author’s doctoral dissertation the average values were preferred, mainly for the most efficient adjustment of the γI;II values at the lower floors of multi-storey r/c buildings.
Table 1. Mean seismic (target) drift ratio γt,top (rad) of the building at the NC state, on the top of the vertical ideal axis IIIsec and along the horizontal ideal principal axes Isec and IIsec.
| Number of Storeys | 1 | 2 | 5 | 10 | 15 |
| Pure frame buildings without walls | 0.0300 | 0.0295 | 0.0235 | 0.0205 | 0.0195 |
| Pure wall buildings without frames | 0.0280 | 0.0290 | 0.0260 | 0.0240 | 0.0230 |
2.6 Enforced-displacement combinations to consider the spatial action of the earthquake
To consider the spatial character of the seismic action, the three enforced-displacements ψI,i, ψII,i and ψR,III,i should act simultaneously on the location of the vertical IIIsec axis inside each i-floor but with an appropriate way along each main loading direction Isec and IIsec. Therefore, the floor enforced translational displacement along the examined (main) loading direction keep its full value inside the combinations while the second floor enforced translational displacement, along the other (normal) direction, is inserted in the combinations with 30% of its full value. Considering the two signs (±) of action of the floor enforced-displacements, eight possible combinations of them are obtained for each one of the main loading directions Isec and IIsec. These combinations are presented in Table 2 and Table 3, in which the “+” or “-” symbol indicates with emphasis the combined values of seismic enforced-displacements.
Table 2. Earthquake spatial action of simultaneous floor enforced-displacements that maximize the displacement along Isec axis.
| Eight (8) enforced-displacement combinations of nonlinear static analysis | |
| “+”ψI,i “+”0.3·ψII,i “+”ΨR,III,i | “+”ψI,i “+”0.3·ψII,i “-”ΨR,III,i |
| “+”ψI,i “-”0.3·ψII,i “+”ΨR,III,i | “+”ψI,i “-”0.3·ψII,i “-”ΨR,III,i |
| “-”ψI,i “+”0.3·ψII,i “+”ΨR,III,i | “-”ψI,i “+”0.3·ψII,i “-”ΨR,III,i |
| “-”ψI,i “-”0.3·ψII,i “+”ΨR,III,i | “-”ψI,i “-”0.3·ψII,i “-”ΨR,III,i |
Table 3. Earthquake spatial action of simultaneous floor enforced-displacements that maximize the displacement along IIsec axis.
| Eight (8) enforced-displacement combinations of nonlinear static analysis | |
| “+”0.3·ψI,i “+”ΨII,i “+”ΨR,III,i | “+”0.3·ψI,i “+”ΨII,i “-”ΨR,III,i |
| “+”0.3·ψI,i “-”ΨII,i “+”ΨR,III,i | “+”0.3·ψI,i “-”ΨII,i “-”ΨR,III,i |
| “-”0.3·ψI,i “+”ΨII,i “+”ΨR,III,i | “-”0.3·ψI,i “+”ΨII,i “-”ΨR,III,i |
| “-”0.3·ψI,i “-”ΨII,i “+”ΨR,III,i | “-”0.3·ψI,i “-”ΨII,i “-”ΨR,III,i |
2.7 Estimation of the seismic demand
The sixteen final pushover analyses of Table 2 and Table 3 are performed using as target displacement the value of the enforced translational displacement at the top of the vertical axis IIIsec, along each main loading direction Isec and IIsec. Therefore, the target displacement is equal to the value ψI;II,n calculated by Eq. 3b, where n is the top floor. The envelope of the response of the sixteen pushover analyses of the proposed procedure provides a safe prediction of the seismic demand at the NC state, especially as regards the interstorey drift ratios. The floor displacements are computed slightly conservatively in multi-storey buildings with more than three floors and are corrected according to the next step.
2.8 Correction of the floor displacement profiles
Since the goal of the proposed pushover procedure with floor enforced-displacements is to capture the maximum interstorey drift ratios of each floor-diaphragm, the estimates for the floor seismic displacement profiles will be slightly conservative, especially from the middle height of a multi-storey building to its top[1]. The abovementioned issue can be observed in multi-storey buildings with more than three floors. This is inevitable, since the floor enforced-displacements ψI;II are calculated sequentially with Eq. 3, from the base of the building to its top, through the proposed interstorey drift ratios γI,II which estimated conservatively in the parametric analysis with N-LRHA and express the maximum seismic interstorey drift ratios observed in the different floors of the building. However, these maximum values of interstorey drift ratios do not occur simultaneously.
To correct this conservatism, the values of γt,top in Table 1 can be used as a weighting factor on the value of the enforced translational displacement ψI;II,n at the top of the building calculated by Eq. 3. Therefore, the following reduction factor Su is proposed to apply totally on the floor displacement profiles along the Isec and IIsec axes[37]:
Where Hn is the total height of the building, γt,top is taken from Table 1 and ψn is calculated by Eq. 3. The use of the reduction factor Su is proposed for multi-storey buildings with four or more floors. The decrease shown on the floor displacement profiles by this factor is about 7-15%, where the largest values apply to high-rise buildings.
3. Numerical Example of a 6-storey Dual Building
3.1 Building characteristics
The six-storey r/c building shown in Figure 3 is examined to verify the proposed pushover procedure on torsionally flexible multi-storey buildings. The construction materials are concrete C25/30 and steel B500c with mean strengths fcm = 33 MPa and fym = 550 MPa, respectively. The building has a polygonal plan shape consisting of perimetric and interior frames and of perimetric walls. A 15 cm thick rigid floor-diaphragm is extended outside the perimeter of the floor plan forming a continuous cantilever 1 m wide. The cross-sections of all the structural elements do not change in elevation. Εach floor has 3.5 m height, giving a total building height of 21 m. The six-storey building is regular in elevation but asymmetric in-plan, mainly due to the placement of walls at the building perimeter (two walls along x and y directions and a skew one). The x and y walls have rectangular cross-sections of dimensions 1.5/0.3 m and 0.3/1.8 m while the skew one has a rectangular section 1.5/0.3 m having a barbell at one end of dimension 0.5/0.5 m. All the columns are square of dimensions 0.5/0.5 m. The beams have a T-section of dimensions 30/60/150/15, where the effective flange width is considered different in linear and nonlinear analysis (1.5 m in nonlinear analysis and according to EN 1998-1 and EN 1992-1[51] in linear analysis). The mean gravitational distributed load on all floors -including self-weights and masonry- (dead G + live Q) is about 12 kN/m2, giving a translational mass of 450 tn and a mass moment of inertia about vertical axis of 34,000 tn·m2 for each floor. The latter is artificially increased to 60,000 tn·m2 in each floor, in order to have a torsionally flexible building (on limit).

3.2 Building design
The building is designed according to the provisions of EN 1992-1 and EN 1998-1 for Ductility Class High. Modal response spectrum analysis was performed in the linear building model with PGA = 0.24 g (where g is the gravity acceleration), soil category D and total behavior factor q = 4.
All the structural members of the linear model have been provided with their effective flexural and shear stiffness, equal to one-half of their respective geometric stiffness. The building is classified into the structural type of dual buildings, equivalent to frame buildings according to EN1998-1, along both the horizontal ideal principal axes Ides and IIdes. The translational uncoupled periods of the linear model are 1.15 sec along the IIdes axis and 1.05 sec along the Ides axis. The horizontal ideal principal axes Ides and IIdes of the linear model are rotated relative to the x,y-axes by 14.06o counterclockwise. The two static eccentricities eI,des and eII,des along the Ides and IIdes axes (distance between CRdes and CM in the floor-diaphragm closest to the 0.8 Htot level (fifth floor) from the base) are about equal to 0.06·LI,des and -0.13·LII,des respectively, where LI,des and LII,des are the maximum plan dimensions along the two horizontal principal axes. Additionally, the building is characterized as torsionally flexible since the (mean) normalized torsional radii rII,des/rm = 0.96 is less than 1 (the other ratio rI,des/rm is equal to 1.06), where rm = 11.55 m is the radius of gyration of the floor-mass at the fifth floor. The as designed building has appropriate longitudinal/confinement steel reinforcement details that provide an overall high ductile behavior, spreading the ductility demands to the end-sections of all beams and to the base end-sections of all columns/walls (beam-sway mechanism). The numbering of the structural members in the mathematical model of the building, the dimensions of the cross-sections and the reinforcement details are presented in Figure S1 and in Table S1, Table S2, and Table S3.
3.3 Non-linear model of the building
Section analysis is performed by the module Section Designer of the FEM program SAP2000[52] which is used as the analysis tool. Having the M-φ curves along the local axes of the end-sections of all the structural members, as well as their shear span Lv and the plastic hinge length Lpl by the Eq. A9 of EN 1998-3 (with γel coefficient equal to 1.7), we can obtain the respective M-θ curves and subsequently calculate the secant stiffness at yield EIsec of all the structural members of the nonlinear building model (Eq. 1). The mean values in elevation of the ratio EIsec/EIg for each type of structural member of the nonlinear model are shown in Table 4, where EIg is the geometric stiffness. These values vary along the two local axes of columns and walls (2 and 3 axes) due to the different shear span Lv in four columns with cantilever bending mode and due to the different strength My and shear span Lv along the strong (axis 3) and weak (axis 2) directions of walls. We can observe the low values of the members’ bending stiffness, especially those of beams. These EIsec values are assigned to all the structural members of the nonlinear building model.
Table 4. Mean values in elevation of the ratio of the secant stiffness at yield to the geometric stiffness, EIsec/ EIg.
| Columns | Walls | Beams | |||
| storey | Local 3 | Local 2 | Local 3 | Local 2 | Local 3 |
| 1 | 0.16 | 0.19 | 0.30 | 0.21 | 0.105 |
| 2 | 0.15 | 0.19 | 0.27 | 0.20 | 0.110 |
| 3 | 0.15 | 0.18 | 0.20 | 0.15 | 0.110 |
| 4 | 0.12 | 0.13 | 0.16 | 0.13 | 0.095 |
| 5 | 0.11 | 0.12 | 0.11 | 0.10 | 0.085 |
| 6 | 0.10 | 0.10 | 0.07 | 0.08 | 0.075 |
The “Capable Near Collapse Principal System, IIIsec(CRsec), Isec, IIsec” of the six-story r/c building is next determined according to Section 2, at the floor-diaphragm closest to the level 0.8 Htot = 16.8 m from the building base, i.e., at the fifth floor with height equal to 17.5 m from the ground. Figure 3 shows the in-plan location of the inelastic center of stiffness CRsec and the orientation of the horizontal ideal inelastic principal axes C, IIsec in the nonlinear building model.
The latter are turned relative to the x, y-axes by 11.5o counterclockwise. The inelastic static eccentricities are equal to eR,Isec = 2.3 m and eR,Isec = 2.63 m and their normalized values are equal to eR,Isec/ LIsec = 0.09 and eR,IIsec/ LIsec = -0.013, where LIsec and LIIsec are the maximum plan dimensions along the axes Isec and IIsec, respectively. The (mean) normalized inelastic torsional radii are equal to rII,sec/rm = 0.95 and rI,sec/rm = 1.06, where rm = 11.55 m is the radius of gyration of the floor-mass at the fifth floor. Therefore, the nonlinear building model is characterized as torsionally flexible according to Eq. 2, because the smaller of the two torsional radii ratios (0.95) is lower than 1.10. We come to the same conclusion by examining the uncoupled fundamental modes of the non-linear model, with periods of TIIsec = 2.23 sec, TIsec = 2.00 sec for the translational ones and TR,IIIsec = 2.11 sec for the torsional one. In Table 5, the periods and the modal participating mass ratios of the first nine mode-shapes of the nonlinear model of the building are presented. Additionally, the building is classified according to EN1998-1 into the structural type of dual buildings, equivalent to wall buildings along the horizontal axis Isec and to frame buildings along the other horizontal axis IIsec. This difference in structural classification along the Isec between the nonlinear (dual equivalent to wall buildings) and linear (dual equivalent to frame buildings) building models is mainly due to the greater reduction of the lateral stiffness of the frames relative to that of the walls because of the consideration of the secant stiffness at yield (Table 4).
Table 5. Periods and participating mass ratios of uncoupled and coupled modes of the nonlinear building model.
| UncoupledMode | Period (sec) | UX | UY | RZ | CoupledMode | Period (sec) | UX | UY | RZ |
| 1 | 2.233 | 0.030 | 0.753 | 0.002 | 1 | 2.478 | 0.062 | 0.441 | 0.309 |
| 2 | 2.109 | 0.006 | 0.000 | 0.786 | 2 | 2.132 | 0.461 | 0.238 | 0.086 |
| 3 | 1.998 | 0.745 | 0.030 | 0.002 | 3 | 1.782 | 0.261 | 0.108 | 0.385 |
| 4 | 0.726 | 0.002 | 0.082 | 0.024 | 4 | 0.832 | 0.011 | 0.050 | 0.045 |
| 5 | 0.697 | 0.031 | 0.016 | 0.065 | 5 | 0.699 | 0.069 | 0.039 | 0.006 |
| 6 | 0.645 | 0.083 | 0.017 | 0.024 | 6 | 0.562 | 0.035 | 0.025 | 0.065 |
| 7 | 0.404 | 0.001 | 0.017 | 0.023 | 7 | 0.469 | 0.005 | 0.017 | 0.019 |
| 8 | 0.376 | 0.023 | 0.020 | 0.006 | 8 | 0.375 | 0.029 | 0.018 | 0.001 |
| 9 | 0.324 | 0.025 | 0.013 | 0.018 | 9 | 0.312 | 0.004 | 0.010 | 0.008 |
Finally, point hinges of type M3 (pure bending) and P-M2-M3 (biaxial bending with axial force) are inserted at the end-sections of each beam and column/wall of the nonlinear model, respectively, with constitutive laws according to Mander et al.[53] for the unconfined/confined concrete and according to Park and Paulay[54] for the steel reinforcement. The backbone curves of the response of the fiber hinges at the end-sections of the structural elements (determined from the abovementioned constitutive laws) and the Takeda and the Kinematic hysteresis model for the concrete and the steel rebars respectively are embedded in the SAP2000 FEM program used for the nonlinear analysis. Additional information can be found in SAP2000 analysis manual.
It is noted that accidental eccentricity was not considered in nonlinear analysis. As was observed in the extended parametric analysis of regular in elevation, ductile, asymmetric, r/c multi-storey buildings implemented in the doctoral dissertation of the first author[37], the value of the accidental eccentricity proposed by the seismic codes has only a very minor impact on the nonlinear response in the deep nonlinear area (Near Collapse).
3.4 Seismic demand
The inertial characteristics of the nonlinear model of the six-storey building are concentrated at the geometric centre of each i-floor (mi = 450 tn, Jm,i = 60,000 tn·m2). Figure 4 shows the 14 pairs of uncorrelated artificial accelerograms -formed by 11 unit-normalized accelerograms of 25 sec duration- which are used for the nonlinear response history analysis (N-LRHA) of the six-storey building, to provide the seismic demand. The artificial accelerograms were constructed by SeismoArtif[55] aiming to fit as close as possible (±10%) the unit PGA, 5% damped, design elastic acceleration spectrum of EN 1998-1 for soil category D (Figure 5). The significant (strong motion) duration of the accelerograms is about 14-18 sec and the Arias Intensity is 28 m/s on average, characteristics like those of the Hellenic tectonic faults[56]. The characteristics of the 11 unit-normalized artificial accelerograms are shown in Table 6, as reported by SeismoArtif. Next, the two seismic components of each pair are scaled to PGA = 0.4 g during analysis in order the building to attain the Near Collapse state. Additionally, each pair is rotated successively per 15° in order to find the worst seismic load scenario[44] by the 24 analyses obtained for each pair. Also, the four sign (±) combinations of the two seismic components of each pair were examined. The envelope of the response of 14 × 24 × 4 = 1344 N-LRHA is considered as the seismic demand, at every control location, to compare with the response effects of the proposed pushover procedure at the NC state. The average response from the N-LRHA is also recorded.
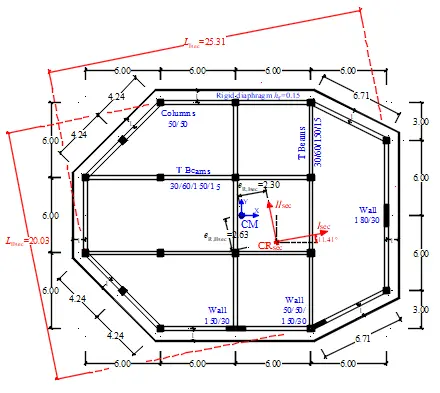
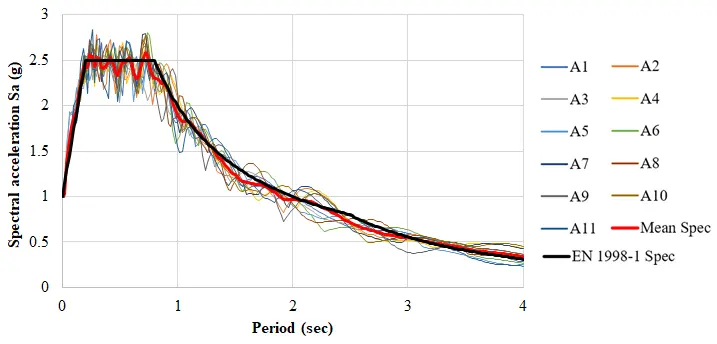
Figure 5. Mean spectrum of artificial accelerograms vs EN 1998-1 design elastic spectrum (ξ = 0.05, PGA = 0.4 g, soil D).
Table 6. Artificial accelerogram characteristics.
| Accelerogram | A1 | A2 | A3 | A4 | A5 | A6 | A7 | A8 | A9 | A10 | A11 |
| Max Acceleration (g) | 0.99 | 1.00 | 1.00 | 1.00 | 1.00 | 0.99 | 1.00 | 1.00 | 1.00 | 1.00 | 1.00 |
| Max Velocity (cm/sec) | 241.85 | 151.42 | 179.28 | 149.63 | 162.71 | 156.34 | 191.53 | 221.30 | 184.26 | 178.82 | 188.13 |
| Max Displacement (cm) | 384.42 | 54.71 | 75.47 | 140.46 | 65.88 | 75.65 | 126.50 | 480.58 | 187.09 | 166.50 | 192.27 |
| Vmax/Amax (sec) | 0.25 | 0.15 | 0.18 | 0.15 | 0.17 | 0.16 | 0.19 | 0.23 | 0.19 | 0.18 | 0.19 |
| Acceleration RMS (g) | 0.27 | 0.26 | 0.27 | 0.26 | 0.28 | 0.27 | 0.28 | 0.27 | 0.25 | 0.27 | 0.25 |
| Velocity RMS (cm/sec) | 77.00 | 40.54 | 40.63 | 48.44 | 38.11 | 42.28 | 47.47 | 87.01 | 58.57 | 54.89 | 50.95 |
| Displacement RMS (cm) | 166.57 | 17.61 | 23.55 | 63.49 | 23.07 | 29.74 | 61.28 | 239.80 | 113.63 | 77.57 | 92.26 |
| Arias Intensity (m/sec) | 29.03 | 26.03 | 28.74 | 26.66 | 29.23 | 28.31 | 29.19 | 27.39 | 24.46 | 28.38 | 24.42 |
| Characteristic Intensity | 0.72 | 0.66 | 0.71 | 0.67 | 0.72 | 0.71 | 0.72 | 0.69 | 0.63 | 0.71 | 0.63 |
| Specific Energy Density (cm2/sec) | 148,285 | 41,107 | 41,277 | 58,686 | 36,315 | 44,707 | 56,346 | 189,336 | 85,781 | 75,357 | 64,929 |
| Cum. Abs. Velocity (cm/sec) | 4,743.6 | 4,405.2 | 4,666.4 | 4,348.7 | 4,642.8 | 4,951. | 4,915.3 | 4,718.9 | 4,501.6 | 4,716.0 | 4,389.4 |
| Acc Spectrum Intensity (g*sec) | 0.96 | 0.95 | 0.95 | 0.94 | 0.95 | 0.96 | 0.95 | 0.96 | 0.96 | 0.96 | 0.95 |
| Vel Spectrum Intensity (cm) | 654.10 | 659.10 | 646.44 | 653.68 | 644.19 | 636.91 | 662.37 | 628.21 | 648.40 | 643.51 | 661.66 |
| Housner Intensity (cm) | 629.25 | 634.98 | 611.72 | 637.95 | 614.88 | 623.84 | 641.22 | 616.83 | 639.60 | 643.14 | 636.73 |
| Sustained Max.Acceleration (g) | 0.93 | 0.95 | 0.99 | 0.98 | 0.97 | 0.92 | 0.98 | 0.92 | 0.99 | 0.93 | 0.96 |
| Sustained Max.Velocity (cm/sec) | 178.42 | 121.72 | 110.04 | 139.51 | 114.05 | 132.98 | 124.22 | 170.09 | 162.42 | 144.99 | 115.79 |
| Effective Design Acceleration (g) | 0.93 | 0.95 | 1.02 | 0.99 | 1.03 | 0.99 | 1.01 | 0.94 | 1.02 | 0.97 | 1.00 |
| A95 parameter (g) | 0.95 | 0.99 | 0.98 | 0.98 | 0.98 | 0.98 | 0.98 | 0.98 | 0.99 | 0.99 | 0.99 |
| Predominant Period (sec) | 0.56 | 0.30 | 0.24 | 0.30 | 0.58 | 0.74 | 0.72 | 0.24 | 0.72 | 0.72 | 0.26 |
| Significant Duration (sec) | 14.93 | 14.14 | 14.93 | 14.17 | 14.11 | 18.05 | 17.30 | 17.28 | 17.24 | 16.15 | 14.64 |
3.5 Proposed interstorey drift ratios and floor enforced-rotations
For the implementation of the proposed procedure of pushover analysis, the initially proposed interstorey drift ratios γI,i,II at the in-plan location of the vertical axis IIIsec are obtained from Figure 1 for dual buildings along both the axes Isec and IIsec. Also, the proposed floor enforced-rotations ψR,III,i are obtained from Figure 2 for dual torsional flexible buildings along both the axes Isec and IIsec. These proposed values of enforced-displacements are presented in Figure 6. The initial values of the proposed interstorey drift ratios will be reviewed through the methodology described in the next step.
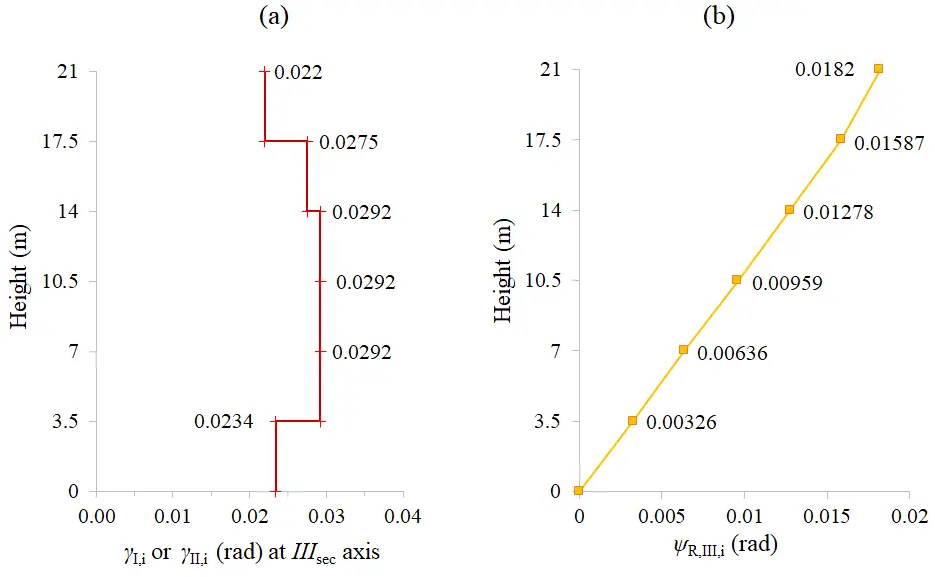
Figure 6. Proposed values of (a) Interstorey drift ratios γI;II (rad); (b) Floor enforced-rotationsψR,III (rad).
3.6 Two temporary sets of pushover analysis to calculate the final proposed floor enforced translations
Two temporary sets of pushover analysis (with forces) are performed to find revised values of interstorey drift ratios rI,i, rII,i. The pattern of floor lateral forces in the two sets, which are applied at the in-plan location of the vertical axis IIIsec along the (±) directions of the horizontal Isec and IIsec axes, is depicted in Figure 7.
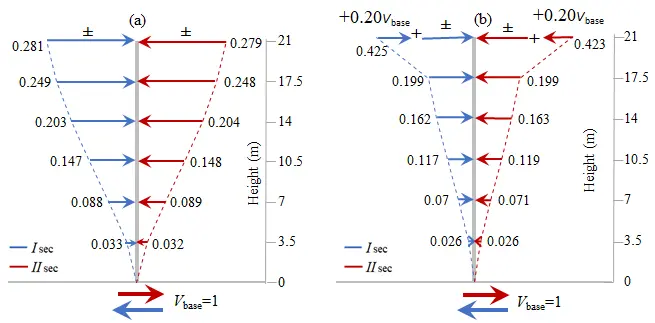
Figure 7. Pattern of floor lateral static loads on the in-plan location of the vertical IIIsec axis and along the horizontal Isec and IIsec axes. (a) First temporary set of (4) pushover analyses; (b) Second temporary set of (4) pushover analyses.
These floor forces correspond to a unit base shear that is distributed in elevation according to the translational building modes along the Isec and IIsec axes in both sets but with an additional top force in the second set equal to 20% of the base shear. The target displacement at the top of the vertical axis IIIsec, along both the Isec and IIsec axes, is calculated directly from Table 1 by double linear interpolation for multi-storey buildings with six floors and with a dual structural system:
It is noted that the envelope of the displacement results from N-LRHA provides a displacement at the top of the vertical axis IIIsec equal to 0.574 m along both the Isec and IIsec axes, which is greater from the previous one (the mean displacements from N-LRHA at the same point are about 0.40 m along both the horizontal principal directions). Additionally, by performing the methodology of EN 1998-1 Informational Annex B with the NC seismic action of PGA = 0.4 g we get 0.54 m and 0.60 m for the corresponding displacements along the Isec and IIsec axes.
The envelope of the interstorey drift ratios rI,i, rII,i resulted from the eight total pushovers of the two temporary sets is shown in the 2nd and 3rd column of Table 7. Τhe average of these values with the corresponding ones initially proposed by Figure 1 (depicted in Figure 6 and shown in the 4th column of Table 7) are considered as the final interstorey drift ratios (5th and 6th column of Table 7) for the calculation of the floor enforced translational displacements ψI,i, ψII,i using Eq. 3. The three enforced displacements of the proposed pushover procedure, which act at the location of the vertical IIIsec axis inside each floor-diaphragm, are shown at the last three columns of Table 7.
Table 7. Calculation of the final floor enforced-displacements.
| Interstorey drift ratiosγI,i and γII,i (rad) | ||||||||
| Temp. Pushovers ENV | Prop. Values, Figure 6 | Final proposed values | Floor enforced displacements | |||||
| Dir Isec | Dir IIsec | Dir Isec, IIsec | Dir Isec | Dir IIsec | ψI,i (m) | ψII,i (m) | ψR,III,i (rad) | |
| 1st | 0.0240 | 0.0209 | 0.0234 | 0.0237 | 0.0222 | 0.083 | 0.078 | 0.0033 |
| 2nd | 0.0328 | 0.0327 | 0.0292 | 0.0310 | 0.0309 | 0.191 | 0.186 | 0.0064 |
| 3rd | 0.0322 | 0.0339 | 0.0292 | 0.0307 | 0.0315 | 0.299 | 0.296 | 0.0096 |
| 4th | 0.0283 | 0.0293 | 0.0292 | 0.0287 | 0.0292 | 0.399 | 0.398 | 0.0128 |
| 5th | 0.0233 | 0.0229 | 0.0275 | 0.0254 | 0.0252 | 0.488 | 0.487 | 0.0159 |
| 6th | 0.0169 | 0.0162 | 0.0220 | 0.0194 | 0.0191 | 0.556 | 0.553 | 0.0182 |
3.7 Proposed pushover procedure for the estimation of the seismic demand. Verification
The sixteen pushovers of Table 2 and Table 3 are performed with target displacement along the main loading directions Isec and IIsec equal to ψI,6 = 0.556 m and ψII,6 = 0.556 m (Table 7). The envelope of the response from the 16 pushover analyses of the proposed pushover procedure can be considered as an estimation of the seismic demand.
The effectiveness of the proposed pushover procedure on the prediction of seismic demand will be verified against the results of N-LRHA, which is the benchmark method. Additionally, the response effects by the proposed pushover procedure compare with those resulted by the N2[3,57] and Extended N2 pushover procedures[19]. In the latter procedure, the response effects resulted by the conventional N2 pushover adopted by EN 1998-1 are corrected, in-plan and in elevation, using corrections factors determined from the results of a 3D modal response spectrum analysis. It is noted that, in the framework of the N2 pushover the lateral forces are applied on the location of CM inside each floor (without accidental eccentricity) along the horizontal ideal principal axes Isec and IIsec of the six-storey building. The target displacement (at CM of the top floor) was considered equal to that resulted from N-LRHA.
The patterns of interstorey drift ratios in elevation, at the flexible and stiff sides of the building as well as at the location of CM and that of the vertical IIIsec axis (CRsec) inside each floor, are presented in Figure 8. The (%) errors committed on the estimation of the seismic demand (N-LRHA) by the proposed and the Extended N2 pushovers are recorded in Table 8, where the (–) sign indicates unconservative estimates. It is obvious from Figure 8 that the N2 pushover procedure seriously underestimates the interstorey drift ratios at the stiff sides of the building, all over its height. It also underestimates the interstorey drift ratios at any location in the upper half of the building.
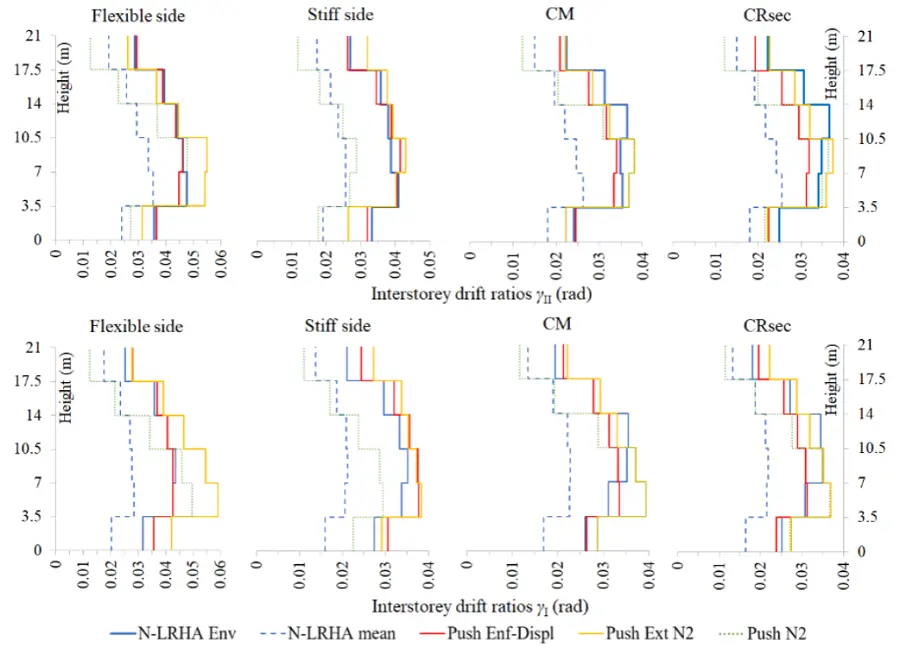
Figure 8. Interstorey drift ratios. Proposed pushover procedure vs. Ν-LRHA and Extended N2 pushover.
Table 8. Errors (%) on the estimation of the seismic interstorey drift ratios.
| Pushover with Enforced Displacements | Pushover Extended N2 | |||||||||
| Direction IIsec | Floor | CM | CR | Stiff Side | Flex Side | CM | CR | Stiff Side | Flex Side | |
| 1 | 2 | -10 | -3 | 3 | -7 | -11 | -20 | -12 | ||
| 2 | -6 | -8 | -1 | -6 | 4 | 6 | -2 | 14 | ||
| 3 | -2 | -8 | 7 | 0 | 9 | 8 | 11 | 19 | ||
| 4 | -13 | -19 | 2 | -2 | -11 | -12 | 3 | 1 | ||
| 5 | -12 | -17 | -3 | -1 | -9 | -7 | 6 | -7 | ||
| 6 | -7 | -13 | -2 | 2 | -2 | 2 | 19 | -9 | ||
| Direction Isec | Floor | CM | CR | Stiff Side | Flex Side | CM | CR | Stiff Side | Flex Side | |
| 1 | 1 | -5 | 12 | 13 | 10 | 9 | 6 | 33 | ||
| 2 | 8 | 1 | 12 | 0 | 26 | 20 | 13 | 39 | ||
| 3 | -5 | -12 | 7 | -2 | 6 | 1 | 6 | 25 | ||
| 4 | -12 | -16 | 7 | 0 | -7 | -8 | 6 | 14 | ||
| 5 | 0 | -6 | 8 | 2 | 5 | 6 | 14 | 8 | ||
| 6 | 10 | 8 | 16 | 11 | 14 | 22 | 30 | 10 | ||
On the contrary, N2 pushover overestimates in general the interstorey drift ratios at any location (except the stiff sides) in the lower half of the building (2nd and 3rd floor). We can also see from Figure 8 and Table 8 that the seismic interstorey drift ratios at the flexible and stiff sides of the six-storey building are safely or marginally estimated by the proposed pushover procedure. These estimates are more balanced than those of the Extended N2 pushover, which provides in general more conservative estimates but also some unconservative ones along the IIsec axis at the first floor. At the in-plan location of CRsec, the seismic interstorey drift ratios are in general slightly underestimated by the proposed procedure due to the smaller value of the target (enforced) displacements used in pushover analysis compared to the corresponding N-LRHA displacements. But at the in-plan location of CM the interstorey drift ratios are in general marginally estimated.
According to Section 2, the floor displacements computed by the proposed pushover procedure must be totally reduced by the factor Su of Eq. 4:
Where rt,top · Hn =0.515 m is the proposed top target displacement of the temporary pushovers from Table 1 previously calculated and ψI;II,6 = 0.556 or 0.553 m is the enforced translational displacement of the building top (Table 7). In Figure 9, the floor displacements profiles resulted by the proposed pushover procedure compare with the corresponding ones by N-LRHA and Extended N2 pushover.
Figure 9. Floor displacement profiles. Proposed pushover procedure vs. Ν-LRHA and extended N2 pushover.
The (%) errors committed on the estimation of the seismic demand are recorded in Table 9. We observe that, at the in-plan location of the vertical IIIsec axis (CRsec) the floor displacements are slightly underestimated by the proposed procedure. This is due to the smaller value of the target (enforced) displacements used in pushover analysis compared to the corresponding N-LRHA displacements and due to the above reduction by the factor Su. But at the in-plan location of CM, the floor displacements are in general marginally estimated. Slightly conservative or marginal estimates of the floor displacements from the proposed pushover procedure are observed on the stiff and flexible sides of the six-storey building. The Extended N2 pushover provides in general more conservative estimates of the floor displacements on the flexible sides of the building but also some unconservative ones on the stiff side of the first floor of the building along the IIsec axis.
Table 9. Errors (%) on the estimation of the seismic floor displacements.
| Pushover with Enforced Displacements | Pushover Extended N2 | |||||||||
| Direction IIsec | Floor | CM | CR | Stiff Side | Flex Side | CM | CR | Stiff Side | Flex Side | |
| 1 | -5 | -16 | -10 | -5 | -7 | -11 | -20 | -12 | ||
| 2 | -9 | -15 | -9 | -6 | 0 | -1 | -10 | 6 | ||
| 3 | -8 | -12 | -5 | -3 | 5 | 5 | -1 | 15 | ||
| 4 | -4 | -8 | 2 | 4 | 7 | 8 | 6 | 20 | ||
| 5 | -1 | -9 | 7 | 10 | 5 | 2 | 7 | 18 | ||
| 6 | 0 | -9 | 9 | 12 | 0 | -3 | 5 | 12 | ||
| Direction IIsec | Floor | CM | CR | Stiff Side | Flex Side | CM | CR | Stiff Side | Flex Side | |
| 1 | -6 | -12 | 4 | 5 | 10 | 9 | 6 | 33 | ||
| 2 | -2 | -7 | 4 | -1 | 19 | 17 | 11 | 37 | ||
| 3 | 3 | -7 | 7 | 5 | 25 | 16 | 14 | 45 | ||
| 4 | -3 | -11 | 6 | 9 | 12 | 6 | 9 | 43 | ||
| 5 | -4 | -11 | 8 | 16 | 4 | -1 | 6 | 40 | ||
| 6 | -2 | -9 | 12 | 18 | 0 | -4 | 5 | 33 | ||
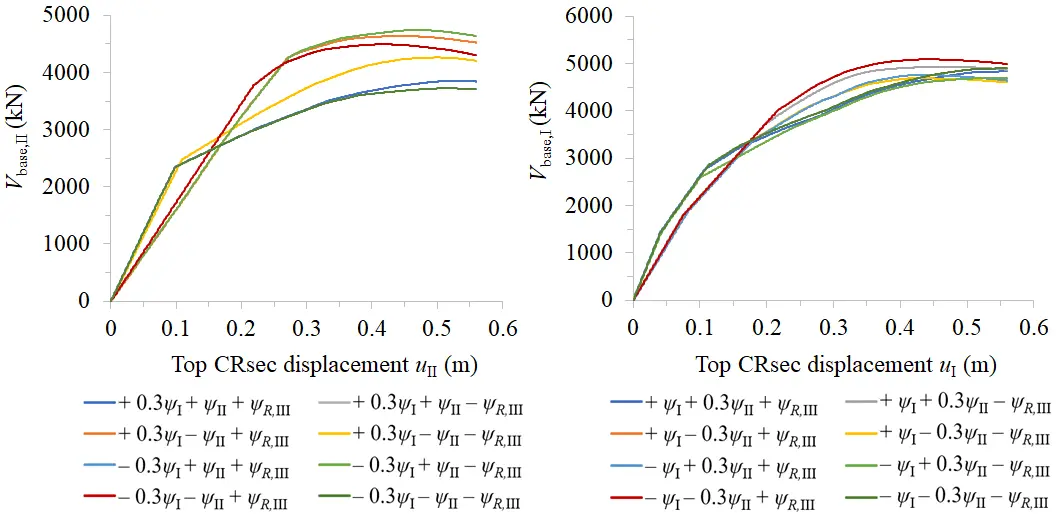
The capacity curves of the sixteen pushovers with enforced-displacements are shown in Figure 10. The slope of the initial (elastic) branch and the ultimate and yield values of the base shear and top displacement of the building are different in each curve, depending mainly on the (±) action of the floor enforced-rotations. These curves are first bi-linearized and then can be used to connect the seismic capacity (pushover results) with the seismic demand (earthquake action) by using the informational Annex B of EN 1998-1 or any other acceptable method. By knowing the pattern of floor enforced translational displacements ψI;II in elevation and the corresponding target displacement on the building top, the backwards application of EN1998-1 Annex B gives the maximum (capable) earthquake in PGA terms that the building can attain (NC state). In our case, this PGA is equal to about 0.40 g, which is the same value used in N-LRHA.
Finally, the plastic mechanism of the six-storey building (which is of beam-type) is safely predicted by the envelope of the sixteen pushovers of the proposed procedure. As regards the plastic chord rotations developed at the end-sections of the structural elements, they are fully compatible with the computed interstorey drift ratios which have been in general safely estimated.
4. Conclusions
An asymmetric, torsional flexible, regular in elevation, ductile, six-storey r/c building was seismically accessed here by a recently proposed pushover procedure with floor enforced-displacements to verify its effectiveness.
According to the proposed pushover procedure, a pattern of seismic floor-enforced displacements (two translational displacements and a rotational one) properly combined with each other to consider the spatial seismic action is applied and a set of sixteen pushovers is performed. The envelope of the sixteen pushovers provides a safe estimate of the seismic demand at the NC state of the building. Appropriate seismic, drift-based, floor enforced-displacements are proposed that lead the building at the attainment of the NC state. The proposed values of the floor translational displacements are further revised through two temporary sets of pushovers. All analyses in the framework of the proposed pushover procedure are implemented with respect to an ideal, inelastic, 3D principal reference system CRsec (Isec, IIsec, IIIsec), which is called “Capable Near Collapse Principal System of the multi-storey r/c building”. This system is determined by applying the torsional optimum axis methodology to the nonlinear model of the building in which all structural members have been supplied with the secant stiffness at yield EIsec. Additionally, a new criterion is used for the verification of the torsional sensitivity of the building in the non-linear area.
To verify the effectiveness of the proposed procedure on the prediction of the seismic demand, nonlinear response history analysis (N-LRHA) with 14 pairs of artificial accelerograms has been performed to provide the seismic demand at the attainment of the NC state of the six-storey r/c building. From the comparison of the response computed by the proposed pushover procedure and by the (envelope of) N-LRHA, the main conclusions are:
The seismic interstorey drift-ratios on the stiff and flexible sides of the building are safely estimated by the proposed procedure. In other locations, such as those of CM and CRsec, the interstorey drift ratios are marginally estimated or slightly underestimated. Hence, the main objective of the proposed procedure, which is the complete control of the distribution -in plan and in elevation- of the seismic structural damage at the NC state, is fully achieved.
The seismic floor displacement profiles on the stiff and flexible sides of the building are safely estimated by the proposed procedure. In other locations, such as those of CM and CRsec, the floor displacements are marginally estimated or slightly underestimated.
The plastic chord rotations at the end-sections of the structural members are also safely estimated in general by the proposed procedure, following the safe estimation of the seismic interstorey drift ratios.
The plastic mechanism of the building at the NC state is fully captured by the envelope of the sixteen pushover analyses in the framework of the proposed procedure.
Therefore, the proposed enforced-displacement pushover procedure is a simple and effective tool for the seismic assessment of asymmetric, torsional flexible, regular in elevation, ductile multistorey r/c buildings. The effectiveness of the proposed pushover procedure with enforced displacements has been fully evaluated in the first author’s doctoral dissertation[37] by examining various regular in elevation, ductile, multistorey r/c buildings with varying number of floors, structural type, static eccentricity and torsional sensitivity. In other words, the proposed procedure can be successfully used to seismically assess any type of asymmetric multistory r/c building, torsional flexible or not, provided that are regular in elevation and develop a beam-type plastic mechanism (and not a floor-type one).
Supplementary materials
The supplementary material for this article is available at: Supplementary materials.
Authors contribution
All authors contributed equally to this work.
Conflicts of interest
The authors declare no conflicts of interest.
Ethical approval
Not applicable.
Consent to participate
Not applicable.
Consent for publication
Not applicable.
Availability of data and materials
Not applicable.
Funding
None.
Copyright
© The Author(s) 2023.
References
-
1. Gupta A, Krawinkler H. Seismic demands for performance evaluation of steel moment resisting frame structures. John A Blume Earthquake Engineering Center Technical Report 132; 199.
-
2. Goel RK. Evaluation of nonlinear static procedures using building strong motion records. In: Wallace JW, editor. Structural Engineering Research Frontiers. Reston: American Society of Civil Engineers; 2012. p. 1-12.[DOI]
-
3. Eurocode 8: Design of structures for earthquake resistance-Part 1: General rules, seismic actions and rules for buildings; 2004. Available from: https://www.confinedmasonry.org/wp-content/uploads/2009/09/Eurocode-8-1-Earthquakes-general.pdf
-
4. Bakalis A, Makarios T. Dynamic eccentricities in pushover analysis of asymmetric single-storey buildings. In: Köber D, De Stefano M, Zembaty Z, editors. Seismic Behaviour and Design of Irregular and Complex Civil Structures III. Cham: Springer; 2020. p. 307-320.[DOI]
-
5. Bakalis AP, Makarios ΤK. Dynamic eccentricities and the “capable near collapse centre of stiffness” of reinforced concrete single-storey buildings in pushover analysis. Eng Struct. 2018;166:62-78.[DOI]
-
6. Bakalis AP, Makarios ΤK. Seismic assessment of asymmetric single-story RC buildings by modified pushover analysis using the “Capable Near Collapse Centre of Stiffness”: Validation of the method. J Earthq Eng. 2022;26(2):980-1009.[DOI]
-
7. Bakalis AP, Makarios ΤK . Seismic enforced-displacement pushover procedure on multistorey R/C buildings. Eng Struct. 2021;229:111631[DOI]
-
8. Makarios T, Bakalis AP. Pushover analysis using suitable dynamic eccentricities on asymmetric single-storey buildings. Engineering. 2018. Available from: https://www.semanticscholar.org/paper/PUSHOVER-ANALYSIS-USING-SUITABLE-DYNAMIC-ON-Makarios-Bakalis/04f7eacadaeb8d8bd776f3366e3b807b267d5b63
-
9. Makarios T, Bakalis A. Seismic enforced displacement-based pushover analysis on irregular in-plan R/C multi-storey buildings. In: Bento R, De Stefano M, Köber D, Zembaty Z, editors. Seismic Behaviour and Design of Irregular and Complex Civil Structures IV. Cham: Springer; 2022. p. 37-47.[DOI]
-
10. Bakalis A, Makarios T, Athanatopoulou A. Inelastic dynamic eccentricities in pushover analysis procedure of multi-story RC buildings. Buildings. 2021;11(5):195.[DOI]
-
11. Chopra AK, Goel RK. A modal pushover analysis procedure to estimate seismic demands for unsymmetric-plan buildings. Earthq Eng Struct Dyn. 2004;33(8):903-927.[DOI]
-
12. Reyes JC, Chopra AK. Three-dimensional modal pushover analysis of buildings subjected to two components of ground motion, including its evaluation for tall buildings. Earthq Eng Struct Dyn. 2011;40:789-806.[DOI]
-
13. Hernandez-Montes E, Kwon OS, Aschheim MA. An energy-based formulation for first and multiple-mode nonlinear static (pushover) analyses. J Earthq Eng. 2004;8(1):69-88.[DOI]
-
14. Lin JL, Tsai KC. Seismic analysis of two-way asymmetric building systems under bi-directional seismic ground motions. Earthq Eng Struct Dyn. 2008;37(2):305-328.[DOI]
-
15. Manoukas G, Athanatopoulou A, Avramidis I. Multimode pushover analysis for asymmetric buildings under biaxial seismic excitation based on a new concept of the equivalent single degree of freedom system. Soil Dyn Earthq Eng. 2012;38:88-96.[DOI]
-
16. Fujii K. Prediction of the largest peak nonlinear seismic response of asymmetric buildings under bi-directional excitation using pushover analyses. Bull Earthq Eng. 2014;12:909-938.[DOI]
-
17. Soleimani S, Aziminejad A, Moghadam AS. Extending the concept of energy-based pushover analysis to assess seismic demands of asymmetric-plan buildings. Soil Dyn Earthq Eng. 2017;93:29-41.[DOI]
-
18. Fajfar P, Marusic D, Perus I. Torsional effects in the pushover-based seismic analysis of buildings. J Earthq Eng. 2005;9(6):831-854.[DOI]
-
19. Kreslin M, Fajfar P. The extended N2 method considering higher mode effects in both plan and elevation. Bull Earthq Eng. 2012;10:695-715.[DOI]
-
20. Bhatt C, Bento R. Extension of the CSM-FEMA440 to plan-asymmetric real building structures. Earthq Eng Struct Dyn. 2011;40(11):1263-1282.[DOI]
-
21. Rofooei FR, Mirjalili MR. Dynamic-based pushover analysis for one-way plan-asymmetric buildings. Eng Struct. 2018;163:332-346.[DOI]
-
22. Bosco M, Ghersi A, Marino EM. Corrective eccentricities for assessment by the nonlinear static method of 3D structures subjected to bidirectional ground motions. Earthq Eng Struct Dyn. 2012;41(13):1751-1773.[DOI]
-
23. Bosco M, Ghersi A, Marino EM, Rossi PP. Generalized corrective eccentricities for nonlinear static analysis of buildings with framed or braced structure. Bull Earthq Eng. 2017;15:4887-4913.[DOI]
-
24. Antoniou S, Pinho R. Advantages and limitations of adaptive and non-adaptive force-based pushover procedures. J Earthq Eng. 2004;8(4):497-522.[DOI]
-
25. Antoniou S, Pinho R. Development and verification of a displacement-based adaptive pushover procedure. J Earthq Eng. 2004;8(5):643-661.[DOI]
-
26. Kalkan E, Kunnath SK. Adaptive modal combination procedure for nonlinear static analysis of building structures. J Struct Eng. 2006;132(11):1721-1731.[DOI]
-
27. Bhatt C, Bento R. The extended adaptive capacity spectrum method for the seismic assessment of plan-asymmetric buildings. Earthq Spectra. 2014;30(2):683-703.[DOI]
-
28. Amini MA, Poursha M. Adaptive force-based multimode pushover analysis for seismic evaluation of midrise buildings. J Struct Eng. 2018;144(8):04018093.[DOI]
-
29. Poursha M, Khoshnoudian F, Moghadam AS. The extended consecutive modal pushover procedure for estimating the seismic demands of two-way unsymmetric-plan tall buildings under influence of two horizontal components of ground motions. Soil Dyn Earthq Eng. 2014;63:162-173.[DOI]
-
30. Goel RK, Chopra AK. Evaluation of modal and FEMA pushover analyses: SAC buildings. Earthq Spectra. 2004;20(1):225-254.[DOI]
-
31. Erduran E. Assessment of current nonlinear static procedures on the estimation of torsional effects in low-rise frame buildings. Eng Struct. 2008;30(9):2548-2558.[DOI]
-
32. Baros DK, Anagnostopoulos SA. An overview of pushover procedures for the analysis of buildings susceptible to torsional behavior. In: The 14th World Conference on Earthquake Engineering; 2008 Oct 12-17; Beijing, China. Available from: http://www.iitk.ac.in/nicee/wcee/article/14_05-01-0195.PDF
-
33. Bento R, Bhatt C, Pinho R. Using nonlinear static procedures for seismic assessment of the 3D irregular SPEAR building. Earthq Struct. 2010;1(2):177-195.[DOI]
-
34. Bhatt C, Bento R. Comparison of nonlinear static methods for the seismic assessment of plan irregular frame buildings with non seismic details. J Earthq Eng. 2012;16(1):15-39.[DOI]
-
35. De Stefano M, Mariani V. Pushover analysis for plan irregular building structures. In: Ansal A, editor. Perspectives on European Earthquake Engineering and Seismology. Cham: Springer; 2014. p. 429-448.[DOI]
-
36. Anagnostopoulos SA, Kyrkos MT, Stathopoulos KG. Earthquake induced torsion in buildings: Critical review and state of the art. Earthq Struct. 2015;8(2):305-377.[DOI]
-
37. Bakalis A. Seismic non-linear static analysis of asymmetric reinforced concrete buildings at capable near collapse state using imposed floor displacements or inelastic dynamic eccentricities [dissertation]. Greece: University of Thessaloniki; 2021.
-
38. Eurocode 8: Design of structures for earthquake resistance-part 3: Assessment and retrofitting of buildings. European Committee for Standardization; 2005.
-
39. Makarios T, Anastassiadis K. Real and fictitious elastic axis of multi-storey buildings: Theory. Struct Des Tall Build. 1998;7(1):33-55.[DOI]
-
40. Makarios T, Anastassiadis K. Real and fictitious elastic axis of multi-storey buildings: Applications. Struct Des Tall Build. 1998;7(1):57-71.[DOI]
-
41. Makarios TK. Optimum torsion axis to multistory buildings by using the continuous model of the structure. J Struct Des Tall Spec Build. 2005;14(1):69-90.[DOI]
-
42. Makarios T. Practical calculation of the torsional stiffness radius of multistorey tall buildings. J Struct Des Tall Spec Build. 2008;17(1):39-65.[DOI]
-
43. Makarios T, Athanatopoulou AM, Xenidis H. Numerical verification of properties of the fictitious elastic axis in asymmetric multistorey buildings. J Struc Des Tall Spec Build. 2006;15(3):249-276,[DOI]
-
44. Athanatopoulou A, Doudoumis I. Principal directions under lateral loading in multistory asymmetric buildings. Struct Des Tall Spec Build. 2008;17(4):773-794.[DOI]
-
45. Marino EM, Rossi PP. Exact evaluation of the location of the optimum torsion axis. Struct Des Tall Spec Build. 2004;13(4):277-290.[DOI]
-
46. Georgoussis G. Modal eccentricities of asymmetric structures. Struct Des Tall Spec Build. 2006;15(3):339-361.[DOI]
-
47. Georgoussis G. An alternative approach for assessing eccentricities in asymmetric multistory buildings.1. Elastic systems. Struct Des Tall Spec Build. 2009;18(2):181-202.[DOI]
-
48. Georgoussis GK. Modal rigidity center: It’s use for assessing elastic torsion in asymmetric buildings. Earthq Struct J. 2010;1(2):163-175.[DOI]
-
49. Bosco M, Marino EM, Rossi PP. An analytical method for the evaluation of the in plan irregularity of non-regularity asymmetric buildings. Bull Earthq Eng. 2013;11(5):1423-1445.[DOI]
-
50. Hejal R, Chopra, AK. Earthquake response of torsionally-coupled buildings. Earthquake Eng Res Cent. 1989;18(3):305-323.[DOI]
-
51. Wilson EL. Eurocode 2. Design of concrete structures-Part 1-1: General rules and rules for buildings (2008).
-
52. Three dimensional static and dynamic finite element analysis and design of structures. Computers and Structures Inc; 2022. Available from: http://civilwares.free.fr/ForLinh/3D%20Static%20And%20Dynamic%20Analysis%20Of%20Structures%20-%20E%20Wilson.pdf
-
53. Mander JB, Priestley MJN, Park R. Theoretical stress-strain model for confined concrete. J Struct Eng. 1988;114(8):1827-1849.[DOI]
-
54. Park R, Paulay T. Reinforced concrete structures. New York: John Wiley & Sons, Inc; 1975.
-
55. Seismosoft-SeismoArtif. A Computer program for generating artificial earthquake accelerograms matched to a specific target response spectrum; 2016.
-
56. Makarios T. Design characteristic value of the Arias intensity magnitude for artificial accelerograms compatible with Hellenic seismic hazard zones. Int J Innov Res Adv Eng. 2015;2:87-98. Available from: https://www.semanticscholar.org/paper/Design-Characteristic-value-of-the-Arias-intensity-Makarios/a42903a9e76fe4708b3a3768dd04ece16410366a
-
57. Fajfar P. A nonlinear analysis method for performance-based seismic design. Earthq Spectra. 2000;16(3):573-592.[DOI]
Copyright
© The Author(s) 2023. This is an Open Access article licensed under a Creative Commons Attribution 4.0 International License (https://creativecommons.org/licenses/by/4.0/), which permits unrestricted use, sharing, adaptation, distribution and reproduction in any medium or format, for any purpose, even commercially, as long as you give appropriate credit to the original author(s) and the source, provide a link to the Creative Commons license, and indicate if changes were made.
Publisher’s Note
Science Exploration remains a neutral stance on jurisdictional claims in published
maps
and institutional affiliations. The views expressed in this article are solely those
of
the author(s) and do not reflect the opinions of the Editors or the publisher.
Share And Cite


Science Exploration Style
Bakalis AP, Makarios TK. Verification of seismic enforced-displacement pushover procedure on torsionally flexible, asymmetric, multi-storey r/c buildings. J Build Des Environ. 2023;1:8290. https://doi.org/10.37155/2811-0730-0201-2
Tips
Copy completed.
Submit a Manuscript
Author Instructions
Cite this Article
Article Metrics
0
View
0
Download
Cited
Article Updates

- Abstract
- Keywords
- 1. Introduction
- 2. Application Steps of the Enforced-Displacement Pushover Procedure
- 3. Numerical Example of a 6-storey Dual Building
- 4. Conclusions
- Supplementary materials
- Authors contribution
- Conflicts of interest
- Ethical approval
- Consent to participate
- Consent for publication
- Availability of data and materials
- Funding
- References
- Copyright
Science Exploration Style
Bakalis AP, Makarios TK. Verification of seismic enforced-displacement pushover procedure on torsionally flexible, asymmetric, multi-storey r/c buildings. J Build Des Environ. 2023;1:8290. https://doi.org/10.37155/2811-0730-0201-2
copy
Share Link
copy