Association of lipoprotein(a), oxidized phospholipids and apolipoprotein B100 in acute ischemic stroke cohort
*Correspondence to:
Gissette Reyes-Soffer, MD. Department of Medicine, Division of Preventive Medicine and Nutrition, Columbia University Vagelos College of Physicians and Surgeons, 630 West 168th Street, P & S 8-503, New York, NY 10032, USA.
E-mail: Gr2104@cumc.columbia.edu
Adv Lipoprotein(a) Res. 2026;1:202508. 10.70401/alr.2026.0005
Received: October 15, 2025Accepted: January 13, 2026Published: January 14, 2026
This manuscript is made available in its unedited form to allow early access to the reported findings. Further editing will be completed before final publication. As such, the content may include errors, and standard legal disclaimers are applicable.
Abstract
Aims: Atherosclerosis, affecting the aorta, cervical, or intracranial arteries, is a common cause of stroke. Previous studies have shown a strong link between high Lp(a) levels and atherosclerotic stroke due to intracranial atherosclerotic disease, implicating Lp(a) in disease development and progression. The precise role of Lp(a) in stroke subtypes remains unclear, although smaller isoform sizes and oxidized phospholipids on Lp(a) are associated with the disease presence. To clarify Lp(a)’s connection with ischemic stroke subtypes, we evaluated various plasma biomarkers previously linked to Lp(a) and disease.
Methods: We used stored plasma samples and data from 244 participants enrolled in an acute ischemic stroke registry at Columbia University Medical Center in New York. Plasma Lp(a) concentrations, apolipoprotein B100 (APOB), and oxidized phospholipids were measured via enzyme-linked immunosorbent assay. APO(a) isoform size was measured via gel electrophoresis. Stroke subtypes were classified based on etiologies using clinical and imaging data. Adjusted multivariate logistic regression models were built to assess associations between Lp(a)-related biomarkers and stroke subtype.
Results: In participants with acute ischemic stroke, high Lp(a) concentrations, percentage of APOB in Lp(a), and OxPL-APO(a) concentrations were significantly associated with the presence of atherosclerotic stroke compared to those with non-atherosclerotic strokes [OR = 1.30
Conclusion: In addition to Lp(a) concentrations, the percentage of APOB in Lp(a), and OxPL-APO(a) concentrations are positively associated with acute atherosclerotic ischemic stroke, specifically ECAD.
Keywords
Lp(a), acute ischemic stroke, oxidized phospholipids
1. Introduction
Stroke is one of the leading causes of death and long-term disability[1]. Although there were some confounding studies showing no associations between stroke and high Lipoprotein(a) [Lp(a)] Lp(a) levels[2,3], recent literature strongly supports the role of high Lp(a) in ischemic stroke[4-9]. Lp(a) concentrations tend to be higher in participants who have experienced a stroke compared to healthy,
Lp(a) is an apolipoprotein B100 (APOB) containing lipoprotein. Unlike other APOB-containing lipoproteins, analysis of its protein components links it to pathways of atherosclerosis but also coagulation and inflammation[21]. Apolipoprotein(a) [APO(a)], the other major protein component of Lp(a), contains a multi-kringle (K) glycoprotein with varying molecular weight (200-800 kD). This large size polymorphism is determined by the Kringle IV type 2(KIV-2) repeats number in the LPA gene. Typically, individuals express two APO(a) isoforms. Small size APO(a) isoforms are associated with high plasma concentrations and vice versa[21]. Circulating Lp(a) particle concentrations are highly heterogeneous, widely right-skewed, and contain interindividual and interethnic variation, which is most likely due to LPA gene variability and APO(a) isoform size[22-24]. Strong evidence suggests that small isoform sized APO(a) is linked to increases in cardiovascular disease[25-27]. There is strong support for the association of smaller APO(a) isoforms with increased risk for coronary heart disease and ischemic stroke[7,28,29]. Additionally, studies have shown that Lp(a)’s correlation with increased atherogenicity and inflammation is mediated via oxidized phospholipid (OxPL)[30,31]. OxPL can be measured on APOB lipoproteins (OxPL-APOB) and on APO(a) [OxPL-APO(a)] using the E06 murine monoclonal antibody, which recognizes the phosphocholine head group of OxPL. Studies have implied that elevated OxPL-APOB levels are predictors of the diagnosis or prognosis of CVD, and it has been postulated that Lp(a) particles are the main carrier of OxPL when compared to LDL-APOB[31-34]. Although there exist parallels between coronary atherosclerosis and atherosclerosis elsewhere, the role of Lp(a) and related profiles is less clear in stroke populations. Therefore, we wanted to explore Lp(a) levels plus additional biomarkers and their relationships to subtypes of AIS groups. Thus, we provide novel data on the associations of Lp(a), APO(a) isoform size, APOB, and oxidized phospholipids in AIS; these measurements are not part of routine clinical care.
2. Methods
2.1 Study design and population
We performed a retrospective cross-sectional study. We used existing data and stored human blood samples to measure biomarker levels from the ongoing New York Presbyterian Hospital/Columbia University Irving Medical Center Stroke Registry Study (NYP/CUIMC-SRS)[35]. Research participants were enrolled when admitted to NYP/CUIMC with a clinical suspicion of stroke or transient ischemic attack. The primary goals of the registry are to assess the prevalence of vascular risk factors, the incidence of vascular outcomes, and to identify prevention strategies for stroke.
All acute ischemic stroke cases had their diagnosis of AIS confirmed by computed tomography and/or magnetic resonance imaging and were assessed by a qualified vascular neurologist. Additionally, only participants whose plasma samples were available, safely stored (stored in -80 °C freezer, never thawed, and stored for less than 5 years), and who had provided consent for future research were included. All baseline characteristics were collected upon study enrollment, including plasma lipids. The complete protocol was approved by the Columbia University Medical Center Institutional Review Board (IRB AAAS5563). Following these criteria only 3 individuals were excluded.
2.2 Baseline characteristics
Participants’ research registry records were reviewed to extract demographic variables: vital signs, vascular risk factors, comorbidities, pre-treatment NIH stroke scale, stroke etiology, age, sex, and self-reported ethnicity. The population’s ethnicity was categorized into Hispanics, Non-Hispanic Whites, Non-Hispanic Blacks, and others. Self-reported medical history included hypertension, diabetes, and hypercholesterolemia. Medication usage and additional measured biomarkers were collected during enrollment. Stored plasma and serum samples were isolated via centrifugation from blood samples collected within the first 7 days of hospital admission, in EDTA-containing tubes.
Stroke etiologies were adjudicated based on admission and inpatient workup. Clinical, laboratory, and imaging modalities were used to ascertain the most probable cause of stroke. All acute stroke cases did not have conflicting etiologies and had stored frozen plasma aliquots. The trial of Org 10172 in Acute Stroke Treatment classification system[36] was utilized to ascertain etiology but was further refined by anatomical locations of presumed causes of large artery strokes (aortic, cervical or intracranial). Stroke etiology was extracted from the discharge summary of participants with stroke and further confirmed by a vascular neurologist. Stroke etiology was sub-classified as Atherosclerotic if the stroke etiology was thought to be due to intra- or extra-cranial atherosclerotic disease (ICAD and/or ECAD, respectively). Non-atherosclerotic stroke cases lacked atherosclerotic components.
Within the Atherosclerotic group of cases, any ICAD refers to the group in which ischemic incidents are due to ICAD or jointly caused by ICAD; readers should be aware that this is a broader definition than the standard ICAD term. ECAD refers to a subgroup that lacks ICAD elements. Our 244 AIS cases were divided into: any ICAD (N = 89)-Blue, ECAD (N = 45)-Orange and non-atherosclerotic
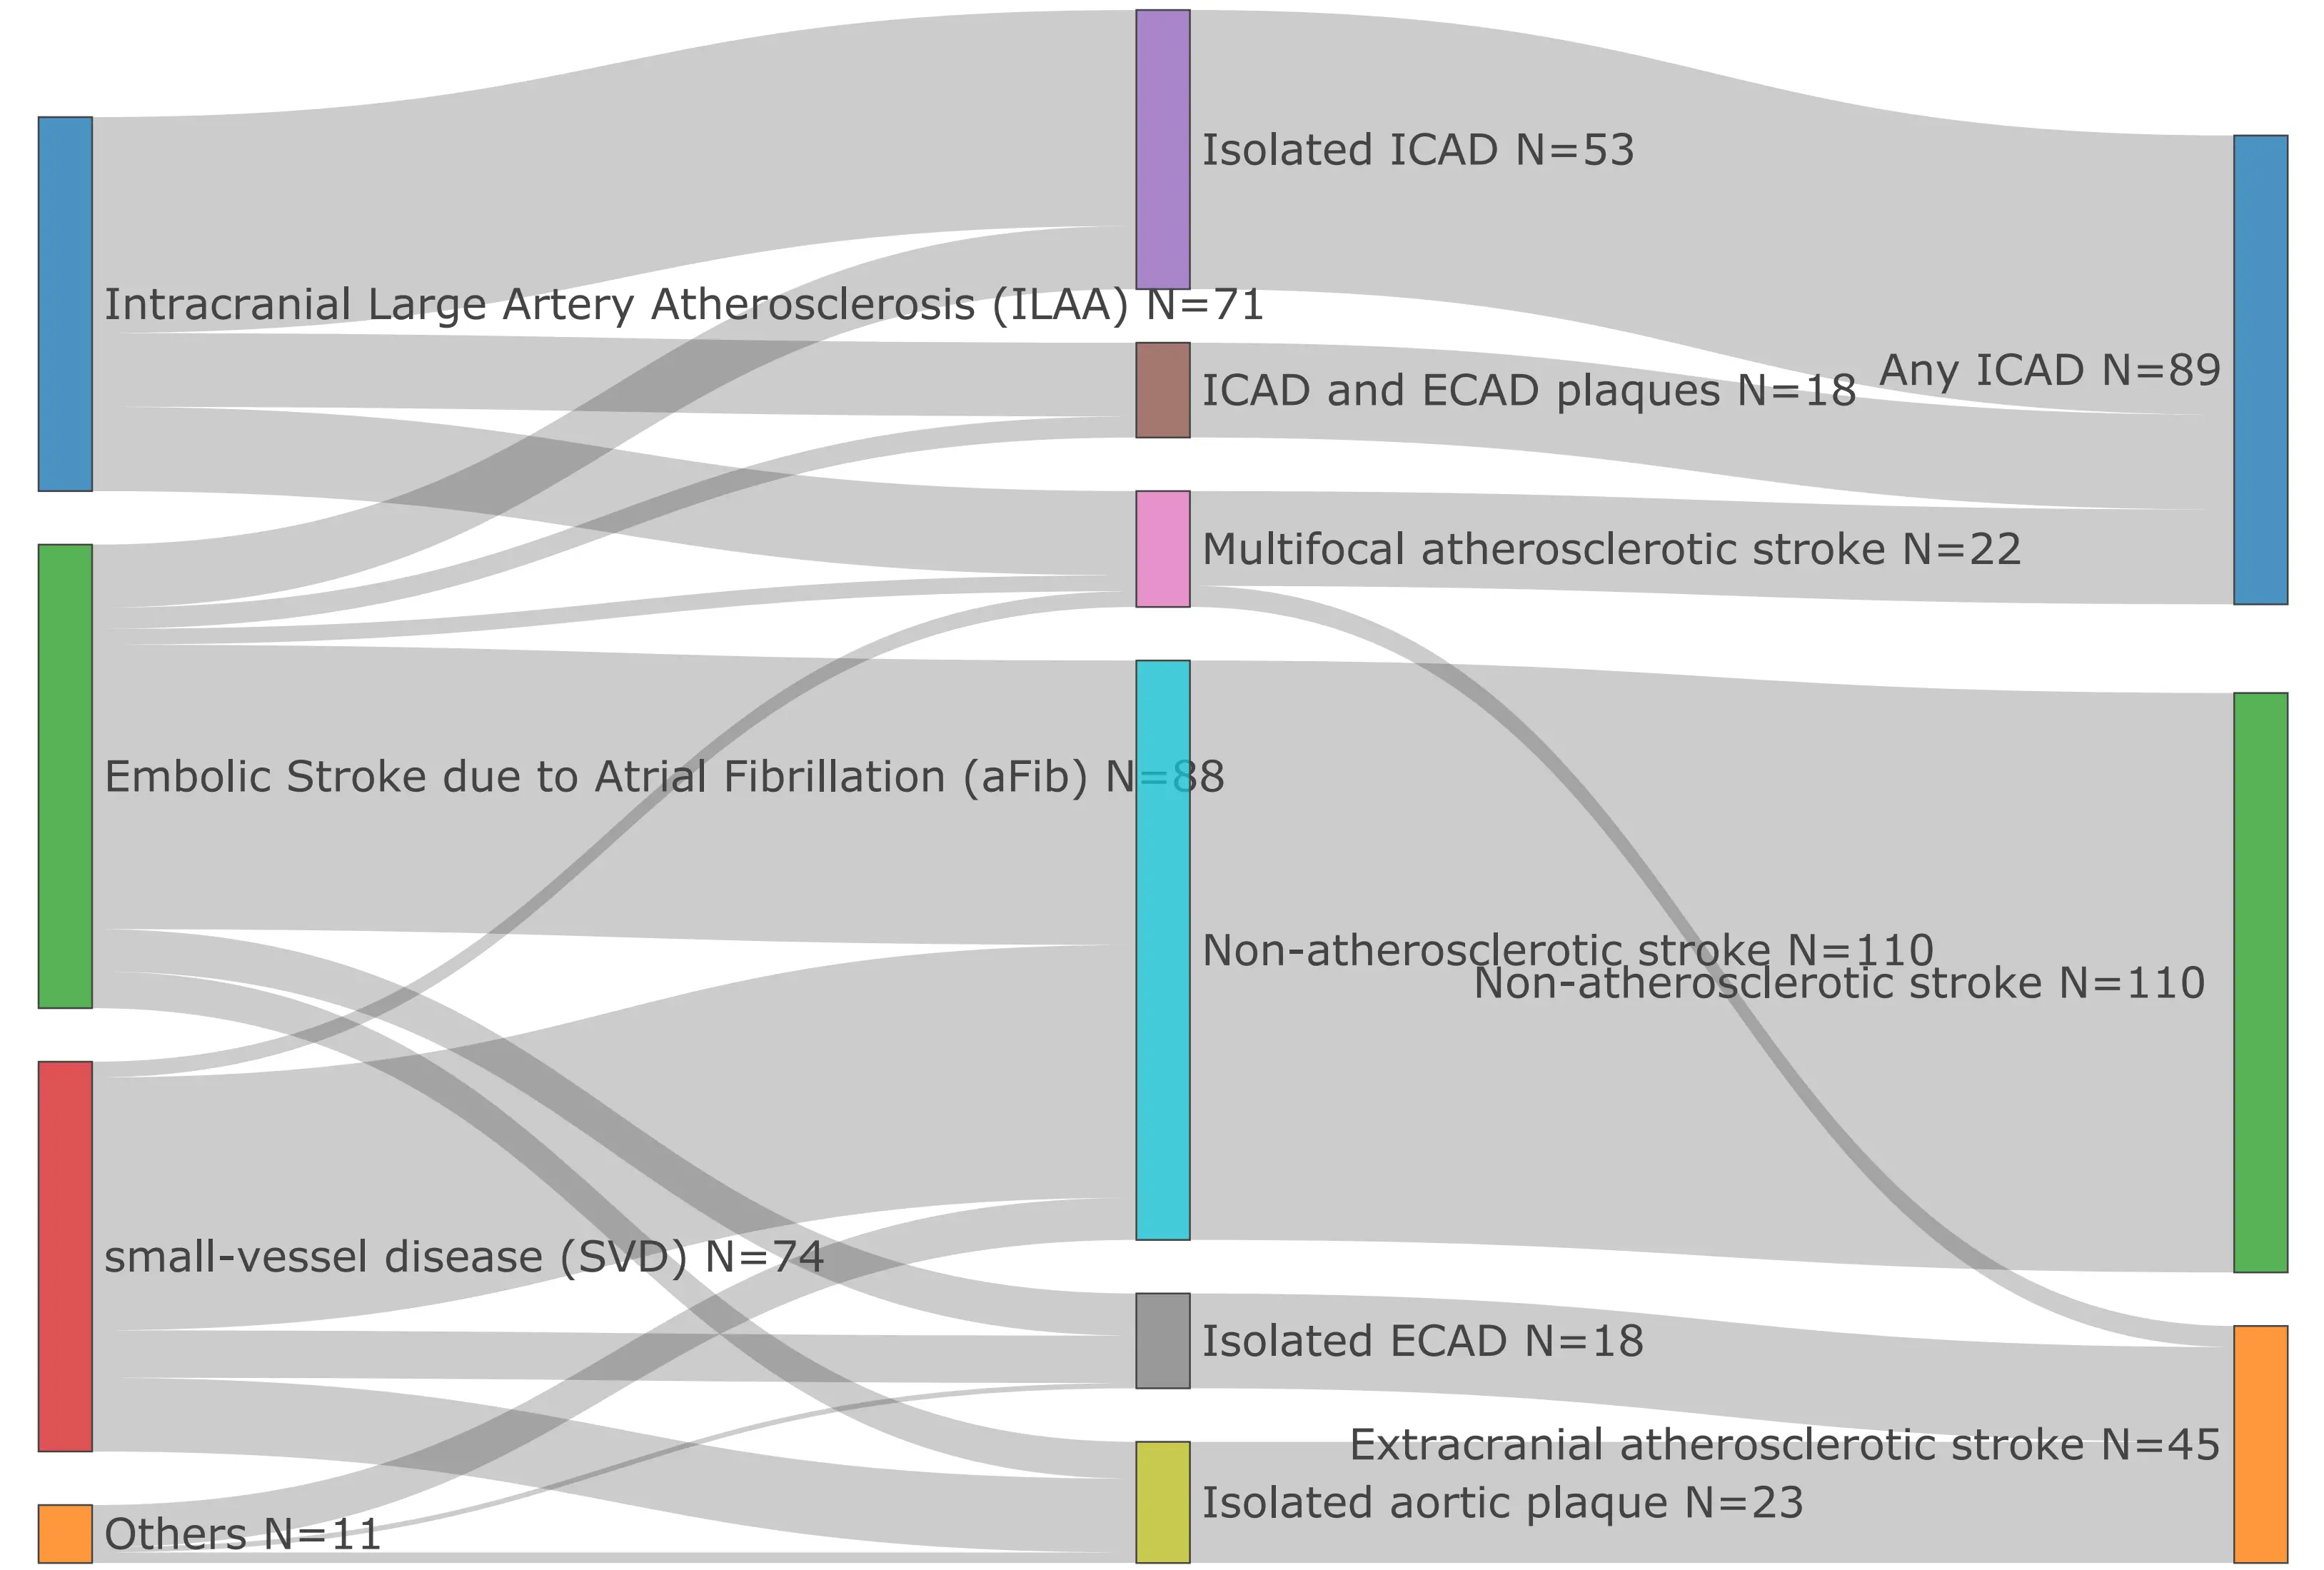
Figure 1. Acute ischemic stroke subtype classification in study population. ICAD: intracranial atherosclerotic disease; ECAD: extracranial atherosclerotic stroke.
2.3 Lipid and apolipoprotein B100 measurement
Lipid levels [total Cholesterol (C), HDL-C, triglycerides] were measured via standardized enzymatic methods on an Integra400 plus Analyzer (Roche Diagnostics Corporation) by the Biomarkers Laboratory of the Irving Clinical and Translational Research Center, Columbia University Medical Center, NY. Plasma LDL-C levels were estimated with the NIH equation 2[37]. Plasma APOB levels were measured by a human enzyme-linked immunosorbent assay (ELISA), purchased from Mabtech (3715-HP-2), Inc. Cincinnati, OH. The percentage of APOB in Lp(a) particles was calculated by converting our APOB100 plasma levels from mg/dl to nmol/l and assuming a one-to-one ratio with Lp(a) levels in nmol/l, calculating the percentage. This serves as a rough estimate of how many particles are being carried by the Lp(a) particles in plasma; other studies have performed more thorough estimations of these calculations[38] that includes corrections for plasma triglycerides, LDL-C, and non-HDL-C, which we did not do in our small cohort.
2.4 Lp(a) concentration and APO(a) isoform size
Lp(a) plasma concentrations were measured using the isoform-independent sandwich ELISA developed by the Northwest Lipid Metabolism and Diabetes Research Laboratory. In addition, the lab utilized gel electrophoresis to measure APO(a) isoform size. 250 µL of plasma was diluted in 40 µl of saline and combined with reducing buffer. The sample was then loaded onto an agarose gel, run overnight at 123V and 4 °C, transferred to a nitrocellulose membrane, immunoblotted, and imaged using the ChemiDoc MP Imaging System (Figure S1). This determined the isoform size present in the samples by comparison to an in-house standard (combined material containing six APO(a) isoforms, 38, 32, 24, 19, 15, and 12 KIV-2 repeats). The expression of each isoform was established using the Image Lab software, which calculated relative proportions of the two isoforms based on the intensity profile of each lane. This method has an intra-sample variability that does not exceed 15%[39]. A weighted isoform size (wIS) measurement was calculated[40].
2.5 Measurement of OxPL
OxPL-APOB was measured with an immunoassay that uses the immunoglobulin M antibody E06, which binds to
2.6 Data Analysis
Clinical characteristics are reported as absolute and percentage. Variables that were normally distributed are reported in mean and standard deviation format, while those that were not normally distributed are reported as medians along with interquartile ranges. The Wilcoxon Rank-Sum test (Mann-Whitney U test) was used to compare groups, as most of the biomarker values were
Based on the underlying hypothesis that abnormal lipid metabolism relates to atherosclerosis, a multivariate logistic regression model with 1) atherosclerotic stroke in atherosclerotic group versus non-atherosclerotic group, and 2) any ICAD versus ECAD group as the dependent variable was built with lipid biomarkers as the main exposure and age, sex, race/ethnicity, vascular risk factors (namely systolic blood pressure, blood glucose, HDL, LDL-C, and triglycerides), statin therapy, smoking history, and diabetes mellitus history were used as covariates. These variables were potential confounders based on plausibility and published studies showing effects on Lp(a) concentrations. In the regression model, all variables not following a normal distribution are logged with base 2. A
3. Results
The demographic and clinical characteristics of the study population (N = 244) are presented in Table 1. The median age of the participants was 73 years old. The population consisted of Non-Hispanic White, Non-Hispanic Black, Hispanic, and other (multiple or unknown backgrounds). Self-reported medical history was also incorporated into our data and highlights a population with an increased risk for multiple co-morbidities that drive ASCVD.
Table 1. Study population: Demographic and clinical characteristics.
| Variables | N = 244 | |
| Age | 73(61-82) | |
| Sex | Male | 141(58%) |
| Female | 103(42%) | |
| Ethnicity | Non-Hispanic white individuals | 51(21%) |
| Non-Hispanic Black individuals | 52(21%) | |
| Hispanic individuals | 125(51%) | |
| Other-multiple background or unknown | 16(7%) | |
| Hypertension | 196(80%) | |
| Antihypertensive medication use | 178(73%) | |
| Diabetes Mellitus | 101(41%) | |
| Dyslipidemia | 141(58%) | |
| Statin therapy | 111(45%) | |
| Smoking history | 44(18%) | |
| Coronary artery disease | 66(27%) | |
Data reported as median [IQR] for continuous variables and number (%) for categorical variables; N: number of participants; IQR: interquartile range.
3.1 Distribution of biomarkers in study population
The distribution of lipid-related biomarkers varied systematically across the ethnic groups (Table 2, Figure 2, Table S1). Across all participants, the median Lp(a) level was 41.9 nmol/L, with significant variability observed across different demographic groups. As expected, Non-Hispanic Blacks and Hispanics exhibited the highest median Lp(a) levels at 45.9 nmol/L (21.56-103.71) and 46.87 nmol/L (18.65-84.36), respectively. LDL-C levels were also comparable between Non-Hispanic Whites (110.09 mg/dL) and Blacks
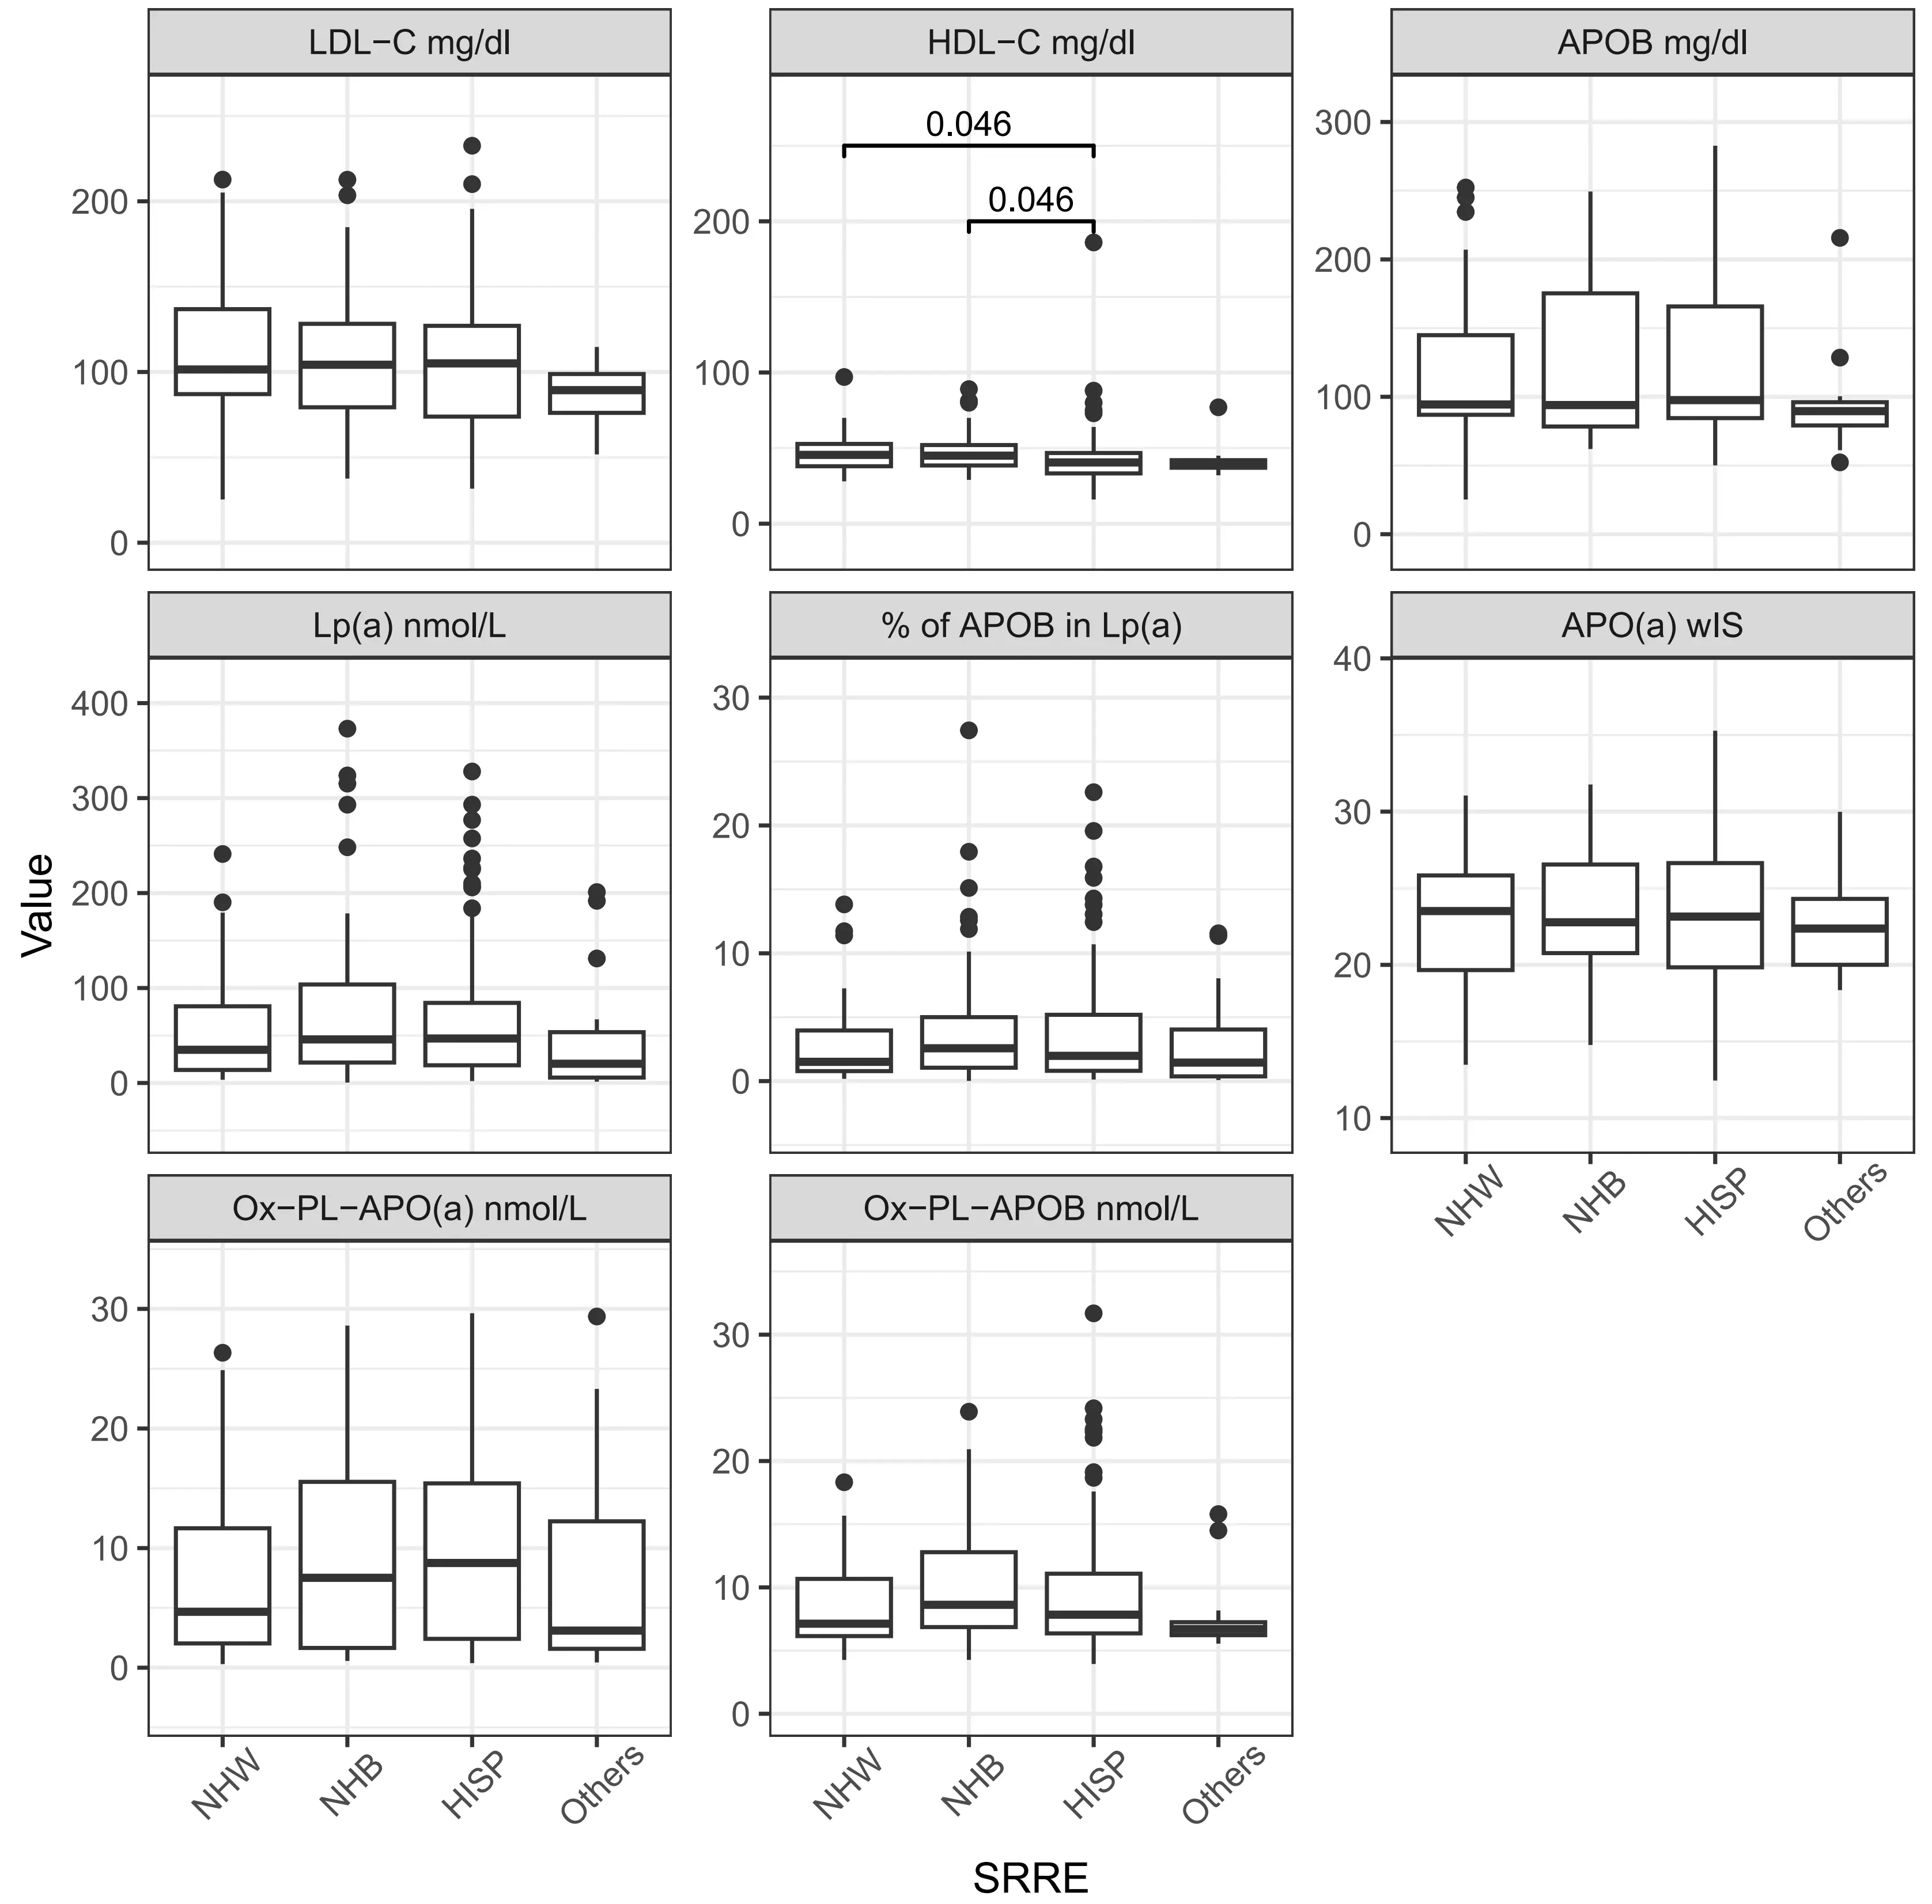
Figure 2. Lipid, lipoproteins and oxidized phospholipids levels by race/ethnicity. Significance in distribution comparison is assessed by pairwise Mann-Whitney U test with Benjamini-Hochberg FDR correction. Only significant results are illustrated. The source data can be found in Table S1. NHW: Non-Hispanic White; NHB: Non-Hispanic Black; HISP: Hispanic population; Chol: cholesterol; TG: triglyceride; HDL: high density lipoprotein; LDL: low density lipoprotein; APOB: apolipoprotein B100; APO(a): apolipoprotein (a); Lp(a): lipoprotein(a); OxPL: oxidized phospholipids; wIS: weighted isoform size; other: multiple backgrounds or unknown; FDR: false discovery rate.
Table 2. Lipid, lipoproteins, oxidized phospholipids levels.
| Biomarkers | All Participants (N = 244) | Non-Hispanic White (N = 51) | Non-Hispanic Black (N = 52) | Hispanic (N = 125) | Other (N = 16) |
| Total-Chol mg/dl | 172.22 ± 46.68 | 176.67 ± 45.57 | 176.4 ± 48.55 | 171.19 ± 48.04 | 151.77 ± 24.88 |
| TG mg/dl | 106 (80.75-156.25) | 93 (75.75-139.25) | 88 (65.25-133.75) | 117 (88-169) | 103 (77-157) |
| HDL-C mg/dl | 42 (35-49) | 45.5 (38-52.75) | 45 (38.5-52) | 40.5 (33.25-46.75) | 40 (37-42) |
| LDL-C mg/dl | 105.99 ± 39.93 | 110.09 ± 41.01 | 108.76 ± 41.79 | 105.47 ± 40.39 | 87.41 ± 18 |
| Lp(a) nmol/L | 41.9 (18.08-92.17) | 34.97 (13.73-80.74) | 45.9 (21.56-103.71) | 46.87 (18.65-84.36) | 20.25 (5.7-53.5) |
| APOB mg/dl | 95.68 (81.82-155.33) | 94.4 (86.91-144.86) | 93.97 (78.38-175.31) | 97.6 (84.49-165.75) | 89.56 (79.15-96.1) |
| % of APOB in Lp(a) | 1.94 (0.81-4.86) | 1.51 (0.78-3.96) | 2.57 (1.05-5) | 1.98 (0.81-5.19) | 1.45 (0.37-4.04) |
| APO(a) wIS | 23.28 ± 4.36 | 22.98 ± 4.02 | 23.39 ± 4.18 | 23.43 ± 4.69 | 22.79 ± 3.41 |
| OxPL-APO(a) nmol/L | 6.86 (1.95-15.27) | 4.68 (2.03-11.66) | 7.52 (1.65-15.54) | 8.76 (2.41-15.41) | 3.1 (1.58-12.24) |
| OxPL-APOB nmol/L | 7.71 (6.35-11) | 7.13 (6.14-10.67) | 8.62 (6.86-12.79) | 7.84 (6.36-11.08) | 6.7 (6.22-7.25) |
| Smaller APO(a) isoform Size | 19.67 ± 4.04 | 19.69 ± 3.75 | 19.71 ± 4.01 | 19.6 ± 4.18 | 20.06 ± 4.3 |
| Larger APO(a) isoformSize | 27.09 ± 5.43 | 27.02 ± 4.72 | 27.21 ± 5.29 | 26.93 ± 5.87 | 28.2 ± 4.68 |
All data presented as medians and IQR. IQR: interquartile range; Chol: cholesterol; TG: triglyceride; HDL: high density lipoprotein; LDL: low density lipoprotein;
The percentage of APOB in Lp(a) was highest in Non-Hispanic Blacks at 2.57% (1.05-5), which was notably higher compared to
3.2 Associations of biomarkers in AIS atherosclerotic vs. non-atherosclerotic groups
The associations of Lp(a) and other biomarkers were examined in the AIS atherosclerosis vs. non-atherosclerosis groups (Figure 3, Table 3, Table S2). Participants with ECAD showed the highest median Lp(a) levels at 66.05 nmol/L (29.57-103.79). Those without atherosclerosis had significantly (p = 0.006) lower median Lp(a) levels, 27.12 nmol/L (13.38-73.95).
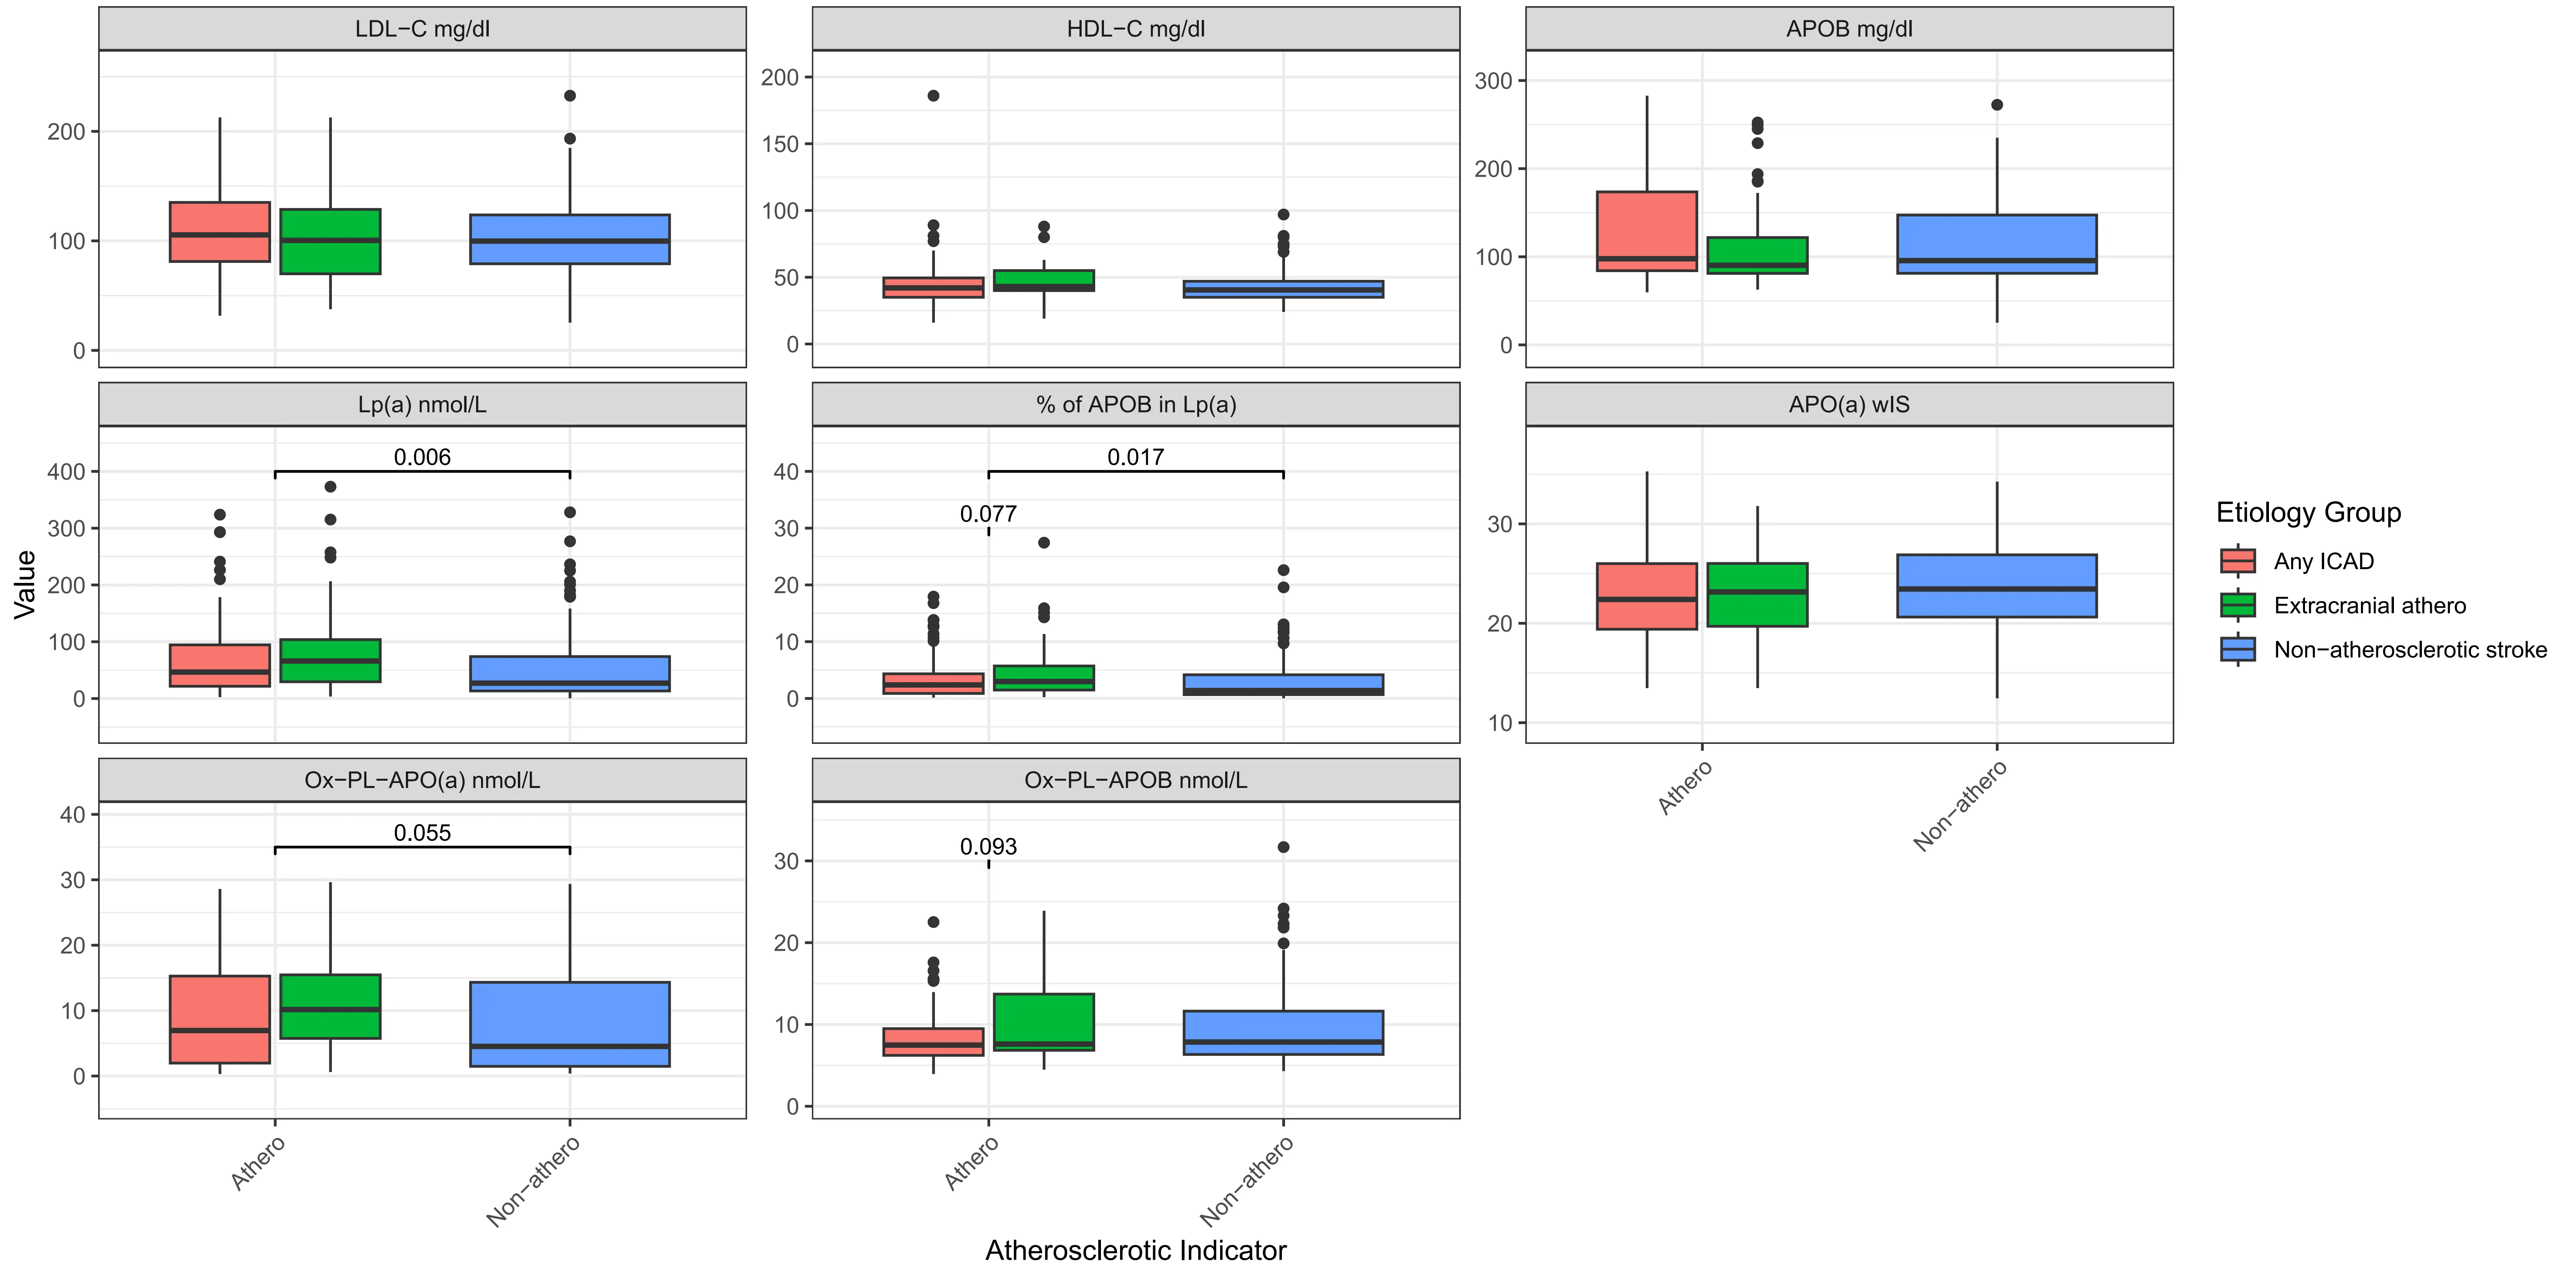
Figure 3. Boxplot for lipid, lipoproteins and oxidized phospholipids levels by stroke etiology classifications. Chol: Cholesterol; TG: triglyceride; HDL: high density lipoprotein; LDL: low density lipoprotein; APOB: apolipoprotein B100; APO(a): apolipoprotein (a); Lp(a): lipoprotein(a); OxPL: oxidized phospholipids; wIS: weighted isoform size; other: multiple backgrounds or unknown; Significance in distribution comparison is assessed by Mann-Whitney U test; Only significant (p < 0.05) and trend (p < 0.10) results are illustrated; The source data can be found in Table S2.
Table 3. Lipid, lipoproteins and oxidized phospholipids levels by new etiology classifications.
| Biomarkers | All Participants | Any ICAD | Extracranial atherosclerotic | Non-atherosclerotic |
| Total-Chol mg/dl | 172.22 ± 46.68 | 177.06 ± 48.05 | 172.56 ± 46.52 | 168.12 ± 45.73 |
| TG mg/dl | 106 (80.75-156.25) | 98 (80.5-163) | 108 (80-136) | 108 (81.75-157) |
| HDL-C mg/dl | 42 (35-49) | 42 (35-49.5) | 43 (40-55) | 40.5 (35-47) |
| LDL-C mg/dl | 105.99 ± 39.93 | 111.15 ± 41.57 | 105.37 ± 41.42 | 102.05 ± 37.82 |
| Lp(a) nmol/L | 41.9 (18.08-92.17) | 46.64 (21.65-94.54) | 66.05 (29.57-103.79) | 27.12 (13.38-73.95) |
| APOB mg/dl | 95.68 (81.82-155.33) | 97.72 (84.16-173.59) | 90.34 (81.14-121.82) | 95.6 (81.23-147.36) |
| % of APOB in Lp(a) | 1.94 (0.81-4.86) | 2.38 (0.88-4.34) | 2.98 (1.47-5.72) | 1.38 (0.67-4.16) |
| APO(a) wIS | 23.28 ± 4.36 | 22.79 ± 4.24 | 23.19 ± 4.07 | 23.72 ± 4.55 |
| OxPL-APO(a) nmol | 6.86 (1.95-15.27) | 6.96 (1.98-15.28) | 10.15 (5.75-15.47) | 4.53 (1.48-14.33) |
| OxPL-APOB nmol | 7.71 (6.35-11) | 7.48 (6.22-9.49) | 7.6 (6.84-13.71) | 7.86 (6.34-11.63) |
| Smaller APO(a) isoform size | 19.67 ± 4.04 | 19.6 ± 4.43 | 18.8 ± 3.54 | 20.09 ± 3.88 |
| Larger APO(a) isoform size | 27.09 ± 5.43 | 26.65 ± 5.34 | 27 ± 5.48 | 27.49 ± 5.51 |
Normally distributed features are in means ± s.d. format, while the skewed distribution is shown in median (IQR) format. IQR: interquartile range; Chol: cholesterol;
The highest total cholesterol and LDL-C levels were observed in participants with ICAD, with total cholesterol at 177.06 mg/dL and LDL-C at 111.15 mg/dL. HDL-C levels were consistent across groups, with a slight increase in those with ECAD (median 43 mg/dL). Similarly, TG levels were uniform across all groups, with slight variations, indicating that TG might have less impact on the type of atherosclerosis present in this cohort.
The percentage of APOB present in Lp(a) was highest in the ECAD group at 2.98% (1.47-5.72), which showed a higher trend
3.3 Association of biomarkers in AIS atherosclerotic groups
To further investigate the relationship of these biomarkers across the different stroke etiology categories, we performed logistic regression. We examined the associations between biomarkers in the different atherosclerotic groups [N = 114 [any ICAD (89) and ECAD (45)] vs. N = 110 non-atherosclerotic stroke (Figure 1)] (Table 4, Table S3). Lp(a) levels, when 2-based logged, were significantly associated with an increased risk of stroke, with an OR of 1.30 and a statistically significant p-value of 0.0057, highlighting the role of Lp(a) as a strong risk factor in stroke caused by atherosclerotic factors. APO(a) wIS shows an OR of 0.94 with a p-value of 0.079, implying a potential but not statistically significant protective effect against stroke.
Table 4. Associations of biomarkers with the presence of atherosclerotic stroke.
| Biomarkers | Effect Size | Odds Ratio | p-value |
| Lp(a)(nmol/l), 2-based logged | 0.26 | 1.30† | 0.0057* |
| APOB (mg/dl), 2-based logged | -0.09 | 0.91† | 0.77 |
| % of APOB in Lp(a) | 0.08 | 1.08 | 0.087’ |
| % of APOB in Lp(a), 2-based logged | 0.25 | 1.29† | 0.0069* |
| APO(a) wIS | -0.06 | 0.94 | 0.079’ |
| Smaller APO(a) isoform | -0.05 | 0.95 | 0.17 |
| OxPL-APO(a) (nmol/L), 2-based logged | 0.24 | 1.27† | 0.017* |
| OxPL-APOB (nmol/L), 2-based logged | -0.10 | 0.91† | 0.76 |
*: statistical significance; ’: statistical trending; the statistical significance threshold is 0.05 in logistic regression; †: when the biomarker is 2-based logged, the odd ratio is associated with the doubling of biomarker rather than 1-unit increase; Lp(a): Lipoprotein(a); OxPL: oxidized phospholipid; APOB: apolipoprotein B100; APO(a): apolipoprotein (a); wIS: weighted isoform size; The power analysis is in Table S3.
There was no statistical association of APOB with stroke risk (OR = 0.91, p-value = 0.77). However, the percentage of APOB in Lp(a), when 2-based logged, showed a significant association with stroke risk (OR = 1.29, p-value = 0.0069). We report that OxPL-APO(a), when 2-based logged, is associated with an increased stroke risk from atherosclerotic factors (OR = 1.27, p-value = 0.017). However, OxPL-APOB (OR = 0.91, p-value = 0.76) was no significant association with stroke risk.
Additional analysis of the atherosclerotic stroke sub-groups [ICAD (N = 89) vs. ECAD (N = 45)] showed that the percentage of APOB in Lp(a) (OR = 0.62, p-value = 0.007), Lp(a) (OR = 0.66, p-value = 0.019), and OxPL-APO(a) (OR = 0.69, p-value = 0.04) were associated with a lower odds to ICAD stroke within atherosclerotic cohorts (Table 5, Table S4).
Table 5. Associations of biomarkers with the presence of any ICAD-related atherosclerotic stroke.
| Biomarkers | Effect Size | Odds Ratio | p-value |
| Lp(a)(nmol/l), 2-based logged | -0.41 | 0.66† | 0.019* |
| APOB (mg/dl), 2-based logged | 0.84 | 2.31† | 0.10 |
| % of APOB in Lp(a) | -0.14 | 0.87 | 0.011* |
| % of APOB in Lp(a), 2-based logged | -0.47 | 0.62† | 0.007* |
| APO(a) wIS | -0.02 | 0.98 | 0.66 |
| Smaller APO(a) isoform | 0.08 | 1.08 | 0.15 |
| OxPL-APO(a) (nmol/L), 2-based logged | -0.38 | 0.69† | 0.04* |
| OxPL-APOB (nmol/L), 2-based logged | -0.95 | 0.39† | 0.054’ |
*: statistical significance; ’: statistical trending; the statistical significance threshold is 0.05 in logistic regression; †: when the biomarker is 2-based logged, the odd ratio is associated with the doubling of biomarker rather than 1-unit increase; Lp(a): Lipoprotein(a); OxPL: oxidized phospholipid; APOB: apolipoprotein B100; APO(a): apolipoprotein (a); wIS: weighted isoform size; The power analysis is in Table S4.
Considering the systematic differences in biomarkers that were observed between ICAD and ECAD atherosclerotic groups, we compared them separately to the non-atherosclerotic group. We observed that a two-fold increase in Lp(a) concentration is associated with higher odds of ECAD when compared to the non-atherosclerotic group (OR = 1.53, p-value = 0.0027), and observed two-fold increases in the percentage of APOB in Lp(a) (OR = 1.54, p-value = 0.002) and OxPL-APO(a) (OR = 1.53, p-value = 0.0076) in the ECAD group when compared to the non-atherosclerotic group (Table 6, Table S5). The finding on Lp(a) level aligned with the finding on the smaller APO(a) isoform size (OR = 0.89, p = 0.045). However, if we compared the ICAD only group vs. non-atherosclerotic stroke populations, no associations were found (Table S6). The stratified analysis suggests ECAD as having a larger association with biomarkers in those with high Lp(a).
Table 6. Associations of biomarkers with the presence of ECAD vs. non-atherosclerotic stroke population.
| Biomarkers | Effect Size | Odds Ratio | p-value |
| Lp(a)(nmol/l), 2-based logged | 0.43 | 1.53† | 0.0027* |
| APOB (mg/dl), 2-based logged | -0.6 | 0.55† | 0.19 |
| % of APOB in Lp(a) | 0.12 | 1.13 | 0.019* |
| % of APOB in Lp(a), 2-based logged | 0.43 | 1.54† | 0.002* |
| APO(a) wIS | -0.06 | 0.94 | 0.23 |
| Smaller APO(a) isoform | -0.12 | 0.89 | 0.045* |
| OxPL-APO(a) (nmol/L), 2-based logged | 0.43 | 1.53† | 0.0076* |
| OxPL-APOB (nmol/L), 2-based logged | 0.26 | 1.30† | 0.51 |
*: statistical significance (the statistical significance threshold is 0.05 in logistic regression); †: when the biomarker is 2-based logged, the odd ratio is associated with the doubling of biomarker rather than 1-unit increase; Lp(a): Lipoprotein(a); OxPL: oxidized phospholipid; APOB: apolipoprotein B100; APO(a): apolipoprotein (a); wIS: weighted isoform size; ECAD: extracranial atherosclerotic stroke ; The power analysis is in Table S5.
Due to our small sample size, power analysis for all the study outcome data presented on Table 4, Table 5, Table 6 is presented on Table S3,S4,S5,S6. These limited powers support the need for larger studies that can serve as validation or counter statements to our negative study findings like on APOB concentration and scenarios, like Table S6. The provided 80% power sample size estimation can assist in future study design.
4. Discussion
In this cross-sectional analysis of AIS subgroups, we observed expected lipid differences across ethnicities, including higher median Lp(a) levels among Non-Hispanic Black and Hispanic participants. Consistent with prior reports linking small APO(a) isoform sizes to stroke risk[7,43], our cohort demonstrated wIS means indicative of smaller APO(a) sizes. High Lp(a) levels have also been implicated in stroke among younger adults[16]; however our current cohort was composed of elderly adults. Studies in a younger cohort could provide insightful data on whether these biomarkers could be useful in that population.
While previous studies have established elevated Lp(a) as a significant risk factor for ischemic stroke, particularly in specific populations[7,15,44,45], we aimed to further explore associated biomarkers that may refine atherosclerotic stroke classification. In alignment with prior meta-analysis[46], we found that Lp(a) levels were positively associated with atherosclerotic stroke. Specifically, higher proportions of APOB on Lp(a), total serum Lp(a), and OxPL–APO(a) concentrations showed a greater association with ECAD than with ICAD. These results reinforce a potential role for Lp(a) and its oxidative modifications in the pathogenesis of large-artery
Our findings support previous work identifying APO(a) as the primary carrier of OxPL and a key driver of atherosclerosis[48,49]. The observed correlations between Lp(a)-OxPL and smaller apo(a) isoforms further suggest that oxidative modifications of Lp(a) may contribute to vascular instability and stroke risk[51]. In contrast, APOB and OxPL–APOB were not significantly associated with atherosclerotic stroke in our study, reflecting the high statin use (45%) within this cohort, although analyses were adjusted for this variable. Importantly, other studies in larger cohorts have reported associations between APOB and OXPL-APOB with stroke
Elevated total cholesterol and LDL-C concentrations in the ICAD subgroup underscore the importance of intensive lipid management to prevent intracranial atherosclerosis. The specific association between high Lp(a) and ECAD observed here suggests that additional work is required in this area to see if targeted Lp(a)-lowering therapies may hold promise for this subgroup. The MESA studies diverse cohort is comparable to the current study participants. While prior MESA data linked elevated Lp(a) to coronary heart disease but not to ischemic stroke[54], our findings highlight the potential contribution of OxPL-related mechanisms, which were not assessed in that study. Consistent with subsequent MESA analyses[55], we observed higher OxPL levels in the atherosclerotic subgroup. In summary, the proportion of APOB carried on Lp(a) and concentrations of OxPL–apo(a) appear to provide additional mechanistic insight into the etiology and risk stratification of AIS. These biomarkers may help refine stroke classification and identify therapeutic targets within the atherosclerotic spectrum of disease.
5. Study Limitations
Despite detailed characterization of the AIS subgroups, our study lacked a control group, which would have strengthened comparative analyses. Our sample size was small, with statistical power being low for some of the outcomes, the latter limiting the ability to perform stratified analyses by tertiles or quartiles. We have included a power analysis, along with an expected 80% power sample size for each outcome in the supplemental data based on Monte-Carlo resampling. Replication of the findings with these biomarkers in independent stroke cohorts will be useful for a more robust conclusion about our negative findings. Additionally, plasma samples were stored for less than five years before Lp(a) measurement, but storage duration may have modestly affected measured concentrations and wIS. Prior reports suggest that Lp(a) degradation during long-term storage occurs in a heterogeneous and non-linear manner. All samples in our study were frozen and never thawed, reducing but not eliminating this potential bias. Finally, although samples were obtained between 48 hours and seven days after the acute event, variability in sampling time may have influenced measured biomarker levels.
Supplementary materials
The supplementary material for this article is available at: Supplementary materials.
Acknowledgements
The authors would like to thank the study participants. The Lp(a) plasma levels and isoform size were measured by Medpace, Inc. under the expertise of Dr. Santica Marcovina.
Authors contribution
Reyes-Soffer G: Conceptualization, data curation, formal analysis, funding acquisition, investigation, methodology, project administration, resources, software, supervision, writing-original draft, writing review & editing.
Gutierrez J: Data curation, formal analysis, funding acquisition, investigation, methodology, resources, software, writing review & editing.
Li Y: Data curation, formal analysis, methodology, software, writing-original draft, writing review & editing.
Then E: Data curation, writing-original draft, writing review & editing.
Matienzo N: Data curation, writing review & editing.
Khasiyev F: Software, writing review & editing.
Rahman S, Matveyenko A, Pavlyha M, Marshall RS, Willey J:
Conflicts of interest
Gissette Reyes-Soffer is an Editorial Board Member of Advances in Lipoprotein(a) Research and consults for Eli Lilly, Novartis and has research funds from Kaneka, Inc. None of these commitments are linked to the current study. Salwa Rahman has received honoraria for consultancy on LPA genetics from Novartis AG (Basel, CH) and Silence Therapeutics PLC (London, UK). Farid Khasiyev has received honoraria for lectures and consultancies from Novartis, Amgen, Silence Therapeutics, CRISPR Therapeutics and Roche. The other authors declare no conflicts of interest.
Ethical approval
The complete protocol was approved by Columbia University Medical Center Institutional Review Board (IRB AAAS5563).
Consent to participate
Informed consent was obtained from all participants.
Consent for publication
Not applicable.
Availability of data and materials
Data supporting the findings of this study are available from the corresponding author upon reasonable request.
Funding
This study was funded by the Columbia University Clinical Translational Science Award (Irving Scholar Award: Gissette Reyes-Soffer) grant: UL1TR001873, NIH/NLBI HL139759 and, Private Donor funds to Gissette Reyes-Soffer. NIH grant R01AG057709 to Jose Gutierrez.
Copyright
© The Author(s) 2026.
References
-
1. Global, regional, and national burden of stroke and its risk factors, 1990-2019: A systematic analysis for the Global Burden of Disease Study 2019. Lancet Neurol. 2021;20(10):795-820.[DOI]
-
2. Clarke R, Wright N, Lin K, Yu C, Walters RG, Lv J, et al. Causal relevance of Lp(a) for coronary heart disease and stroke types in East Asian and European ancestry populations: A mendelian randomization study. Circulation. 2025;151(24):1699-1711.[DOI]
-
3. Ohira T, Schreiner PJ, Morrisett JD, Chambless LE, Rosamond WD, Folsom AR. Lipoprotein(a) and incident ischemic stroke: The atherosclerosis risk in communities (ARIC) study. Stroke. 2006;37(6):1407-1412.[DOI]
-
4. Arora P, Kalra R, Callas PW, Alexander KS, Zakai NA, Wadley V, et al. Lipoprotein(a) and risk of ischemic stroke in the REGARDS study. Arterioscler Thromb Vasc Biol. 2019;39(4):810-818.[DOI]
-
5. Wong ND, Fan W, Hu X, Ballantyne C, Hoodgeveen RC, Tsai MY, et al. Lipoprotein(a) and long-term cardiovascular risk in a multi-ethnic pooled prospective cohort. J Am Coll Cardiol. 2024;83(16):1511-1525.[DOI]
-
6. Aronis KN, Zhao D, Hoogeveen RC, Alonso A, Ballantyne CM, Guallar E, et al. Associations of lipoprotein(a) levels with incident atrial fibrillation and ischemic stroke: The ARIC (Atherosclerosis Risk in Communities) study. J Am Heart Assoc. 2017;6(12):e007372.[DOI]
-
7. Langsted A, Nordestgaard BG, Kamstrup PR. Elevated lipoprotein(a) and risk of ischemic stroke. J Am Coll Cardiol. 2019;74(1):54-66.[DOI]
-
8. Larsson SC, Gill D, Mason AM, Jiang T, Bäck M, Butterworth AS, et al. Lipoprotein(a) in Alzheimer, atherosclerotic, cerebrovascular, thrombotic, and valvular disease: Mendelian randomization investigation. Circulation. 2020;141(22):1826-1828.[DOI]
-
9. Koutsogianni AD, Liberopoulos E, Tellis K, Tselepis AD. Oxidized phospholipids and lipoprotein(a): An update. Eur J Clin Invest. 2022;52(4):e13710.[DOI]
-
10. Ridker PM, Stampfer MJ, Hennekens CH. Plasma concentration of lipoprotein(a) and the risk of future stroke. JAMA. 1995;273(16):1269-1273.[DOI]
-
11. Mazhar Z, Hughes A, Garelnabi M. Targeting the role of lipoprotein (a) in stroke. Cardiovasc Hematol Disord Drug Targets. 2017;17(1):64-72.[DOI]
-
12. Bushnell C, Kernan WN, Sharrief AZ, Chaturvedi S, Cole JW, Cornwell WK, et al. 2024 guideline for the primary prevention of stroke: A guideline from the American heart association/American stroke association. Stroke. 2024;55(12):e344-e424.[DOI]
-
13. Palaiodimou L, Melanis K, Stefanou MI, Theodorou A, Giannopoulos S, Lambadiari V, et al. The association of lipoprotein(a) and stroke recurrence: A systematic review and meta-analysis. J Stroke. 2025;27(2):161-168.[DOI]
-
14. Kao AS, Kermanshahchi J, Khosrowjerdi S, Razavi AC, Levene J, Reyes M, et al. Demographics of lipoprotein(a) and stroke: The UK biobank. Am J Prev Cardiol. 2025;23:101055.[DOI]
-
15. Pan Y, Li H, Wang Y, Meng X, Wang Y. Causal effect of Lp(a) [lipoprotein(a)] level on ischemic stroke and Alzheimer disease: A Mendelian randomization study. Stroke. 2019;50(12):3532-3539.[DOI]
-
16. Nave AH, Lange KS, Leonards CO, Siegerink B, Doehner W, Landmesser U, et al. Lipoprotein (a) as a risk factor for ischemic stroke: A meta-analysis. Atherosclerosis. 2015;242(2):496-503.[DOI]
-
17. Langsted A, Kamstrup PR, Nordestgaard BG. High lipoprotein(a) and high risk of mortality. Eur Heart J. 2019;40(33):2760-2770.[DOI]
-
18. Wilson PWF, Polonsky TS, Miedema MD, Khera A, Kosinski AS, Kuvin JT. Systematic review for the 2018 AHA/ACC/AACVPR/AAPA/ABC/ACPM/ADA/AGS/APhA/ASPC/NLA/PCNA guideline on the management of blood cholesterol: A report of the American college of cardiology/American heart association task force on clinical practice guidelines. Circulation. 2019;139(25):e1144-e1161.[DOI]
-
19. Bhatia HS, Hurst S, Desai P, Zhu W, Yeang C. Lipoprotein(a) testing trends in a large academic health system in the United States. J Am Heart Assoc. 2023;12(18):e031255.[DOI]
-
20. Pavlyha M, Li Y, Crook S, Anderson BR, Reyes-Soffer G. Race/ethnicity and socioeconomic status affect the assessment of lipoprotein(a) levels in clinical practice. J Clin Lipidol. 2024;18(5):e720-e728.[DOI]
-
21. Reyes-Soffer G, Ginsberg HN, Berglund L, Duell PB, Heffron SP, Kamstrup PR, et al. Lipoprotein(a): A genetically determined, causal, and prevalent risk factor for atherosclerotic cardiovascular disease: A scientific statement from the American heart association. Arterioscler Thromb Vasc Biol. 2022;42(1):e48-e60.[DOI]
-
22. Mukamel RE, Handsaker RE, Sherman MA, Barton AR, Zheng Y, McCarroll SA, et al. Protein-coding repeat polymorphisms strongly shape diverse human phenotypes. Science. 2021;373(6562):1499-1505.[DOI]
-
23. Coassin S, Schönherr S, Weissensteiner H, Erhart G, Forer L, Losso JL, et al. A comprehensive map of single-base polymorphisms in the hypervariable LPA kringle IV type 2 copy number variation region. J Lipid Res. 2019;60(1):186-199.[DOI]
-
24. Utermann G, Menzel HJ, Kraft HG, Duba HC, Kemmler HG, Seitz C. Lp(a) glycoprotein phenotypes. Inheritance and relation to Lp(a)-lipoprotein concentrations in plasma. J Clin Invest. 1987;80(2):458-465.[DOI]
-
25. Sandholzer C, Hallman DM, Saha N, Sigurdsson G, Lackner C, Császár A, et al. Effects of the apolipoprotein(a) size polymorphism on the lipoprotein(a) concentration in 7 ethnic groups. Hum Genet. 1991;86(6):607-614.[DOI]
-
26. Sandholzer C, Saha N, Kark JD, Rees A, Jaross W, Dieplinger H, et al. Apo(a) isoforms predict risk for coronary heart disease. A study in six populations. Arterioscler Thromb. 1992;12(10):1214-1226.[DOI]
-
27. Paultre F, Pearson TA, Weil HF, Tuck CH, Myerson M, Rubin J, et al. High levels of Lp(a) with a small apo(a) isoform are associated with coronary artery disease in African American and white men. Arterioscler Thromb Vasc Biol. 2000;20(12):2619-2624.[DOI]
-
28. Gencer B, Kronenberg F, Stroes ES, Mach F. Lipoprotein(a): The revenant. Eur Heart J. 2017;38(20):1553-1560.[DOI]
-
29. Tsimikas S. A test in context: Lipoprotein(a): Diagnosis, prognosis, controversies, and emerging therapies. J Am Coll Cardiol. 2017;69(6):692-711.[DOI]
-
30. Tsimikas S, Aikawa M, Miller FJ, Miller ER, Torzewski M, Lentz SR, et al. Increased plasma oxidized phospholipid:Apolipoprotein B-100 ratio with concomitant depletion of oxidized phospholipids from atherosclerotic lesions after dietary lipid-lowering: A potential biomarker of early atherosclerosis regression. Arterioscler Thromb Vasc Biol. 2007;27(1):175-181.[DOI]
-
31. Kiechl S, Willeit J, Mayr M, Viehweider B, Oberhollenzer M, Kronenberg F, et al. Oxidized phospholipids, lipoprotein(a), lipoprotein-associated phospholipase A2 activity, and 10-year cardiovascular outcomes: Prospective results from the Bruneck study. Arterioscler Thromb Vasc Biol. 2007;27(8):1788-1795.[DOI]
-
32. Tsimikas S, Willeit P, Willeit J, Santer P, Mayr M, Xu Q, et al. Oxidation-specific biomarkers, prospective 15-year cardiovascular and stroke outcomes, and net reclassification of cardiovascular events. J Am Coll Cardiol. 2012;60(21):2218-2229.[DOI]
-
33. Leibundgut G, Scipione C, Yin H, Schneider M, Boffa MB, Green S, et al. Determinants of binding of oxidized phospholipids on apolipoprotein (a) and lipoprotein (a). J Lipid Res. 2013;54(10):2815-2830.[DOI]
-
34. Byun YS, Lee JH, Arsenault BJ, Yang X, Bao W, DeMicco D, et al. Relationship of oxidized phospholipids on apolipoprotein B-100 to cardiovascular outcomes in patients treated with intensive versus moderate atorvastatin therapy: The TNT trial. J Am Coll Cardiol. 2015;65(13):1286-1295.[DOI]
-
35. Gurel K, Khasiyev F, Spagnolo-Allende A, Rahman S, Liu M, Kulick ER, et al. The role of intracranial artery calcification (IAC) in stroke subtype and risk of vascular events. J Stroke Cerebrovasc Dis. 2023;32(8):107185.[DOI]
-
36. Adams HP, Bendixen BH, Kappelle LJ, Biller J, Love BB, Gordon DL, et al. Classification of subtype of acute ischemic stroke. Definitions for use in a multicenter clinical trial. Stroke. 1993;24(1):35-41.[DOI]
-
37. Nuwaylati DA, Awan ZA. A novel equation for the estimation of low-density lipoprotein cholesterol in the Saudi Arabian population: A derivation and validation study. Sci Rep. 2024;14(1):5478.[DOI]
-
38. Chilazi M, Zheng W, Park J, Marvel FA, Khoury S, Jones SR, et al. Quantifying the contribution of lipoprotein(a) to all apoB containing particles. J Clin Lipidol. 2022;16(2):220-226.[DOI]
-
39. Marcovina SM, Hobbs HH, Albers JJ. Relation between number of apolipoprotein(a) kringle 4 repeats and mobility of isoforms in agarose gel: Basis for a standardized isoform nomenclature. Clin Chem. 1996;42(3):436-439.[DOI]
-
40. Matveyenko A, Matienzo N, Ginsberg H, Nandakumar R, Seid H, Ramakrishnan R, et al. Relationship of apolipoprotein(a) isoform size with clearance and production of lipoprotein(a) in a diverse cohort. J Lipid Res. 2023;64(3):100336.[DOI]
-
41. Rosenson RS, López JAG, Gaudet D, Baum SJ, Stout E, Lepor NE, et al. Olpasiran, oxidized phospholipids, and systemic inflammatory biomarkers: Results from the OCEAN(a)-DOSE trial. JAMA Cardiol. 2025;10(5):482-486.[DOI]
-
42. Bulus M. pwrss: Statistical power and sample size calculation tools [Internet]. 2025. Available from: https://cran.r-project.org/web/packages/pwrss/index.html
-
43. Zambrelli E, Emanuele E, Marcheselli S, Montagna L, Geroldi D, Micieli G. Apo(a) size in ischemic stroke: Relation with subtype and severity on hospital admission. Neurology. 2005;64(8):1366-1370.[DOI]
-
44. Arenillas JF, Molina CA, Chacón P, Rovira A, Montaner J, Coscojuela P, et al. High lipoprotein (a), diabetes, and the extent of symptomatic intracranial atherosclerosis. Neurology. 2004;63(1):27-32.[DOI]
-
45. Chandra AA, Duran Luciano P, Swett K, Kaplan R, Talavera GA, Lamar M, et al. Association of Lp(a) with stroke and cerebral injury on MRI: Insights from the HCHS/SOL (Hispanic community Health Study/Study of Latinos) and investigation of neurocognitive aging MRI (SOL-INCA MRI). Stroke. 2025;56(6):1492-1504.[DOI]
-
46. Kumar P, Swarnkar P, Misra S, Nath M. Lipoprotein (a) level as a risk factor for stroke and its subtype: A systematic review and meta-analysis. Sci Rep. 2021;11(1):15660.[DOI]
-
47. Arnold M, Schweizer J, Nakas CT, Schütz V, Westphal LP, Inauen C, et al. Lipoprotein(a) is associated with large artery atherosclerosis stroke aetiology and stroke recurrence among patients below the age of 60 years: Results from the BIOSIGNAL study. Eur Heart J. 2021;42(22):2186-2196.[DOI]
-
48. Bergmark C, Dewan A, Orsoni A, Merki E, Miller ER, Shin MJ, et al. A novel function of lipoprotein [a] as a preferential carrier of oxidized phospholipids in human plasma. J Lipid Res. 2008;49(10):2230-2239.[DOI]
-
49. Tsimikas S, Kiechl S, Willeit J, Mayr M, Miller ER, Kronenberg F, et al. Oxidized phospholipids predict the presence and progression of carotid and femoral atherosclerosis and symptomatic cardiovascular disease: Five-year prospective results from the Bruneck study. J Am Coll Cardiol. 2006;47(11):2219-2228.[DOI]
-
50. Tian Y, Lu L, Zhang Y, Wei J. The value of Lp(a) and TG/HDLC in peripheral blood to assess the stability of carotid plaque in patients with ischemic stroke. Brain Behav. 2024;14(1):e3355.[DOI]
-
51. Berglund L, Kim K, Zhang W, Prakash N, Truax K, Anuurad E, et al. Lp(a)-associated oxidized phospholipids in healthy black and white participants in relation to apo(a) size, age, and family structure. J Am Heart Assoc. 2021;10(17):e020158.[DOI]
-
52. Faghihnia N, Tsimikas S, Miller ER, Witztum JL, Krauss RM. Changes in lipoprotein(a), oxidized phospholipids, and LDL subclasses with a low-fat high-carbohydrate diet. J Lipid Res. 2010;51(11):3324-3330.[DOI]
-
53. Byun YS, Yang X, Bao W, DeMicco D, Laskey R, Witztum JL, et al. Oxidized phospholipids on apolipoprotein B-100 and recurrent ischemic events following stroke or transient ischemic attack. J Am Coll Cardiol. 2017;69(2):147-158.[DOI]
-
54. Colantonio LD, Bittner V, Safford MM, Marcovina S, Brown TM, Jackson EA, et al. Lipoprotein(a) and the risk for coronary heart disease and ischemic stroke events among black and white adults with cardiovascular disease. J Am Heart Assoc. 2022;11(11):e025397.[DOI]
-
55. Bhatia HS, Dweck MR, Craig N, Capoulade R, Pibarot P, Trainor PJ, et al. Oxidized phospholipids and calcific aortic valvular disease. J Am Coll Cardiol. 2024;84(25):2430-2441.[DOI]
Copyright
© The Author(s) 2026. This is an Open Access article licensed under a Creative Commons Attribution 4.0 International License (https://creativecommons.org/licenses/by/4.0/), which permits unrestricted use, sharing, adaptation, distribution and reproduction in any medium or format, for any purpose, even commercially, as long as you give appropriate credit to the original author(s) and the source, provide a link to the Creative Commons license, and indicate if changes were made.
Publisher’s Note
Science Exploration remains a neutral stance on jurisdictional claims in published
maps
and institutional affiliations. The views expressed in this article are solely those
of
the author(s) and do not reflect the opinions of the Editors or the publisher.
Share And Cite


Science Exploration Style
Li Y, Then E, Rahman S, Matienzo N, Matveyenko A, Pavlyha M, et al. Association of lipoprotein(a), oxidized phospholipids and apolipoprotein B100 in acute ischemic stroke cohort. Adv Lipoprotein(a) Res. 2026;1:202508. https://doi.org/10.70401/alr.2026.0005
Tips
Copy completed.
Submit a Manuscript
Author Instructions
Cite this Article
Article Metrics
0
View
0
Download
Cited
Article Updates

Science Exploration Style
Li Y, Then E, Rahman S, Matienzo N, Matveyenko A, Pavlyha M, et al. Association of lipoprotein(a), oxidized phospholipids and apolipoprotein B100 in acute ischemic stroke cohort. Adv Lipoprotein(a) Res. 2026;1:202508. https://doi.org/10.70401/alr.2026.0005
copy
Share Link
copy