Temporal and spatial load characteristics of 5G base stations based on historical electricity data considering impacts on urban energy system

*Correspondence to:
Wenjie Gang, School of Environmental Science and Engineering, Huazhong University of Science & Technology, Wuhan 430074, Hubei, China; Key Laboratory of Multi-media Pollution Cooperative Control in Yangtze Basin, School of Environmental Science and Engineering, Huazhong University of Science & Technology, Wuhan 430074, Hubei, China.
E-mail: gangwenjie@hust.edu.cn
J Build Des Environ. 2026;4:202624. 10.70401/jbde.2026.0045
Received: May 25, 2026Accepted: September 04, 2026Published: September 04, 2026
Abstract
The rapid development of the digital economy has led to a significant increase in the scale and electricity load of 5G base stations in urban areas. It is therefore essential to study the load characteristics of 5G base stations to enhance urban grid stability and improve the energy efficiency of telecom operators. This paper investigates the load characteristics of 5G base stations using energy data from 37,525 5G base stations. The comprehensive analysis examines spatial distribution patterns, temporal load characteristics, and grid integration impacts using 15-minute resolution data. Results show that base station deployment is strongly correlated with population density (r = 0.92). Temporal load patterns show strong seasonal characteristics, with summer consumption about 1 kW higher than winter consumption, driven primarily by temperature-dependent cooling demand. The base stations maintain consistently low capacity utilization rates (26-41%), indicating substantial infrastructure redundancy. Strong synchronization exists between base station and grid loads during peak consumption periods, increasing peak stress but also revealing significant demand response potential. This study can help urban energy facilities identify new flexible sources and improve 5G station planning and operations.
Keywords
5G base station, load pattern, urban energy system, electricity consumption, spatial distribution
1. Introduction
In recent years, the rapid expansion of the digital economy has driven exponential growth in data volumes, substantially increasing energy demands across transmission, storage, computation, and interconnected devices[1,2]. As critical urban digital infrastructure, 5G base stations facilitate the integrated development of networks[3], applications[4], and industries[5]. While 5G technology offers enhanced capabilities, including higher bandwidth and transmission capacity, measurements by China Mobile indicate that a 5G macro base station consumes approximately three to four times as much power as a 4G macro base station[6]. Currently, nearly 3 million 5G base stations operate in China, resulting in approximately 300 GWh of daily energy consumption[7]. Moreover, 5G base stations will be deployed at a higher rate in urban areas, which means 5G network energy consumption will increase rapidly over the next decade. Such energy demand entails non-negligible environmental and operational costs[8] and increases the carbon footprint of 5G networks[9,10]. Therefore, analyzing the temporal and spatial characteristics of 5G base station loads is crucial for sustainable urban energy management and the integrated planning of telecommunications and urban power infrastructure[11,12].
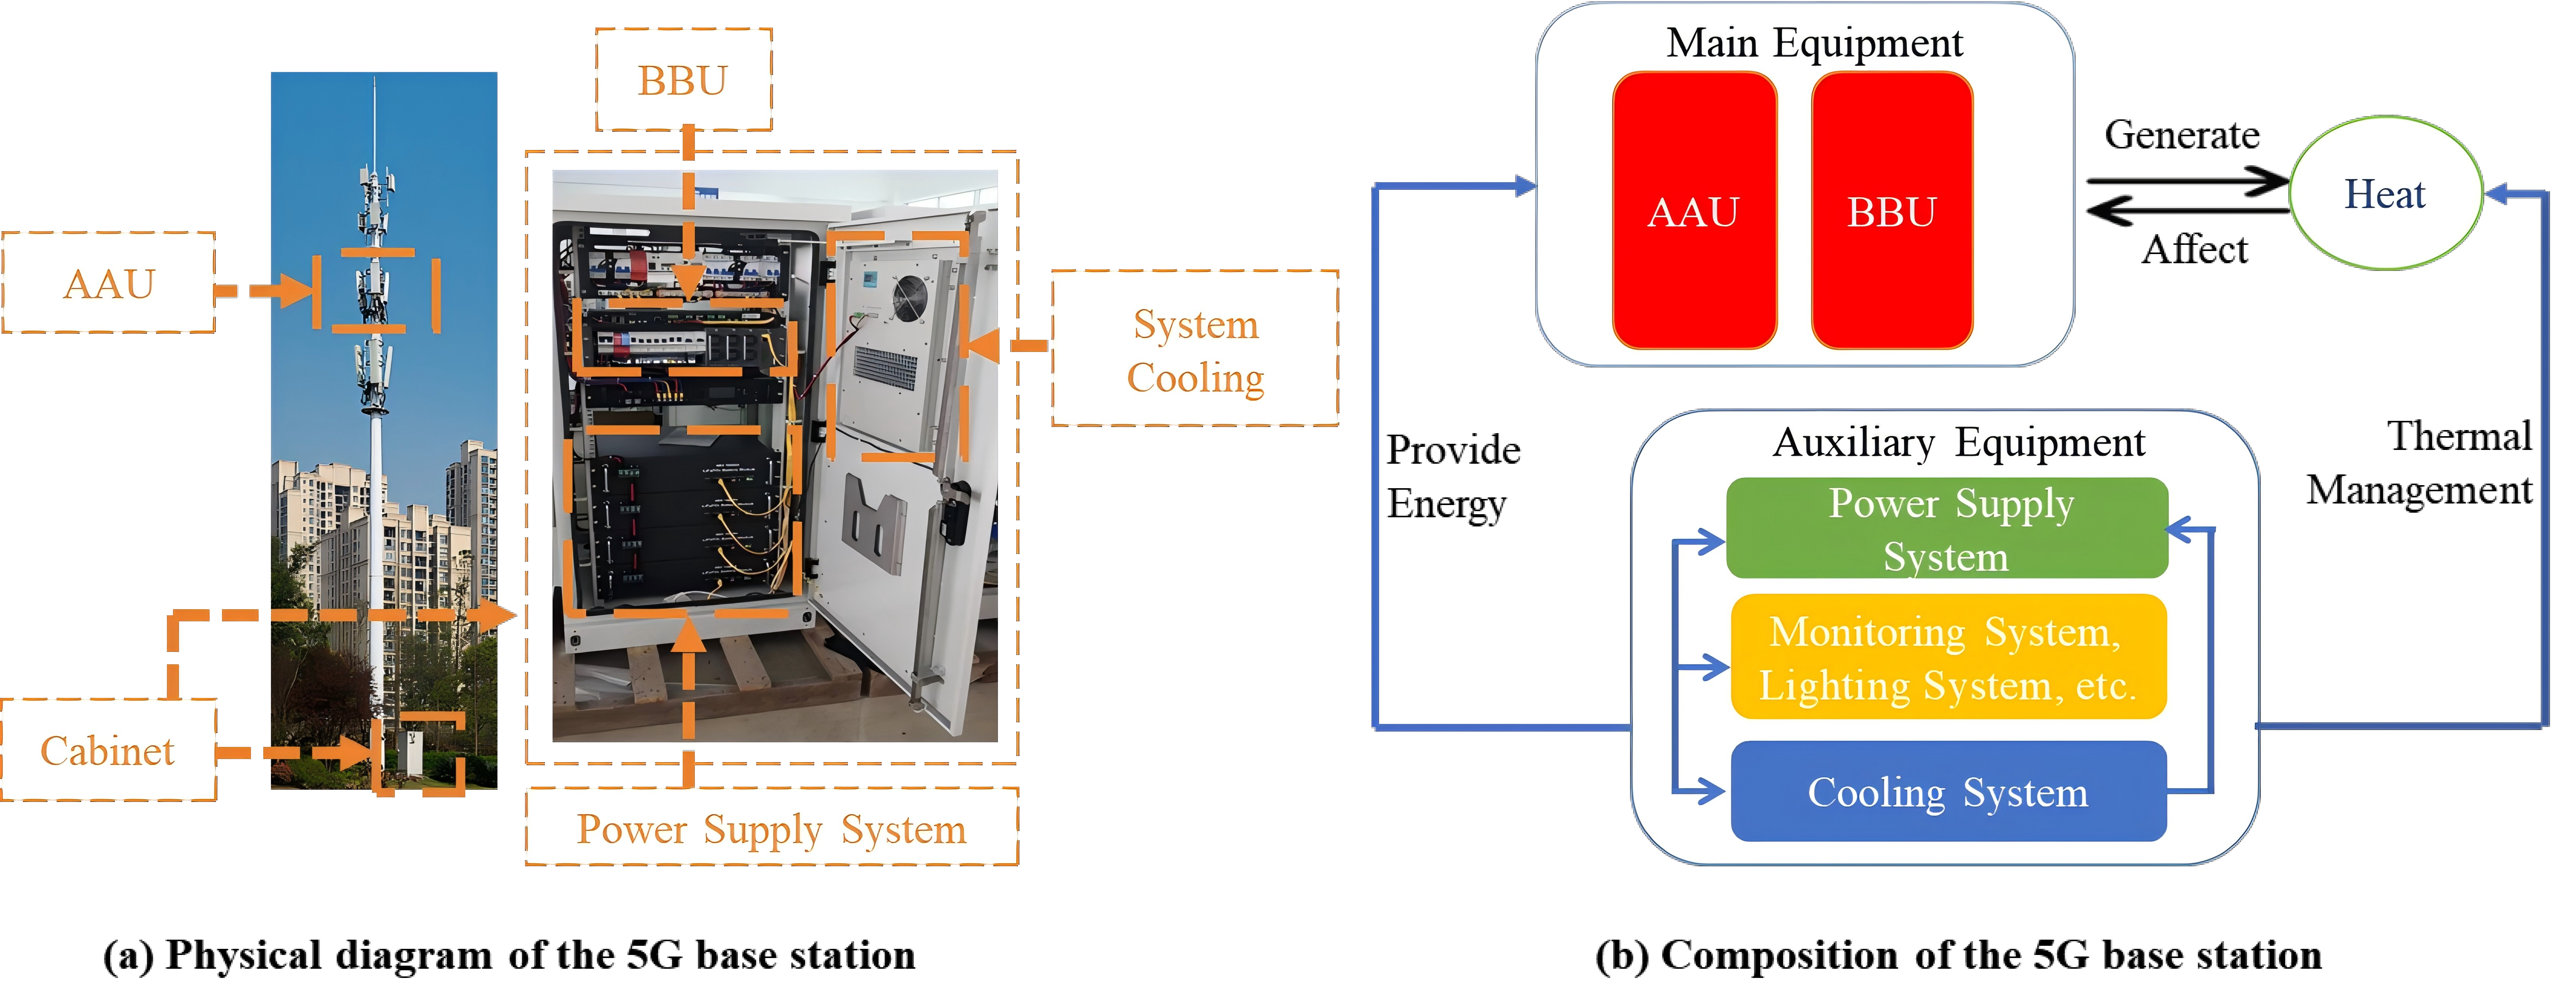
Understanding the structural composition of 5G base stations is essential for analyzing their load characteristics and energy consumption patterns. The typical components of a 5G base station are illustrated in Figure 1. The core equipment typically comprises a baseband unit (BBU), which performs baseband signal processing, and multiple active antenna units (AAUs), which integrate radio-frequency processing and antenna functions[13]. Supporting subsystems include power-supply equipment and cooling systems that maintain suitable operating temperatures[14]. Cooling-system electricity consumption varies with equipment thermal conditions and cooling-system operation[15,16]. Reported equipment-level power data for a representative 5G base-station configuration comprising one BBU and three AAUs indicate an idle main-equipment load of approximately 2.2 kW and a full-load demand of approximately 3.7 kW. The idle load therefore accounts for approximately 60% of the full-load demand, while the load-dependent component is primarily associated with changes in AAU power consumption under varying traffic conditions[13]. This high static-to-dynamic ratio indicates that traffic management alone may have limited potential to reduce total electricity consumption because substantial baseline demand remains even under low-traffic conditions. Therefore, demand response from base stations often relies on backup battery systems, as complete load curtailment would compromise network continuity[17]. Operational energy savings may also be achieved through traffic-aware multi-state sleep modes[18].
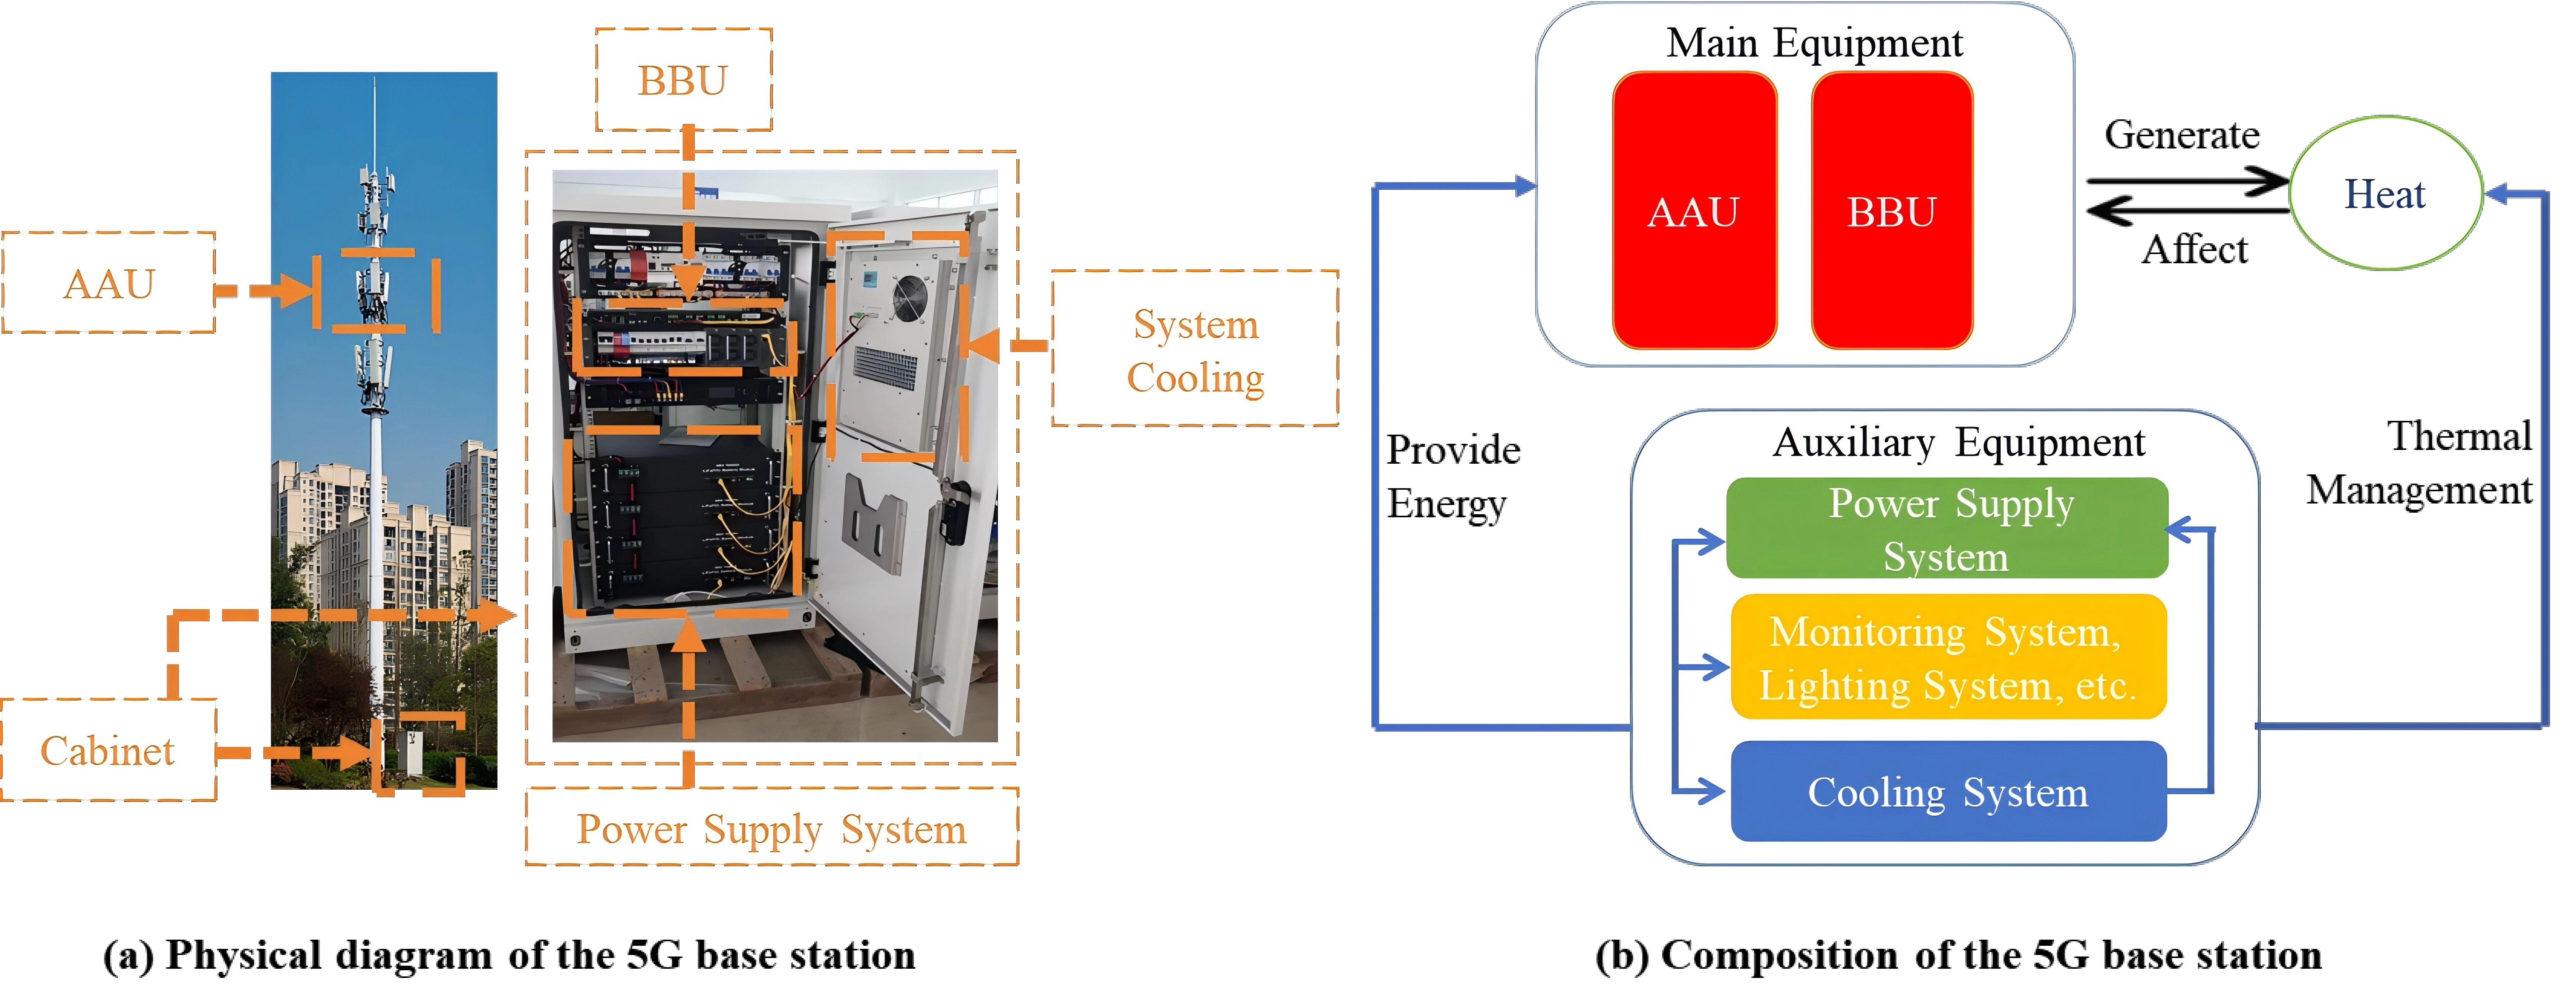
Figure 1. Diagram of the 5G base station and energy exchange between each component. BBU: baseband unit; AAU: active antenna unit.
These physical characteristics create distinct load behaviors with direct implications for urban power system planning. Because cooling-system operation responds to ambient temperature and equipment thermal conditions, cooling-related electricity demand can vary across daily and seasonal temperature conditions[19]. Beyond thermal effects, temporal variations in base-station electricity demand are associated with communication traffic and radio-resource utilization[20,21]. Spatial heterogeneity may also be related to population distribution, base-station density, and communication-traffic demand across urban, suburban, and rural contexts[22]. These spatial load characteristics are closely related to base-station deployment patterns[4]. Studies conducted in different national contexts suggest that 5G deployment patterns may be influenced by user-demand density, regional economic development, and infrastructure costs[23,24]. In rapidly urbanizing regions, the concentration of these loads may affect distribution network capacity, voltage regulation, and load-forecasting accuracy[11]. However, previous studies on load characteristics either focus on individual base stations or are conducted on local networks, lacking comprehensive analysis of energy consumption characteristics at regional or national scales and limiting their scope and generalizability for grid integration planning. Williams et al.[5] highlighted this critical limitation, emphasizing the need for openly accessible, vetted, and transparent assessments of entire networks rather than isolated components or limited network segments to enable meaningful urban grid integration analysis and regional energy planning.
Specifically, several critical aspects of regional-scale 5G base station characteristics require further investigation:
• The real-world load pattern characteristics of 5G base stations remain unclear, particularly at the regional scale. While existing studies focus on individual stations, a comprehensive understanding of large-scale load behavior patterns and spatiotemporal distribution across regional deployments remains limited.
• The influencing factors on 5G base station load variations remain largely unidentified and unquantified. Although load patterns are complex, the influence of geographical distribution, temporal variation, and operational conditions on load characteristics is poorly understood, limiting predictive capabilities and energy management strategies.
• The impact of 5G base station loads on urban power grid systems remains unknown and uncharacterized. With the rapid expansion of this infrastructure, implications for grid stability remain unclear. Although the unique load characteristics differ significantly from traditional infrastructure, their integration effects remain largely unexplored.
Therefore, studying the load characteristics of 5G base stations at the regional level through large-scale, real-world data analysis is essential to optimize urban energy system allocation and improve the urban environment. This paper presents a comprehensive analysis of the load characteristics of 5G base stations at the regional level from spatial and temporal perspectives. The spatial analysis considers population density and geographical deployment characteristics. The temporal and operational analyses cover monthly, weekly, and daily load profiles in winter and summer and evaluate capacity utilization, peak-valley load characteristics, grid synchronization, and temperature sensitivity. These results provide large-scale, province-level real-world evidence on 5G base-station load characteristics, complementing previous findings from individual base stations or limited networks. The remainder of this paper is organized as follows. The methods and analytical procedures are introduced in Section 2. The data are presented in Section 3. Detailed analyses and results are presented in Section 4, followed by the Discussion in Section 5 and the Conclusions in Section 6.
2. Load Characteristics Analysis Method
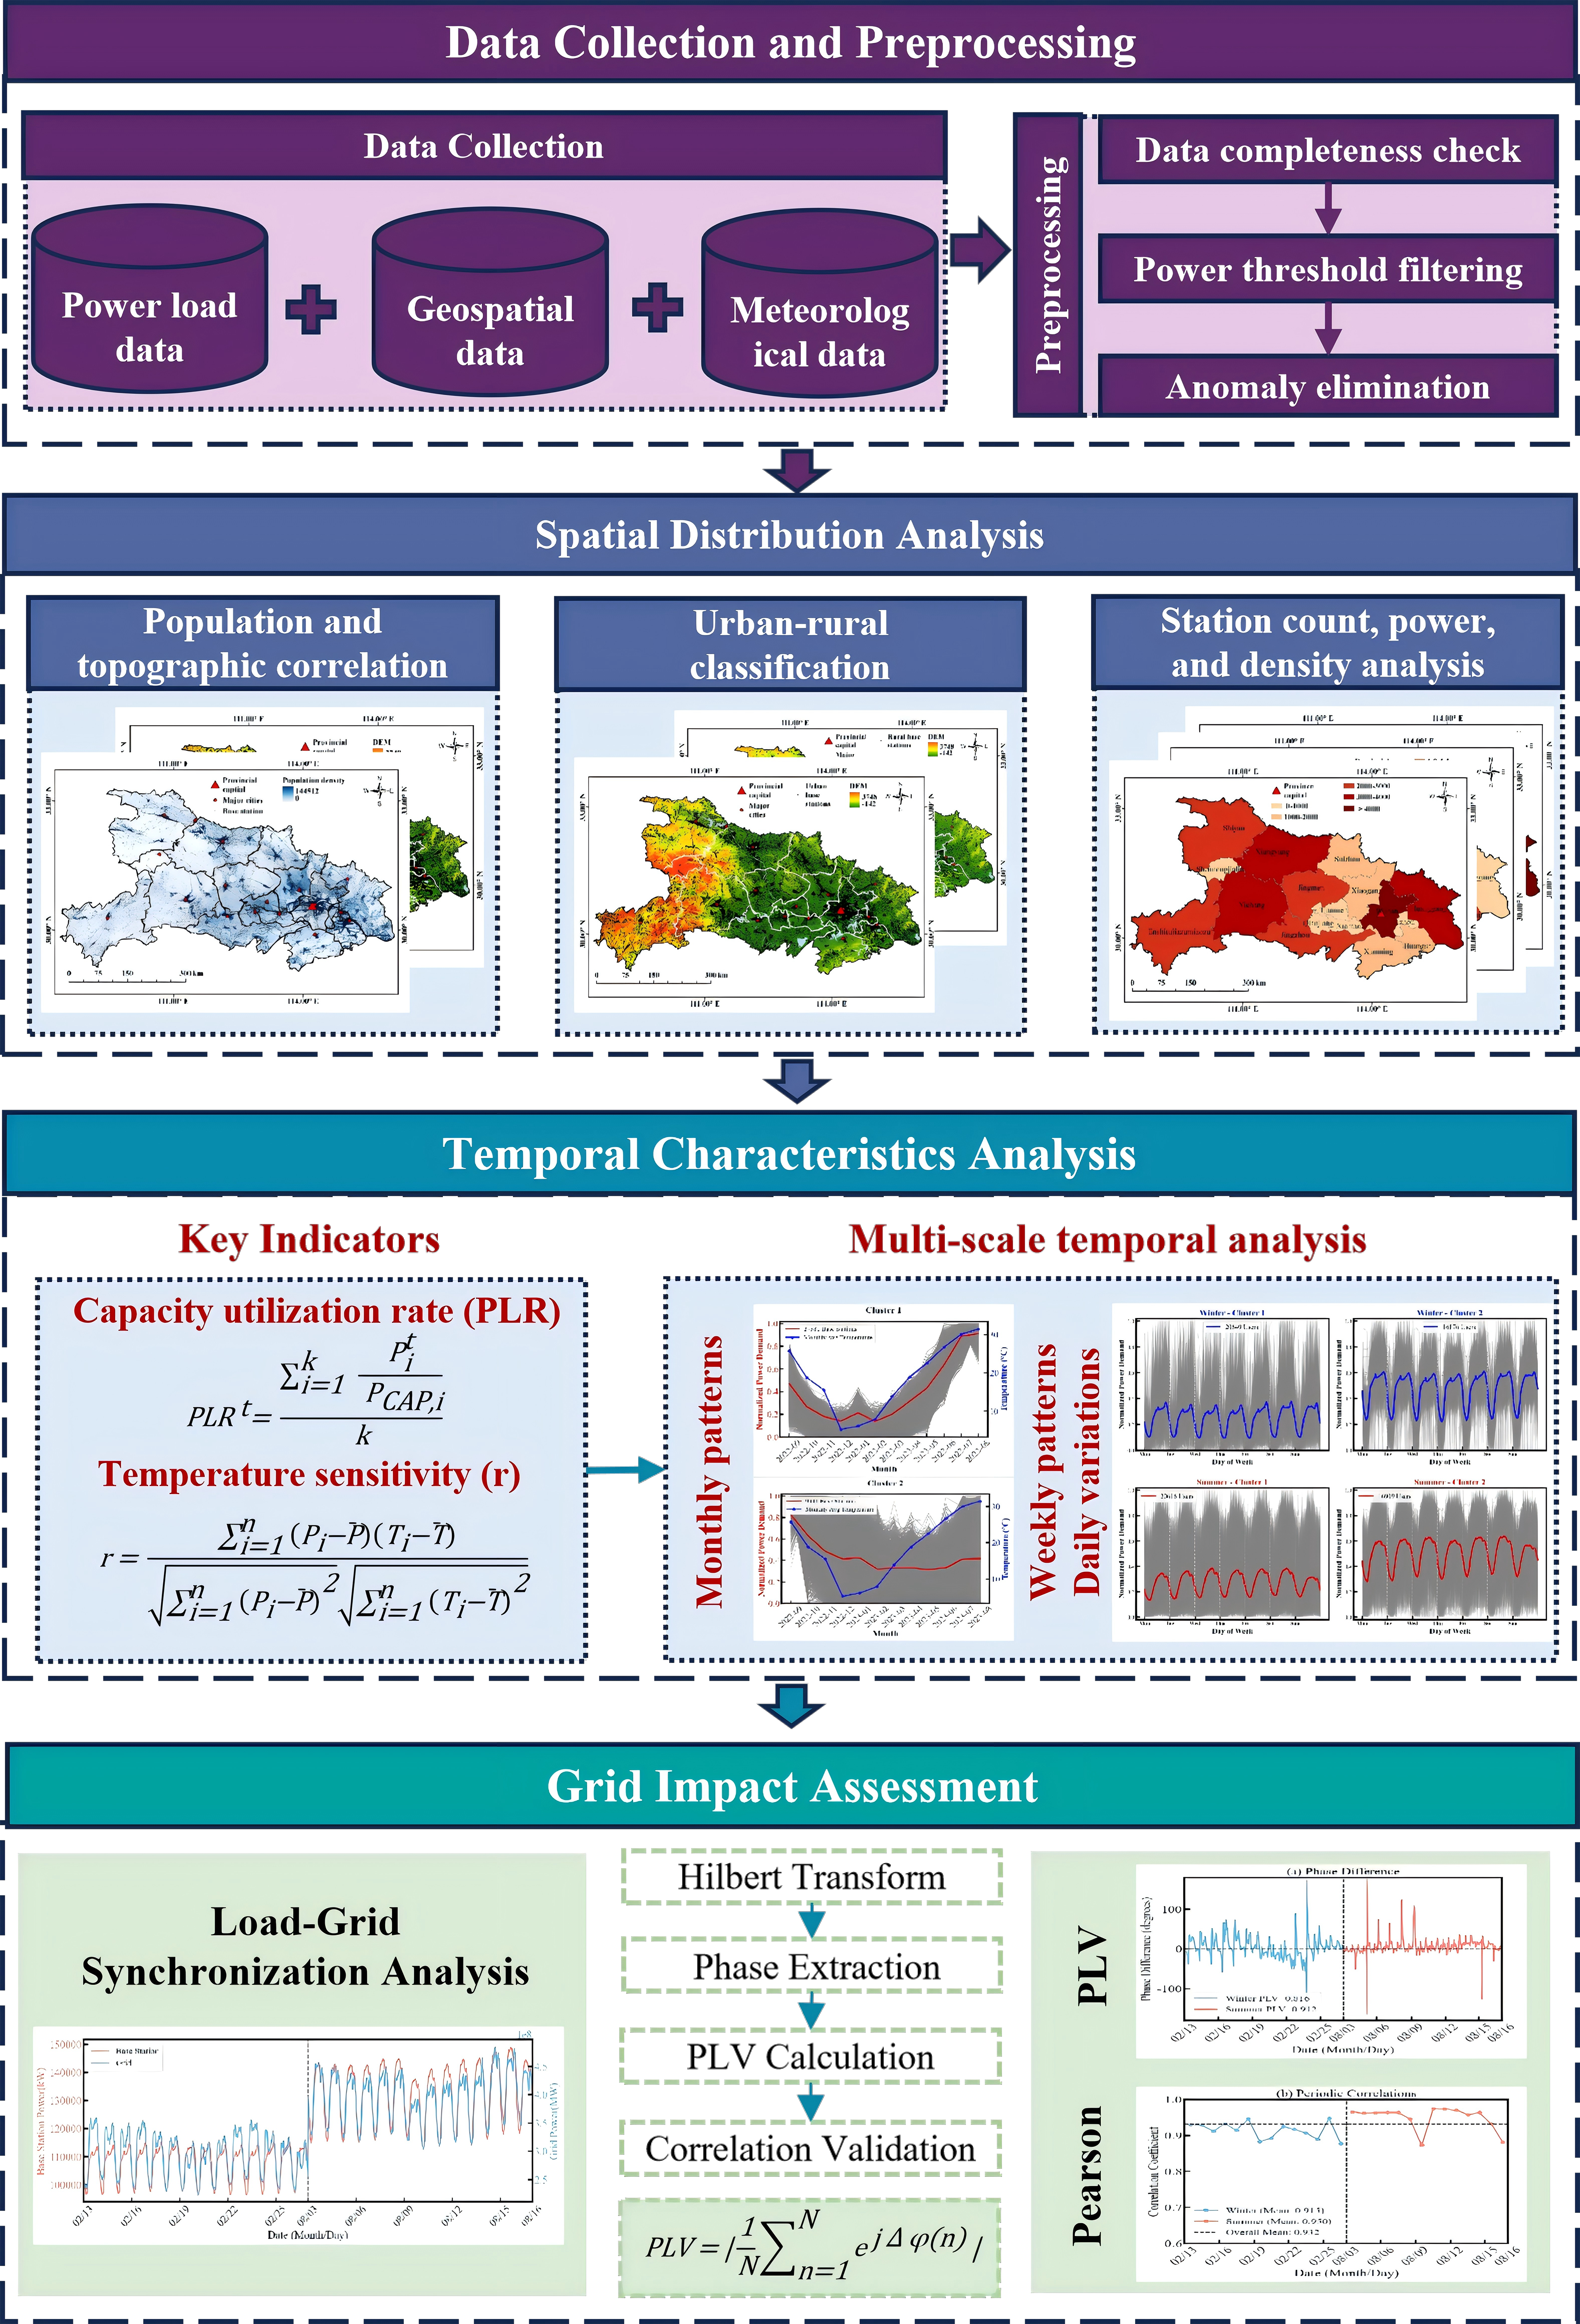
This study establishes a systematic analytical framework to investigate the load characteristics of 5G base stations at the regional scale, as shown in Figure 2. It comprises four interconnected components: data collection and preprocessing, spatial distribution analysis, temporal characteristics analysis, and urban grid impact assessment.
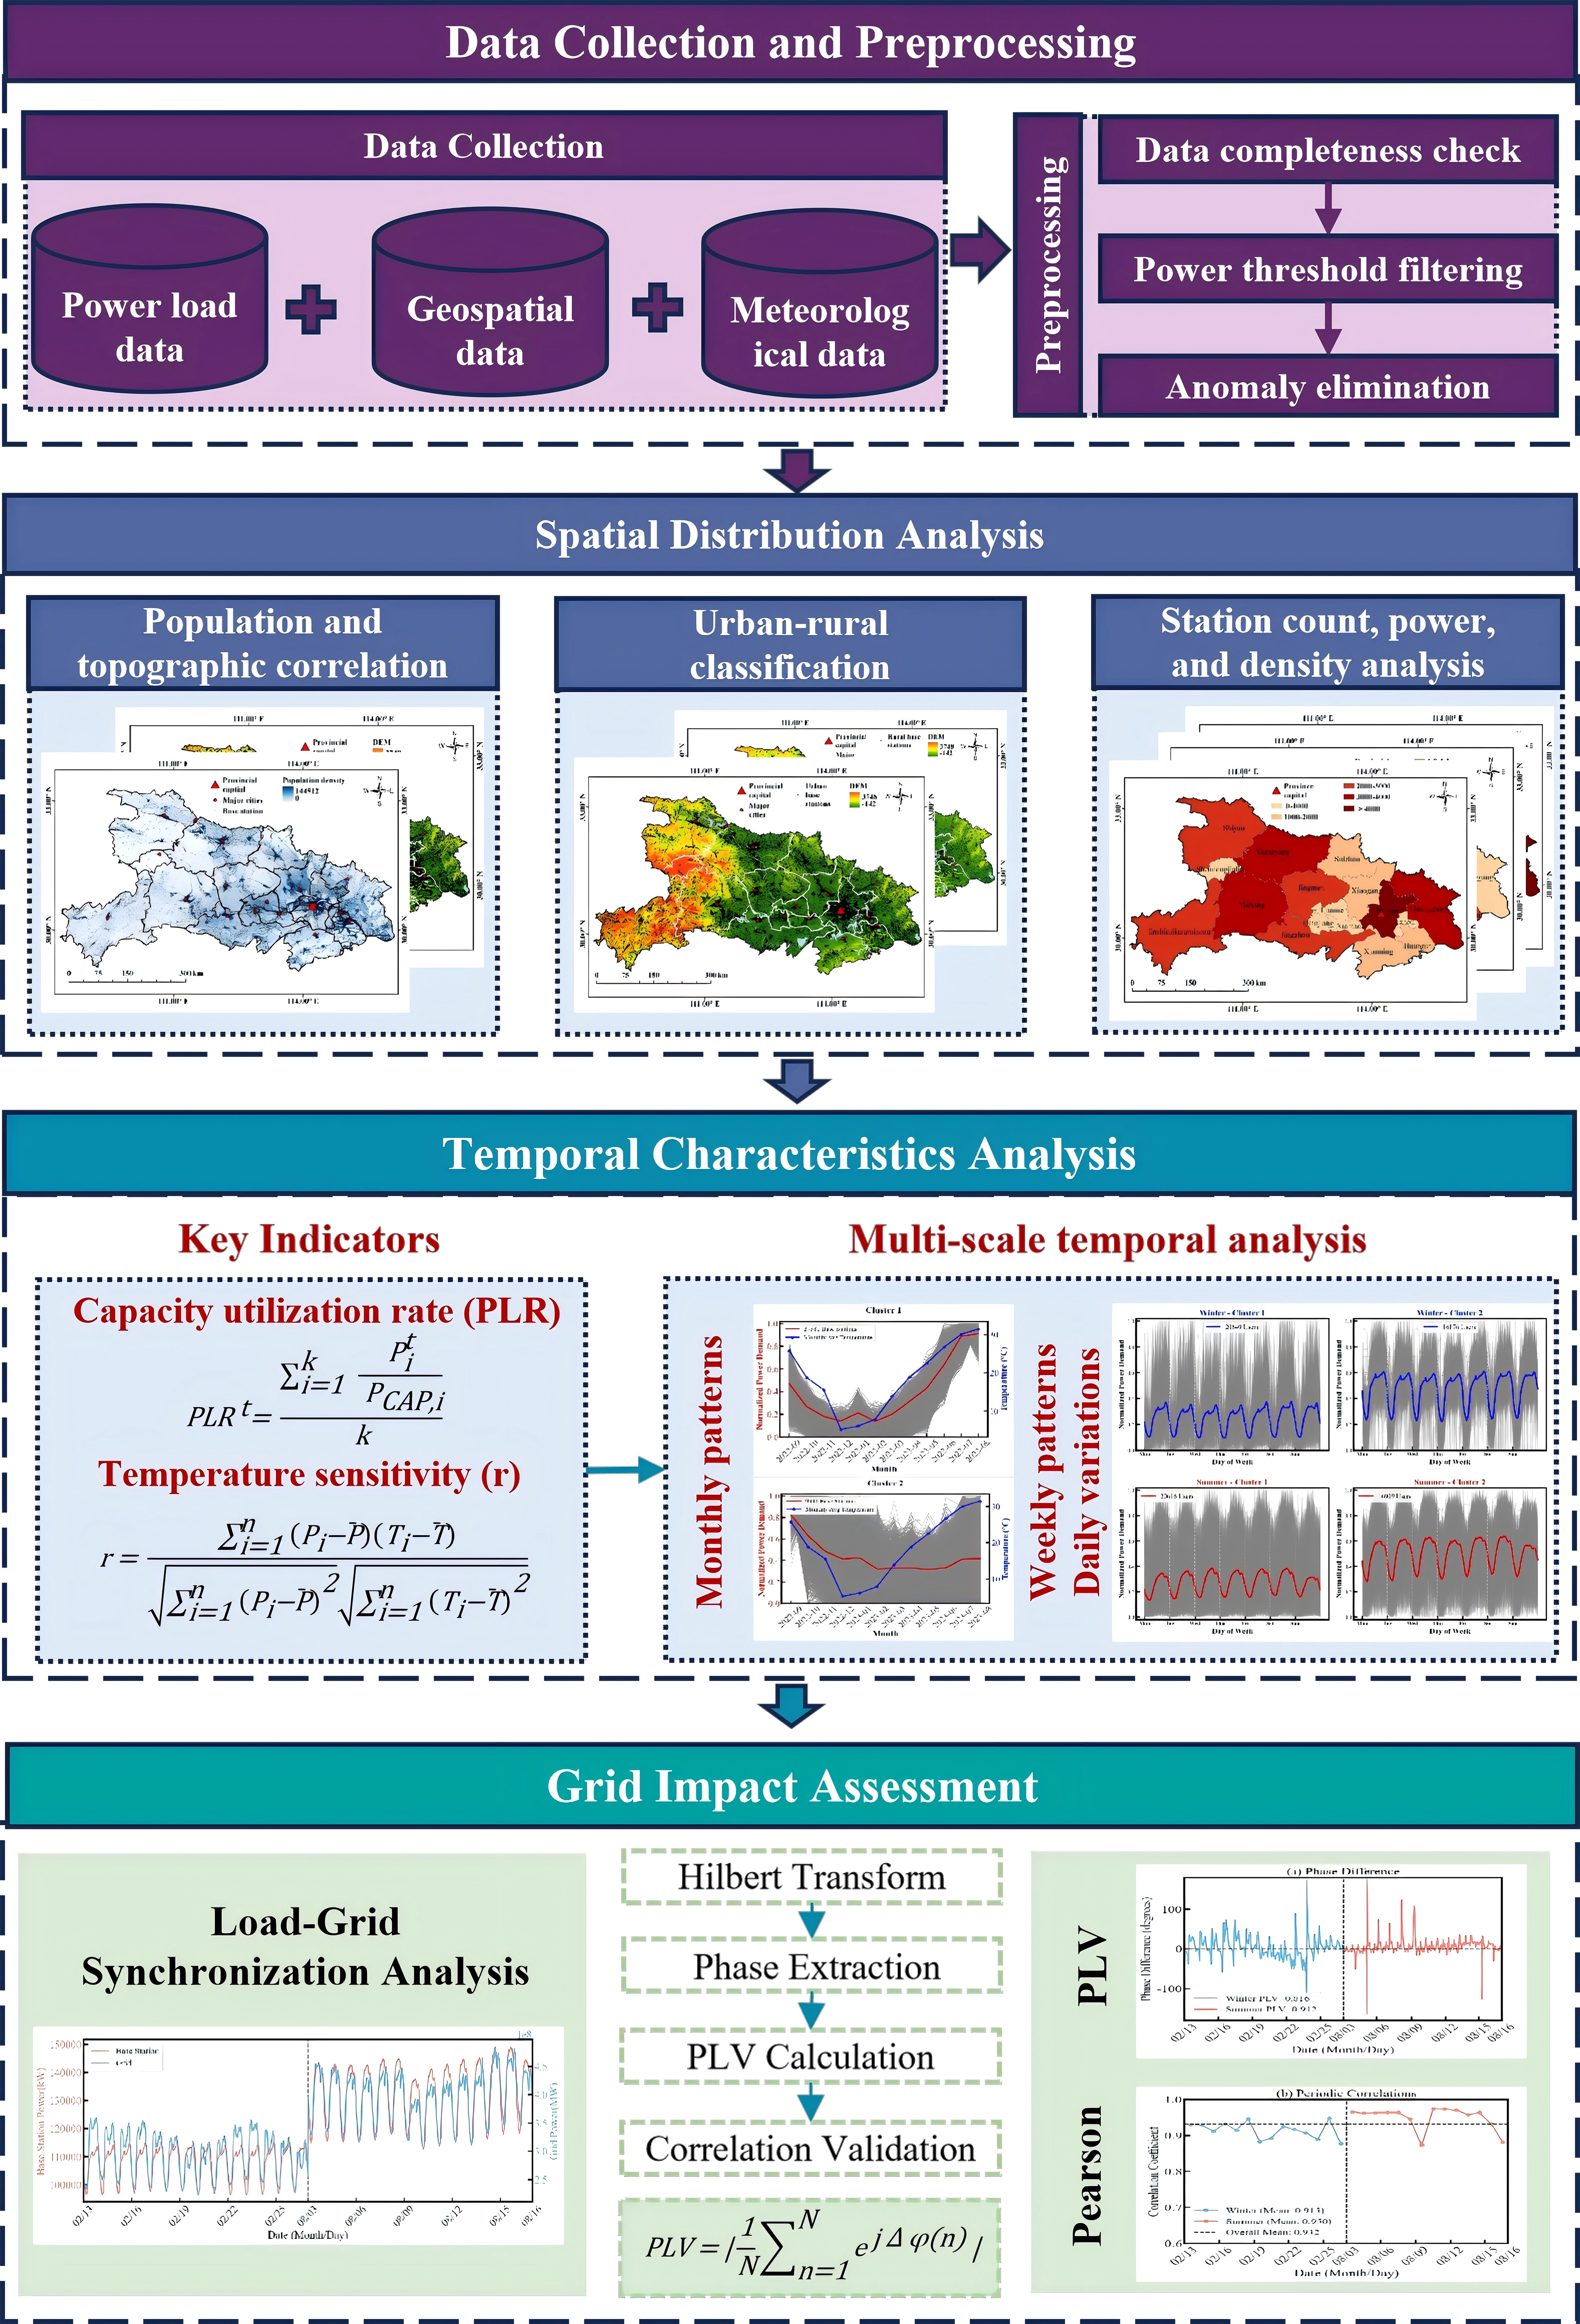
Figure 2. Multi-dimensional research framework for 5G base station load characteristics analysis. PLV: phase locking value; PLR: part load ratio.
(1) Data collection and preprocessing
The research establishes a reliable empirical foundation through systematic data collection and quality control. Operational data are collected at high temporal resolution and accompanied by geospatial and meteorological data. Raw data undergo multi-stage preprocessing to ensure completeness and reliability. First, base stations with incomplete weekly data coverage are removed to ensure continuous time-series analysis. Second, a minimum power consumption threshold based on typical 5G operational characteristics is applied to identify and exclude inactive or malfunctioning installations. Third, base stations with excessive missing data points within individual days are eliminated to maintain temporal continuity. The specific screening criteria and the number of retained base stations are reported in Section 3. These procedures were applied to improve data completeness and restrict the analysis to stations with records consistent with normal active operation.
(2) Spatial characteristics
Spatial distribution characteristics are analyzed through geographic information system (GIS) integration and statistical correlation methods. First, spatial overlay analysis integrates base station locations with population density and digital elevation model (DEM) data to examine relationships between infrastructure deployment and demographic and topographic factors. Second, base stations are classified as urban or rural by matching geographic coordinates to administrative boundaries to quantify deployment disparities across regional contexts. Third, statistical correlation analysis employs the Pearson correlation coefficient to quantify the association between base station density and population density at the municipal level. Finally, power density (kW/km2) is calculated for each municipality to characterize the spatial distribution of electrical load intensity across the urban fabric.
(3) Temporal characteristics
Temporal characteristics are examined through multi-scale analysis and operational performance metrics. Multi-scale temporal analysis investigates load variations across monthly, weekly, and daily time scales, with clustering applied to identify distinct data-driven load patterns. Capacity utilization rate [part load ratio (PLR)] is calculated as the ratio of actual consumption to installed capacity to quantify infrastructure efficiency and deployment redundancy. Temperature sensitivity analysis evaluates correlation patterns between base station power consumption and ambient temperature using Pearson correlation coefficients, examining both individual station responses and aggregate network-level relationships to characterize seasonal and thermal dependencies.
The following indicators are employed for temporal characteristics analysis:
PLR: The PLR quantifies the utilization of the installed capacity. For a specific time t, the PLR is calculated according to Eq. (1), where, PLRt represents the operational capacity utilization rate at time t;
For monthly average utilization rates, the calculation is extended to include all time steps within the month, as shown in Eq. (2), where, PLRm represents the monthly average capacity utilization rate and n is the number of valid time steps in month m.
Temperature sensitivity: Temperature sensitivity was evaluated using the Pearson correlation coefficient to characterize the contemporaneous linear association between base-station power consumption and ambient temperature, as shown in Eq. (3). At the individual base-station level, Pi is the power consumption of a base station at the i-th 15-minute observation,
(4) Impacts on the grid
Grid impact assessment examines the interactions between base station loads and urban power system operations through three complementary analyses. First, load synchronization analysis quantifies temporal alignment between base station and urban grid loads using phase locking value (PLV) and the Pearson correlation coefficient, where instantaneous phases are extracted via the Hilbert transform to measure phase coherence. Second, time-of-use tariff alignment evaluation overlays base station load profiles with regional electricity pricing periods (peak, flat, and valley) to assess the coincidence between consumption peaks and high-price periods. Third, peak-valley characteristic analysis calculates load ratios across pricing periods. It applies K-means clustering to identify distinct consumption-pattern groups among base stations, revealing operational heterogeneity relevant to demand response potential.
The following indicators are employed for grid impact assessment:
PLV: The PLV quantifies the degree of synchronization between base-station and grid loads. Before applying the Hilbert transform, the base-station and grid load series were standardized separately for each season by subtracting their respective means and dividing by their standard deviations. To assess the sensitivity of the PLV results to signal non-stationarity, the PLV was also recalculated after (i) linear detrending and (ii) zero-phase high-pass filtering. For the latter, a fourth-order Butterworth high-pass filter with a cutoff period of 48 h was used to remove slow baseline variations while retaining the dominant 24 h load cycle. Zero-phase filtering was applied to avoid introducing artificial phase shifts. The instantaneous phase of each signal was then obtained through the Hilbert transform, as shown in Eqs. (4) and (5).
Peak and off-peak load characteristics: The original 15-minute power data were first aggregated into hourly mean power values, yielding 24 observations for each day. The load factor for each tariff period was then calculated as the sum of the hourly mean power values within that period divided by the sum of all 24 hourly mean power values, as shown in Eq. (6), where LFperiod represents the load factor for the specified tariff period (peak, flat, or valley), Pt is the hourly mean power at hour t and t ∈ denotes the hours included in the corresponding tariff period.
3. Information on 5G Base Stations at the Regional Level
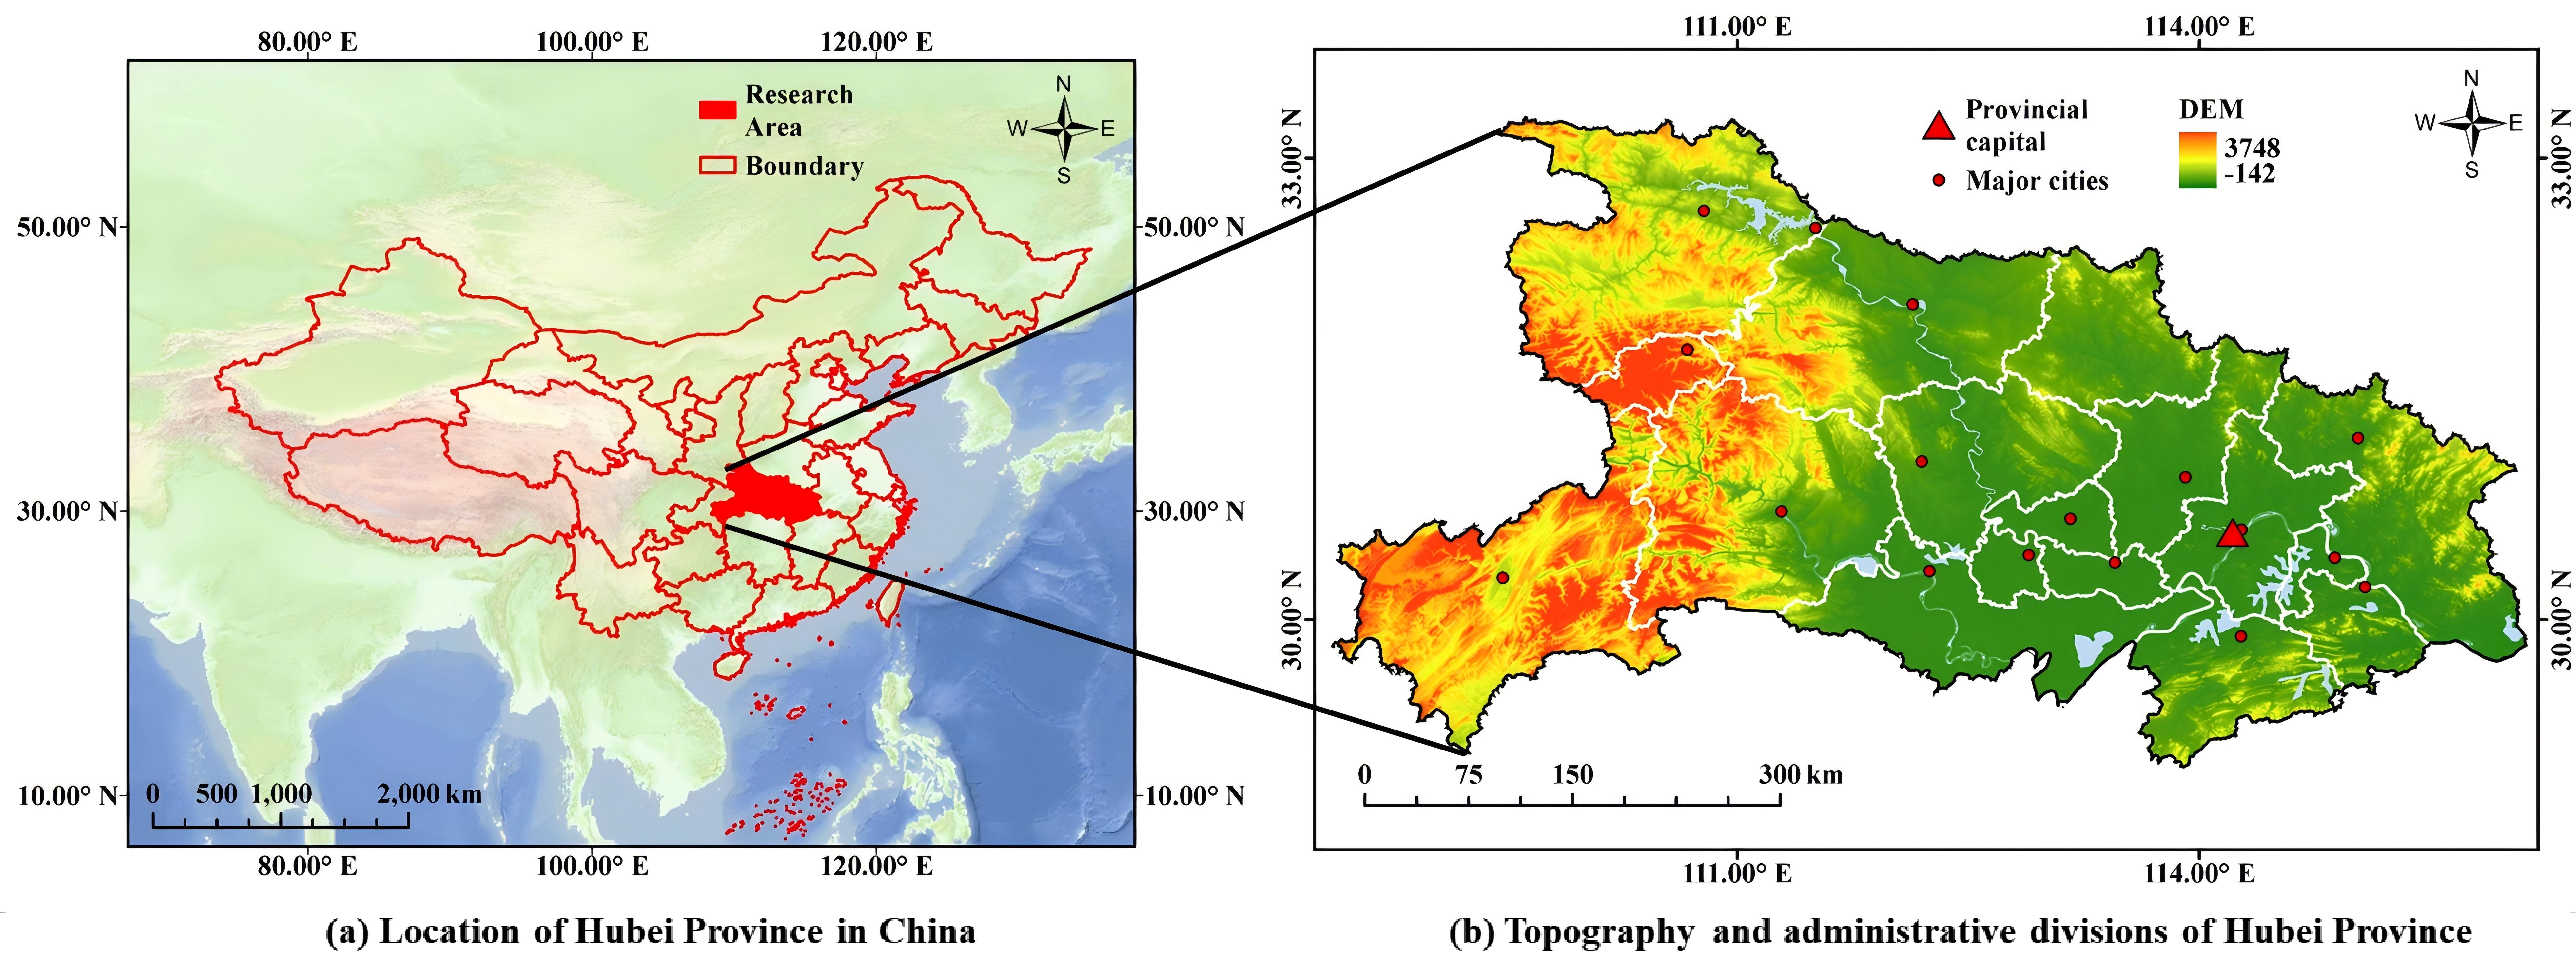
This study focuses on Hubei Province, located in central China (108°21′-116°07′E, 29°01′-33°06′N), as shown in Figure 3. Hubei Province covers approximately 185,900 km2 and has a population of over 58 million. The province has diverse topography, with elevations ranging from -142 m to 3,748 m above sea level. The terrain is predominantly mountainous in the western and northwestern regions, while plains and lowlands characterize the central and eastern areas. Population distribution is highly uneven, with dense concentrations in the central and eastern plains, particularly in the provincial capital, Wuhan, and other major cities. Meanwhile, the mountainous western and northwestern regions remain sparsely populated.
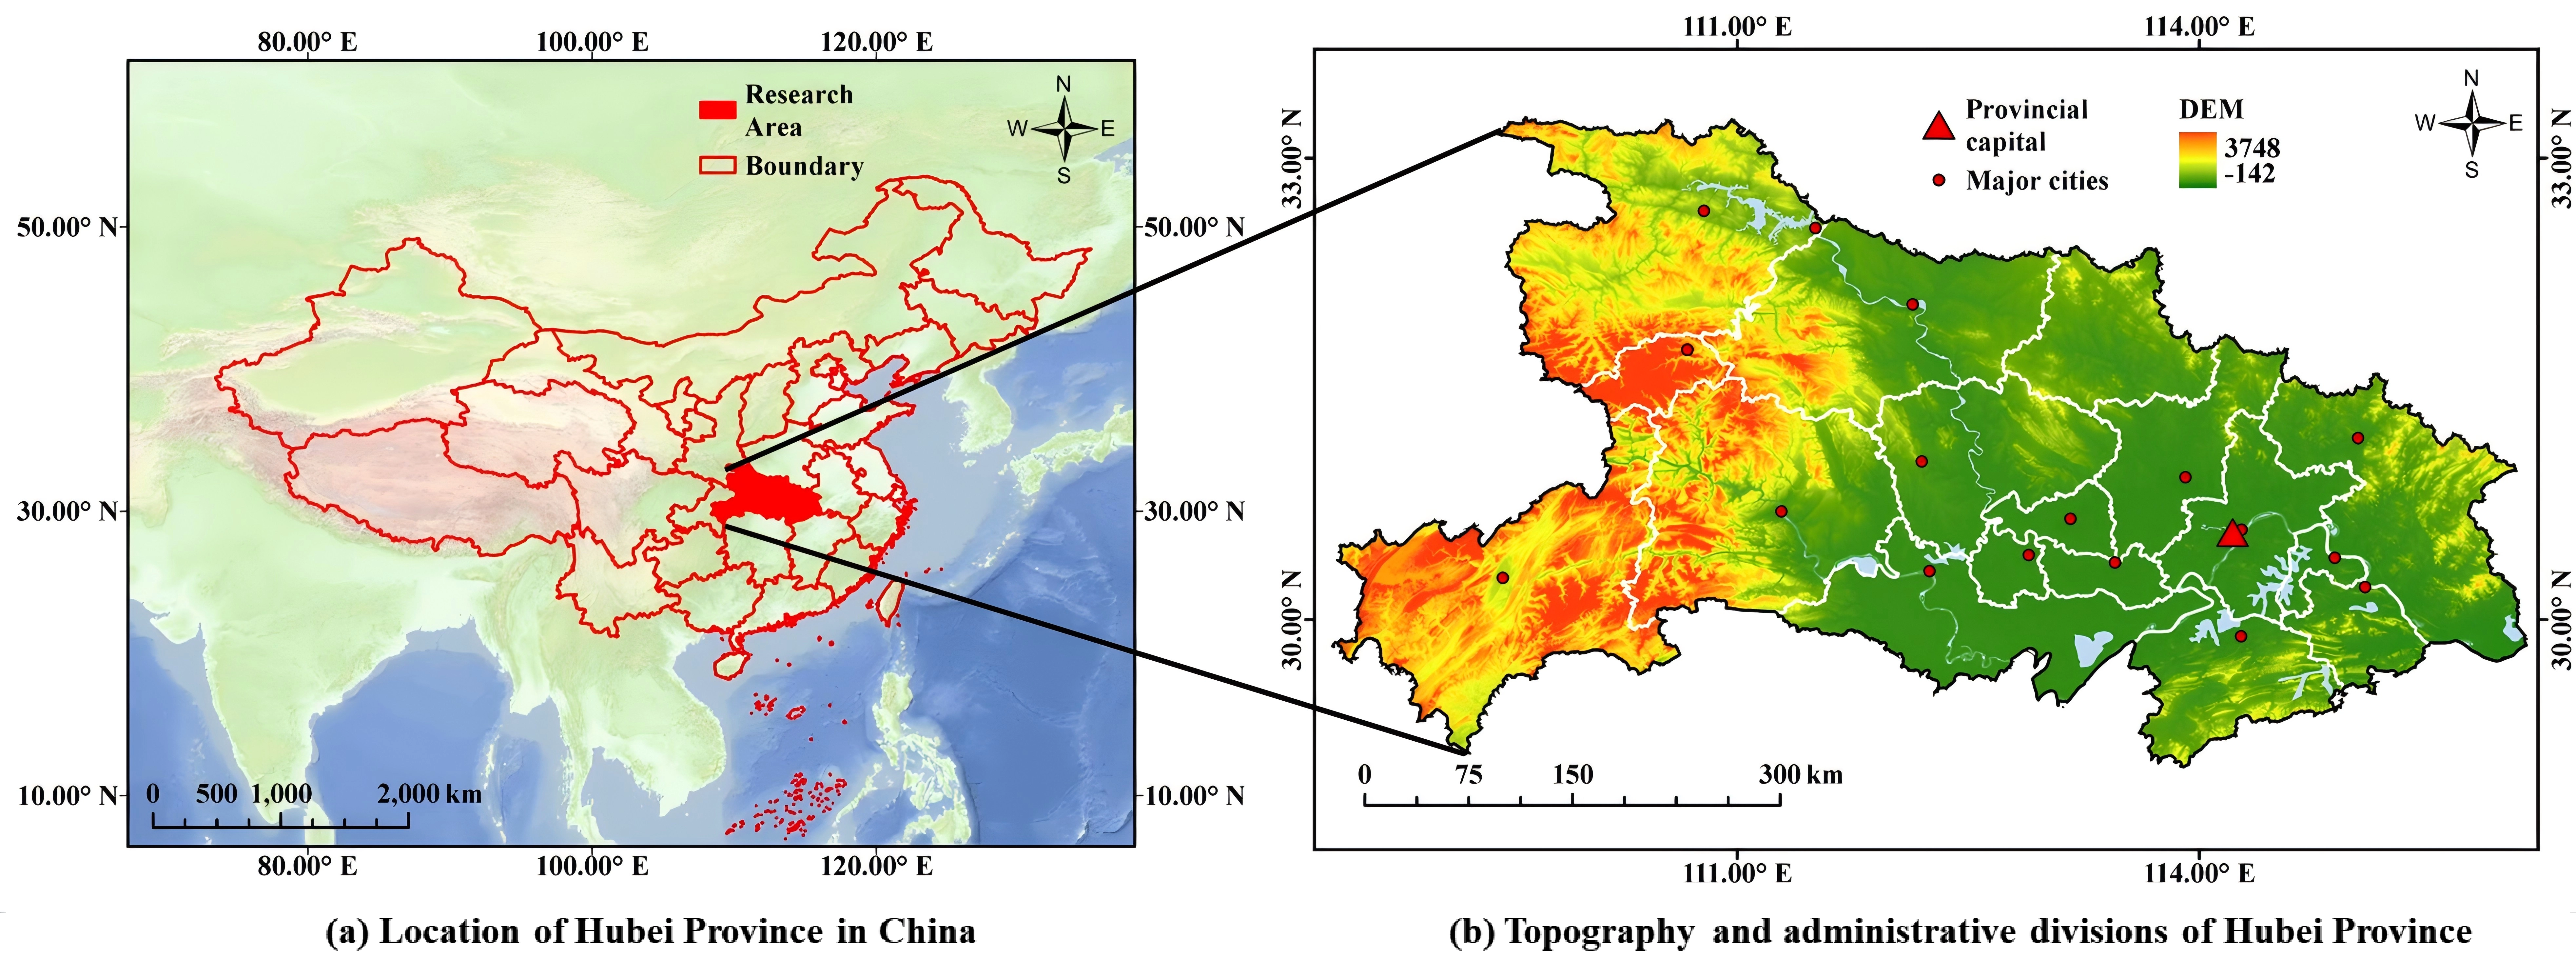
Figure 3. Geographic location and topography of Hubei Province. DEM: digital elevation model.
To investigate the load characteristics of 5G base stations, comprehensive datasets were collected from multiple sources, as summarized in Table 1. The primary dataset comprises historical energy data from 73,400 5G base stations in Hubei Province, including 15-minute-resolution power data collected during a 14-day winter period (February 13-26, 2023) and a 14-day summer period (August 3-16, 2023), monthly cumulative energy consumption from September 2022 to August 2023, and base station attributes such as geographic coordinates, voltage levels, and operating capacities. Provincial urban grid load data with the same temporal resolution were obtained to assess the interaction between base station loads and the broader urban power system. Additionally, geospatial datasets, including DEM data at 30 m resolution and population density data at 1 km resolution, were integrated to analyze spatial distribution patterns of base station deployment.
Table 1. Summary of data sources.
| Category | Data | Resolution | Period | Source |
| Power load data | 5G base station load data | 15-minute | February 13-26, 2023 (winter); August 3-16, 2023 (summer) | Regional grid operator |
| Provincial grid load data | 15-minute | Feb 13-26, 2023 (winter); Aug 3-16, 2023 (summer) | Regional grid operator | |
| Monthly energy consumption | Monthly | September 2022-August 2023 | Regional grid operator | |
| Geospatial data | Base station geographic coordinates | Point data (lat/lon) | 2023 | Regional grid operator |
| DEM | 30 m | 2023 | Geospatial Data Cloud (https://www.gscloud.cn/) | |
| Population density | 1 km | 2023 | LandScan Global products (https://landscan.ornl.gov/) | |
| Administrative-boundary data | Vector data | N/A | Tianditu Administrative Division Data (https://cloudcenter.tianditu.gov.cn/dataSource) | |
| Meteorological data | Temperature data | 15-minute | February 13-26, 2023 (winter); August 3-16, 2023 (summer) | National Meteorological Science Data Centre |
DEM: digital elevation model.
The original data contain missing and abnormal values due to data transmission and human entry errors. To obtain high-quality data for analysis, the following screening principles were applied:
• Completeness criterion: Base stations with incomplete weekly data (fewer than seven complete days) were excluded to ensure temporal continuity.
• Power threshold criterion: Reported equipment-level power data for a representative 5G base-station configuration comprising one BBU and three AAUs indicate an idle main-equipment load of approximately 2.2 kW[13,15]. Because normal operation may involve additional power demand associated with traffic variations and summer cooling, 2 kW, slightly below the reported idle value, was adopted as a conservative screening threshold for maximum summer power. Stations failing to meet this threshold were excluded because they were likely inactive or malfunctioning.
• Data availability criterion: Base stations with excessive missing data points (more than 24 null values out of 96 time points in daily profiles, or more than 6 null values out of 12 months in monthly data) were removed.
Following these screening procedures, 37,525 base stations were retained for the final analysis, providing a large province-wide dataset for investigating the spatiotemporal load characteristics of 5G infrastructure and its interactions with the regional power grid.
4. Results and Analysis
4.1 Spatial distribution of 5G base stations
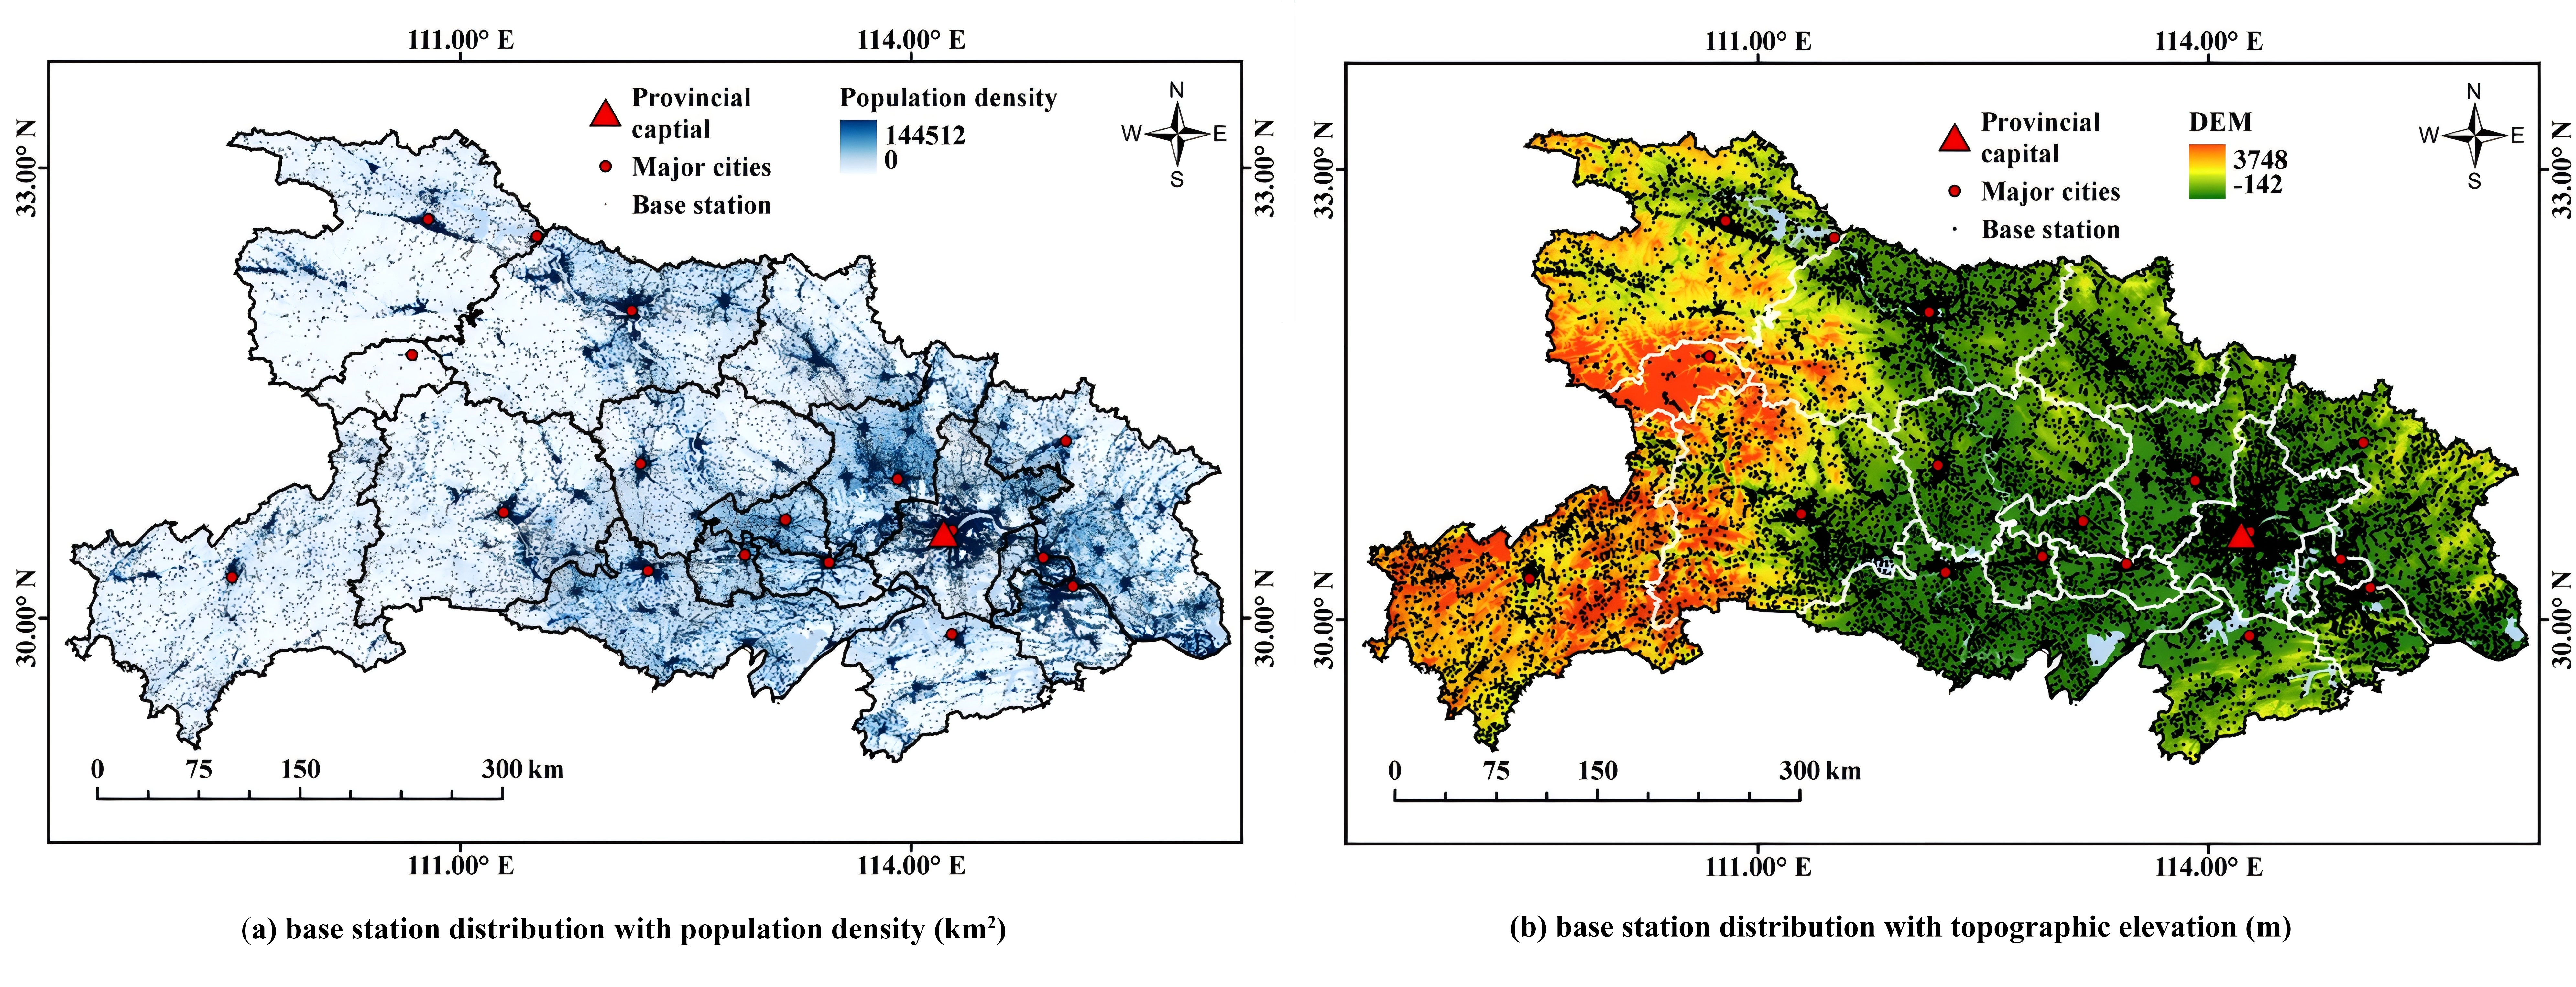
The spatial distribution of 5G base stations across Hubei Province exhibits strong correlation with population density and topographic features. As illustrated in Figure 4a, the 37,525 analyzed base stations display pronounced spatial heterogeneity, with dense clustering in the central and eastern regions where population concentrations are highest. The provincial capital, Wuhan, and other major cities show the highest deployment intensity, with base stations forming concentrated clusters around each urban center. This multi-nodal distribution pattern reveals that base station deployment closely tracks the province’s polycentric urban system, with higher station density observed in areas of elevated population concentration. The overlay with topographic data in Figure 4b reveals that northwestern and southwestern mountainous regions, characterized by elevations exceeding 2,000 m, exhibit markedly sparse base station coverage. The dual-layer analysis demonstrates that base station deployment prioritizes population distribution over uniform geographic coverage, with installations predominantly concentrated in urban valleys, plains, and densely populated areas where both population density and terrain accessibility are favorable. Conversely, high-elevation mountainous areas with complex terrain, despite covering approximately 56% of the provincial land area, accommodate less than 10% of the total base station infrastructure. This spatial alignment provides empirical evidence confirming that telecommunications infrastructure development in Hubei Province is fundamentally driven by demographic factors and constrained by topographic conditions, resulting in an efficiency-oriented deployment strategy that prioritizes high-demand, accessible urban areas while maintaining minimal presence in challenging terrain.
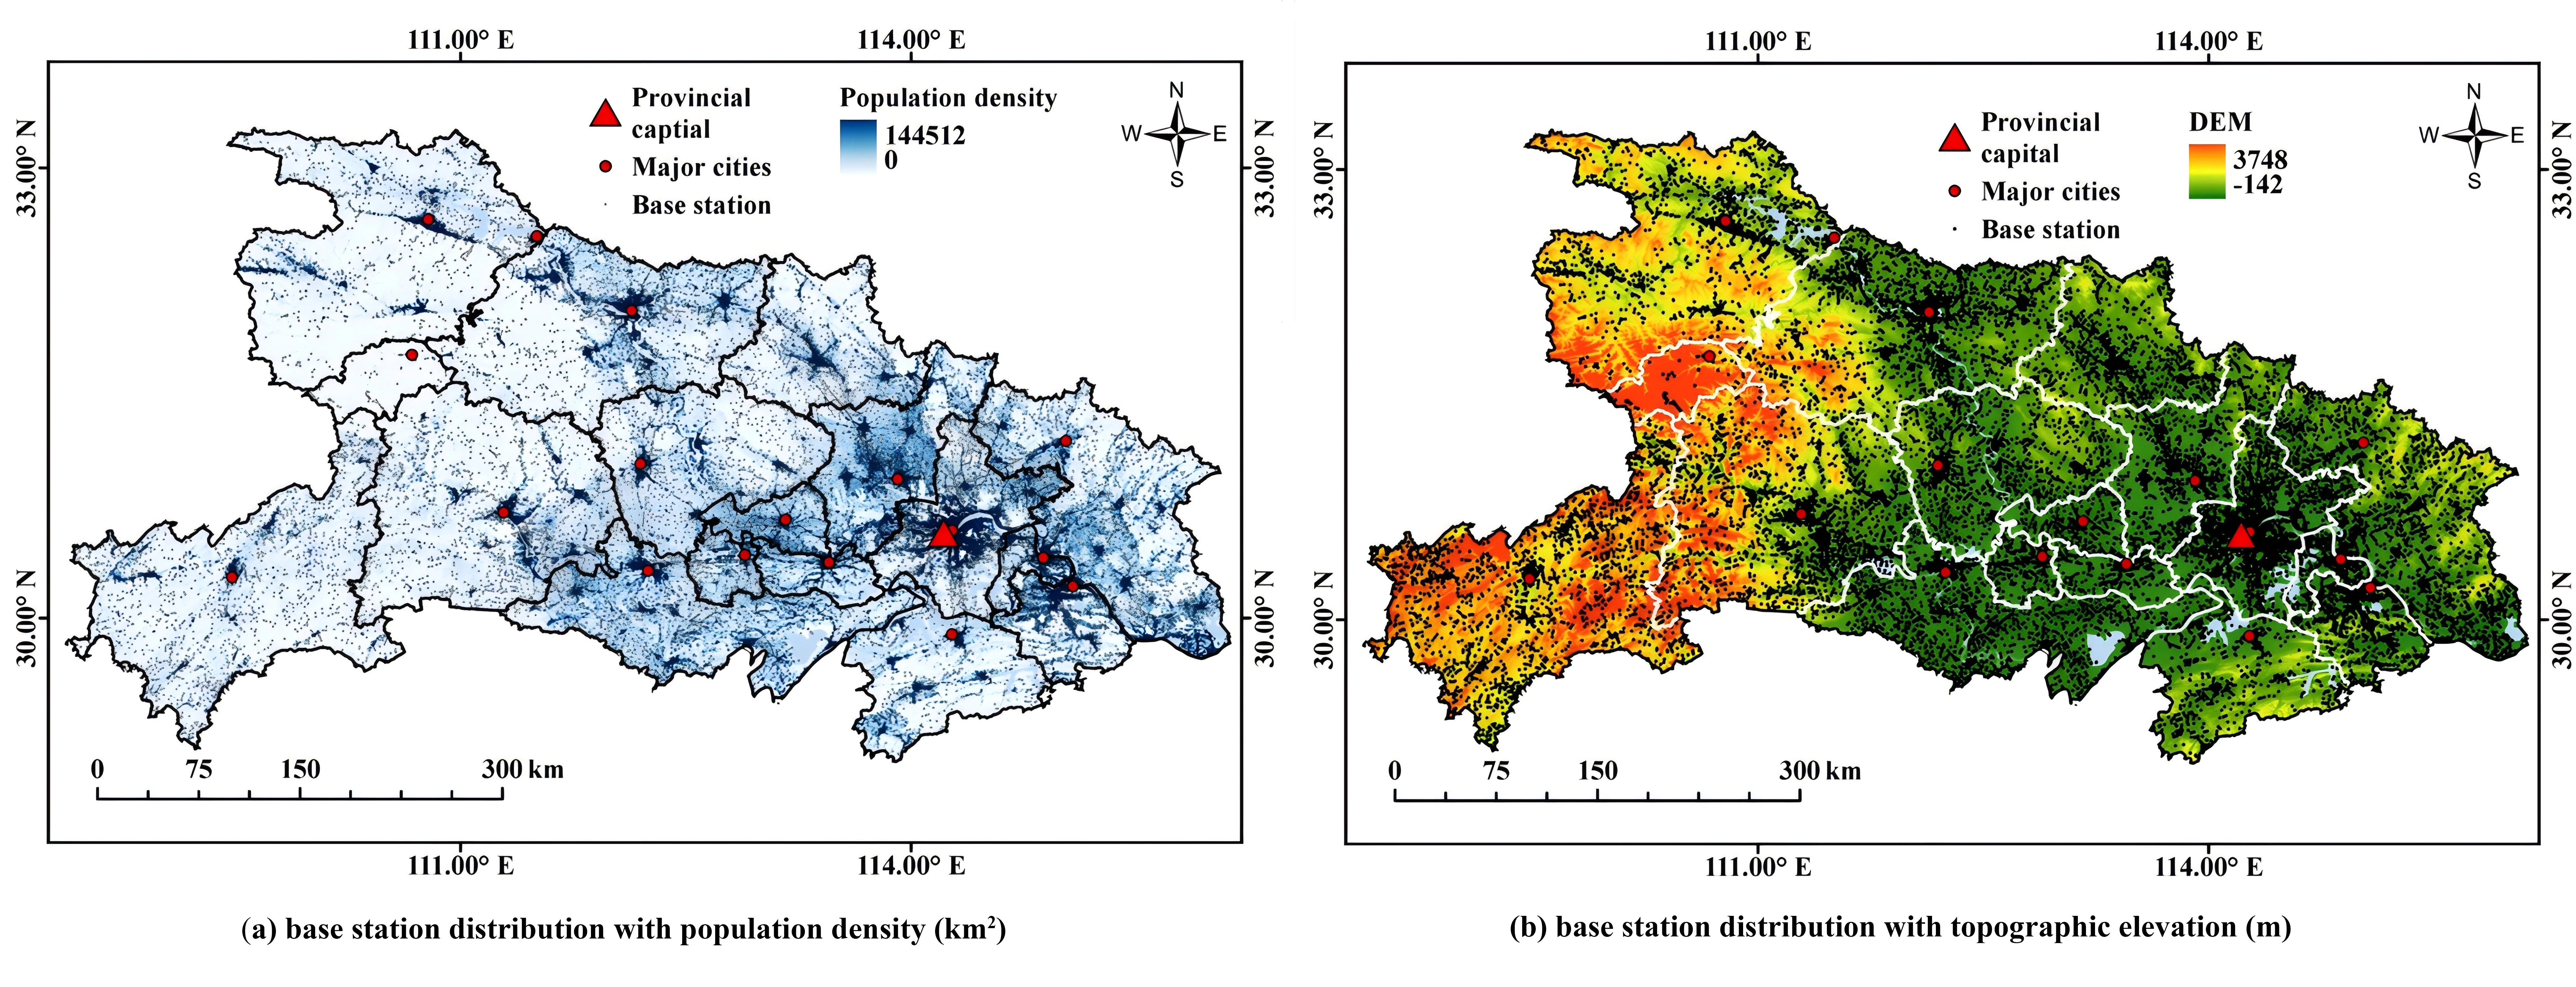
Figure 4. Spatial distribution of 5G base stations in Hubei Province: (a) With population density; (b) With elevation. DEM: digital elevation model.
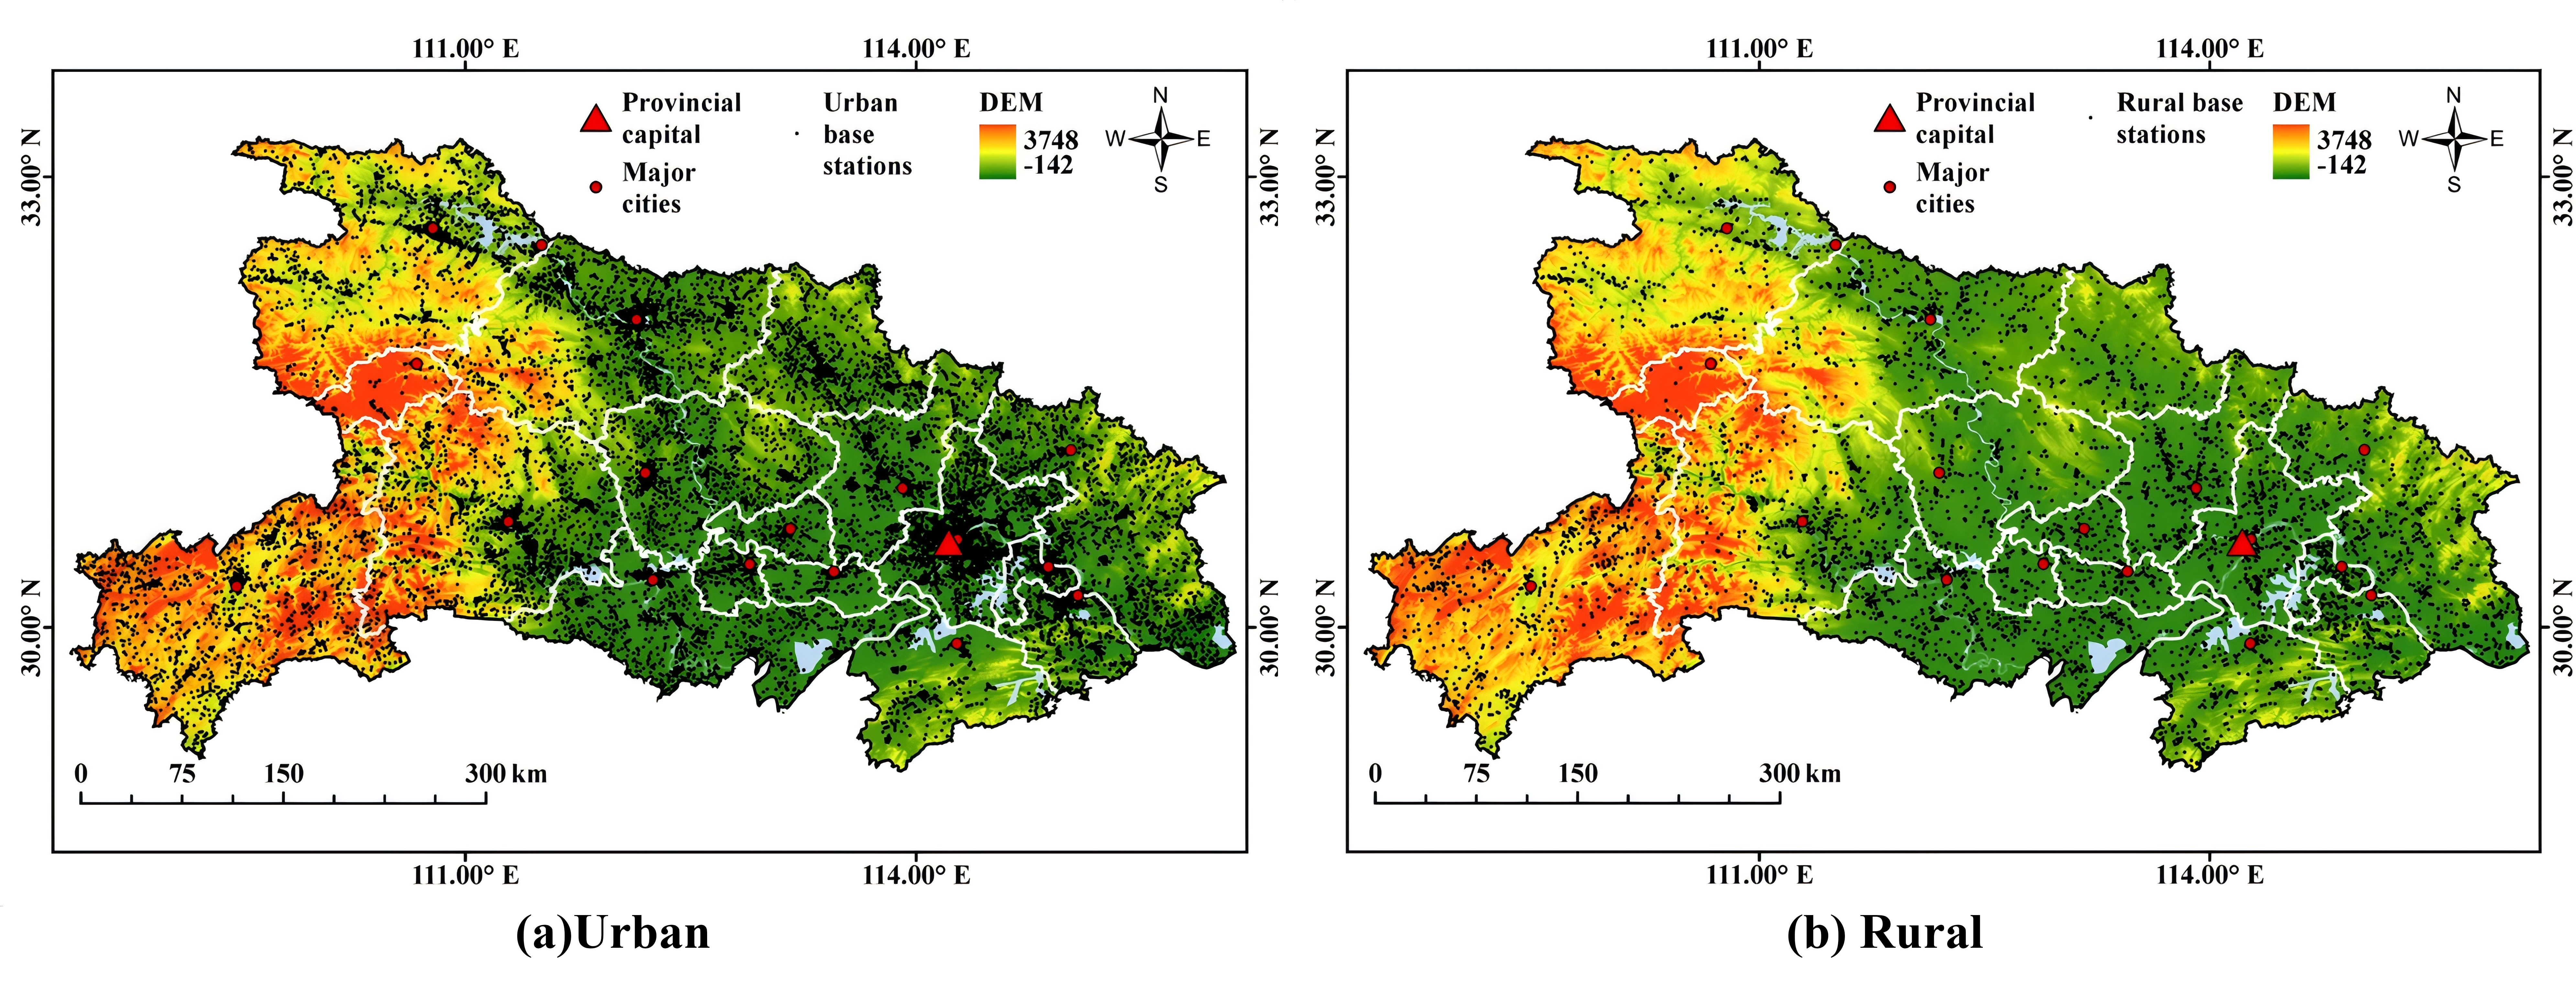
Analysis of base station distribution by settlement type reveals pronounced urban-rural disparities in 5G infrastructure deployment. Through geographic coordinate-based classification, 31,653 base stations (84.4%) were identified as urban installations. In comparison, 5,872 stations (15.6%) serve rural areas, yielding an urban-to-rural deployment ratio of 5.4:1. The spatial visualization in Figure 5 illustrates this disparity, with urban base stations forming dense, interconnected networks with pronounced clustering in metropolitan centers and prefecture-level cities, particularly in the central and eastern regions. In contrast, rural base stations exhibit sparse, discontinuous distribution patterns, with conspicuous coverage gaps in the northwestern mountainous regions and southwestern highlands, where both population density and terrain accessibility are limited. The central and eastern plains show relatively higher rural deployment density than the mountainous peripheries, yet still maintain substantially lower coverage than adjacent urban areas.
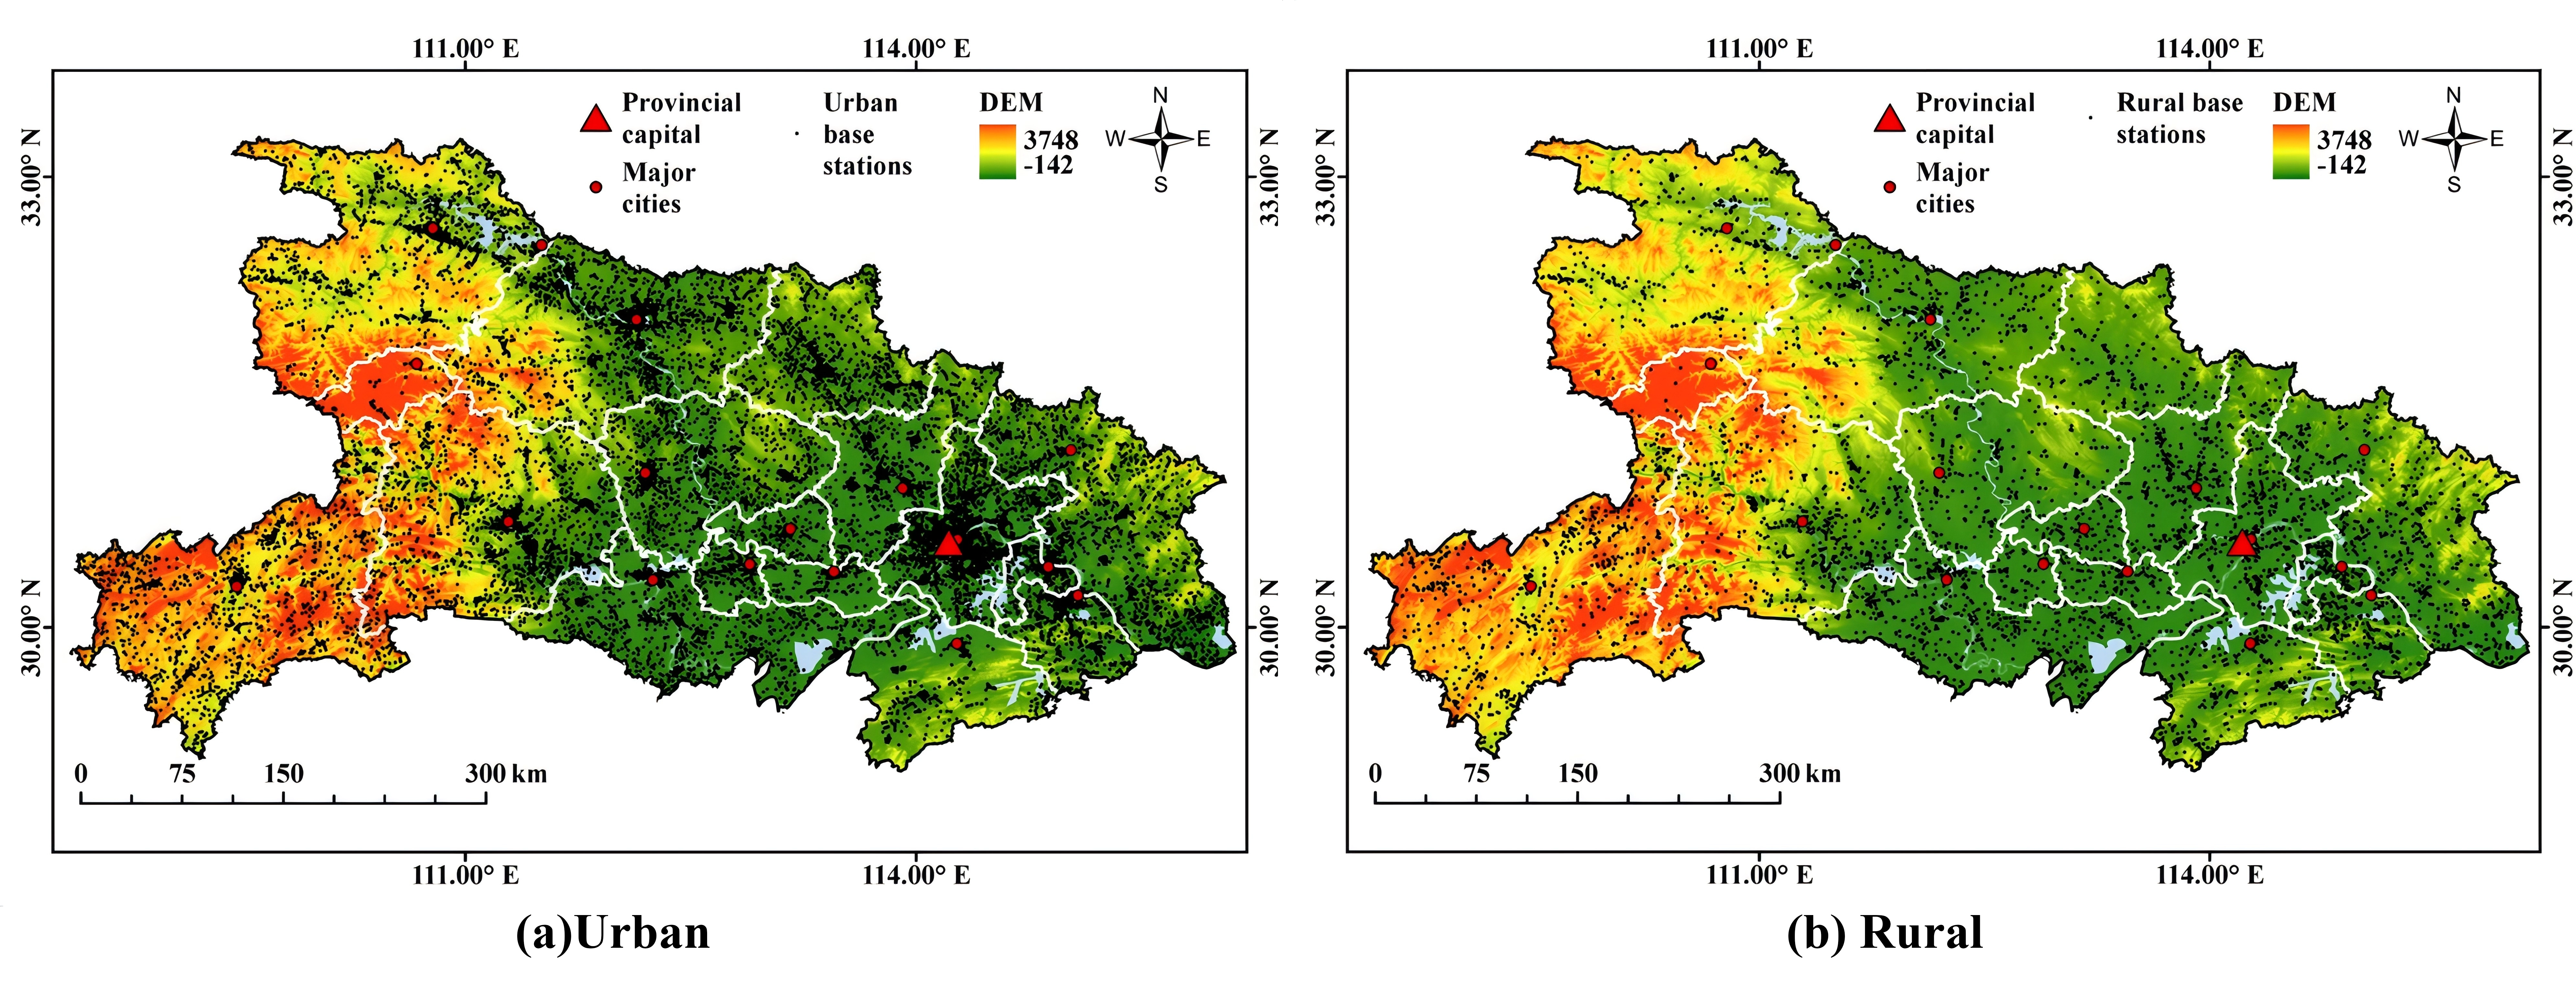
Figure 5. Distribution of 5G base stations by urban and rural classification in the studied province. DEM: digital elevation model.
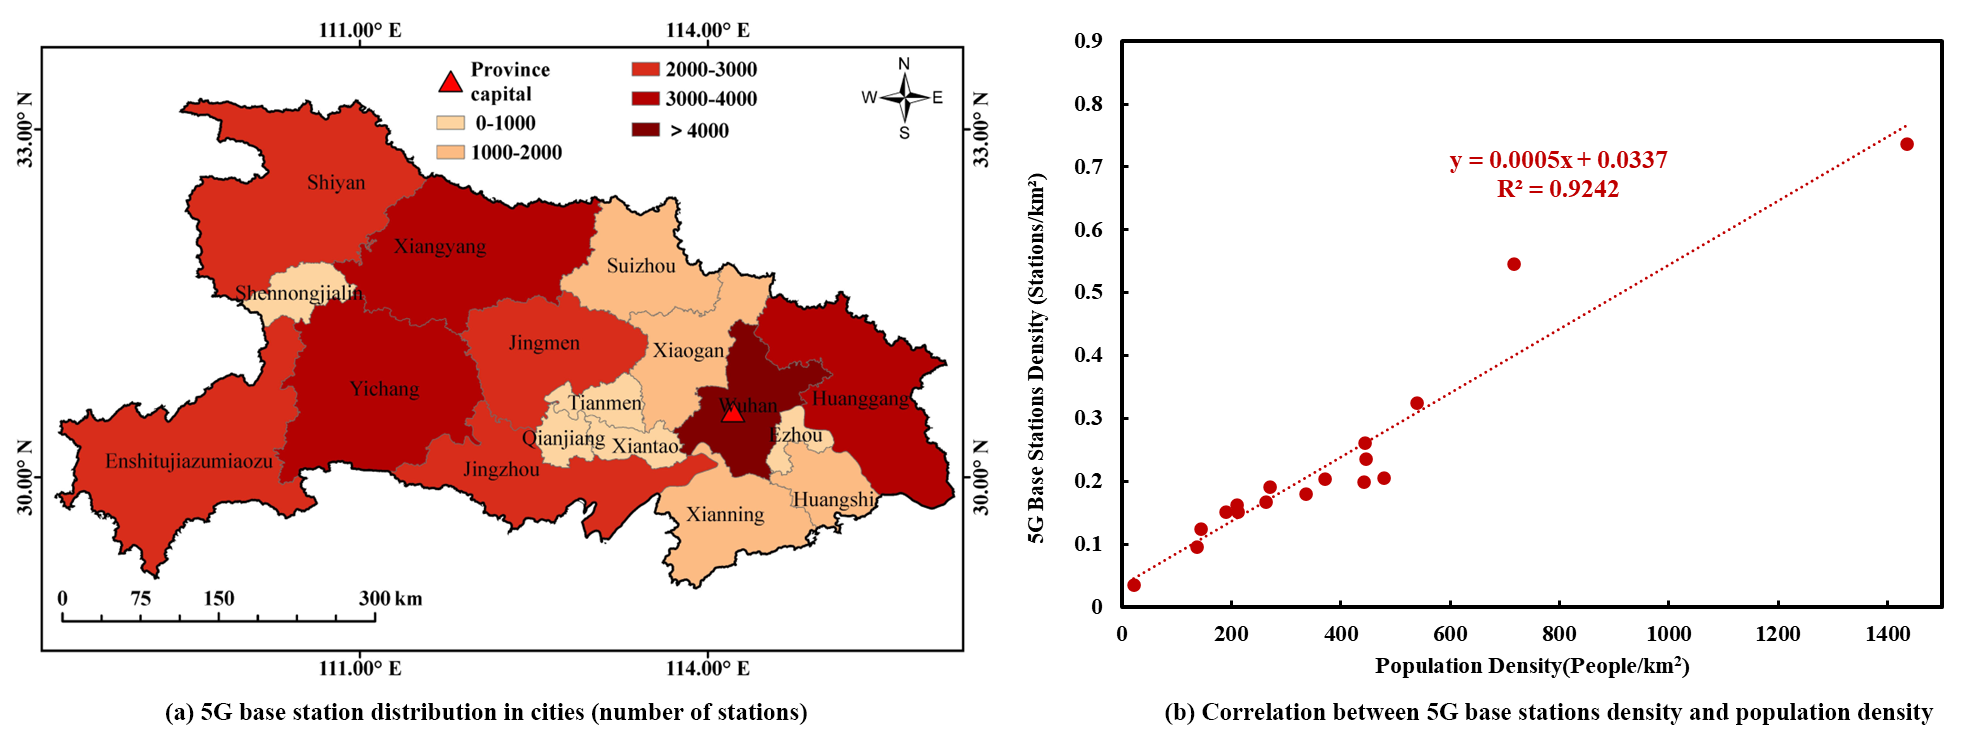
To quantitatively verify the relationship between base station deployment and the observed population distribution patterns, statistical analysis was conducted at the municipal level. As shown in Figure 6a, the number of base stations varies dramatically among the 17 municipalities, ranging from 114 stations in the northwestern mountainous region to 6,327 stations in the provincial capital Wuhan, a 55-fold difference. The spatial pattern shows clear geographic clustering, with municipalities in the central and eastern plains (Wuhan, Huanggang, Xiangyang) having the highest base station counts (exceeding 3,000 stations). In contrast, peripheral mountainous areas (Shennongjialin, Enshi) have fewer than 500 stations. As shown in Figure 6b, correlation analysis between base station density and population density across all municipalities yields a strong positive relationship (correlation coefficient of 0.92), confirming the strong association between base station deployment and population distribution patterns across the province.
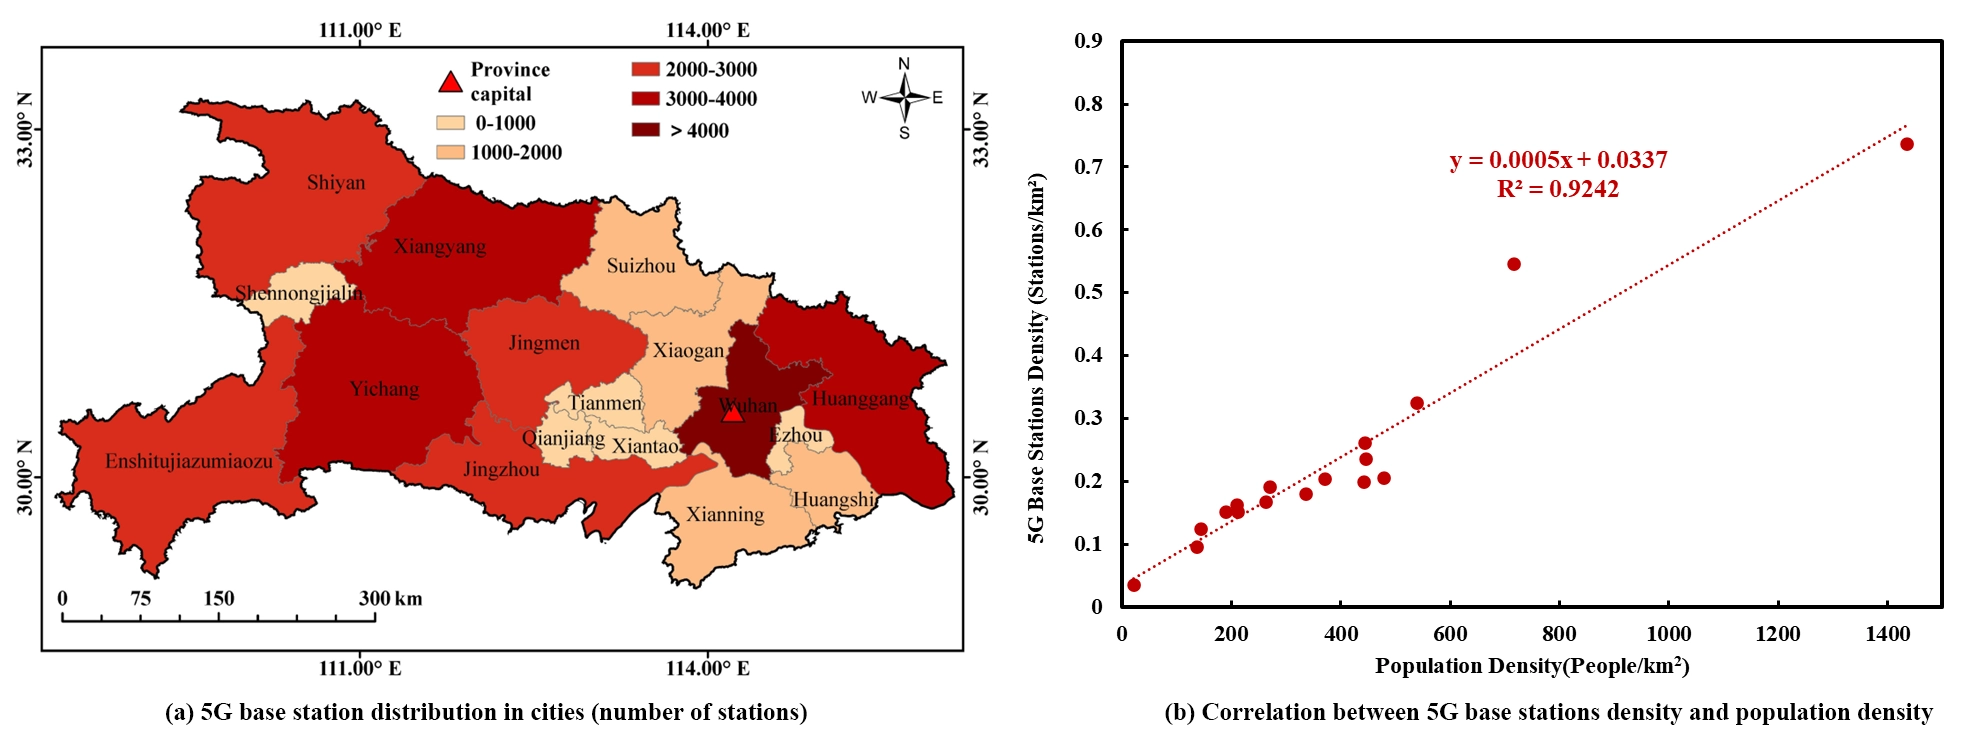
Figure 6. Distribution of the number and correlation of 5G base stations in cities.
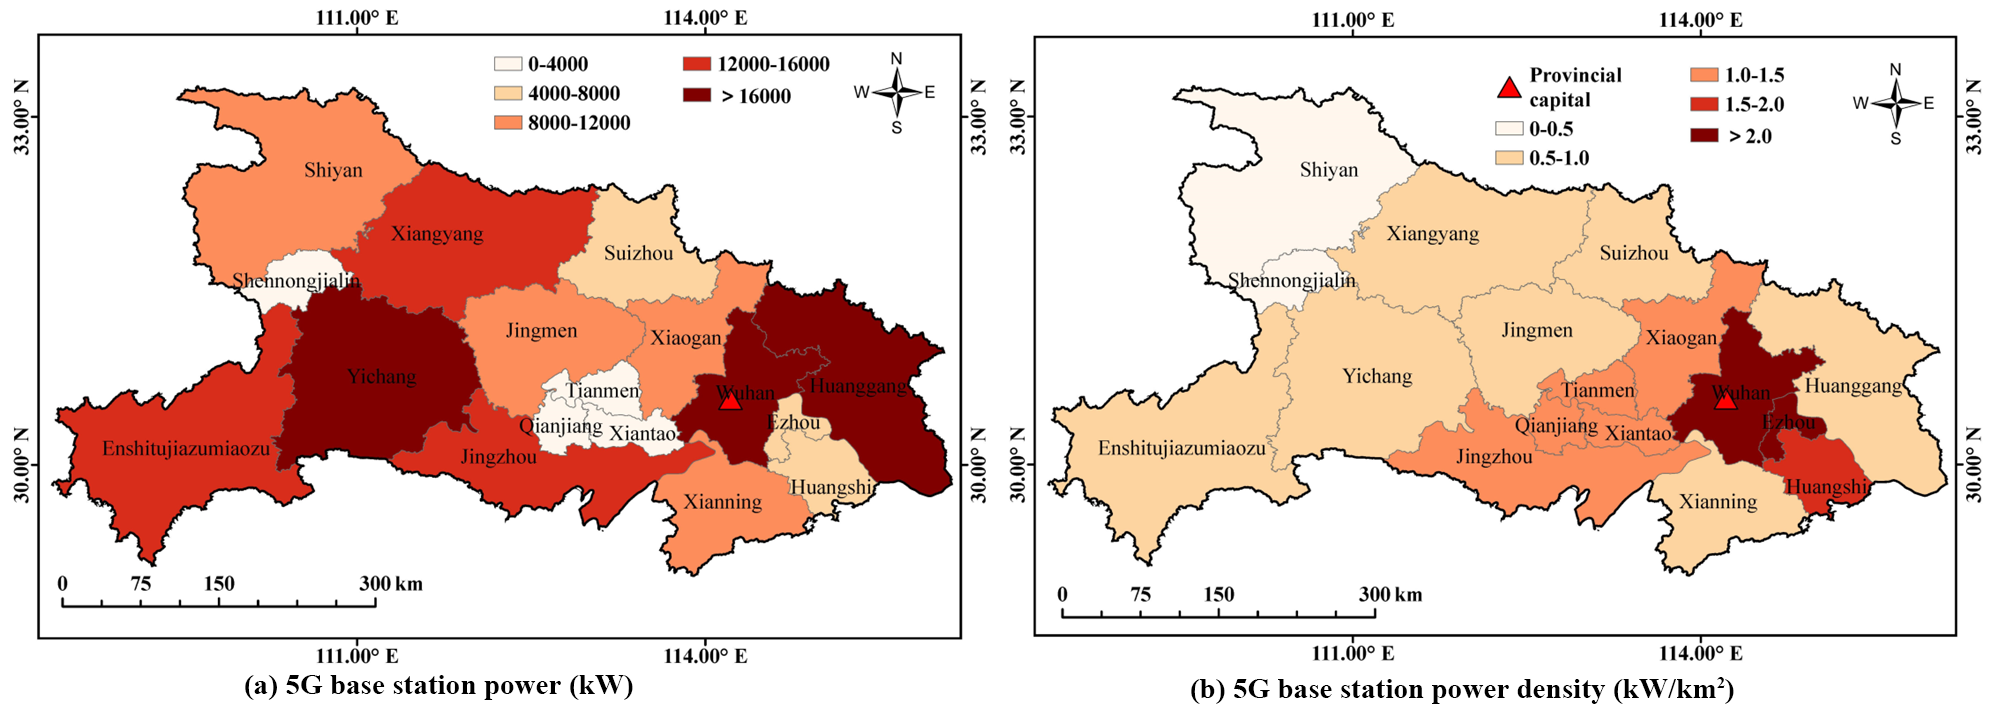
The power distribution of 5G base stations across Hubei Province exhibits patterns similar to the deployment density distribution. As shown in Figure 7a, total power consumption varies substantially among municipalities, with the provincial capital, Wuhan, having the highest consumption of 44,114 kW. In comparison, northwestern mountainous regions have the lowest consumption of only 661 kW. The power density analysis in Figure 7b shows that Wuhan has the highest power density of 5.1 kW/km2, about 25 times that of mountainous regions (0.2 kW/km2). This spatial heterogeneity mirrors the uneven energy demand patterns characteristic of urbanization, where dense urban cores generate disproportionately concentrated electrical loads. The concentration of base station loads in Wuhan and central municipalities generates localized high-density demand that may challenge existing urban capacity margins. This concentrated deployment pattern, driven by telecommunications business logic rather than coordinated urban energy infrastructure planning, introduces rapid load growth in specific areas that may not align with existing distribution capacity allocation, highlighting the need to incorporate 5G infrastructure as an explicit demand component in urban energy planning and distribution network capacity assessments.
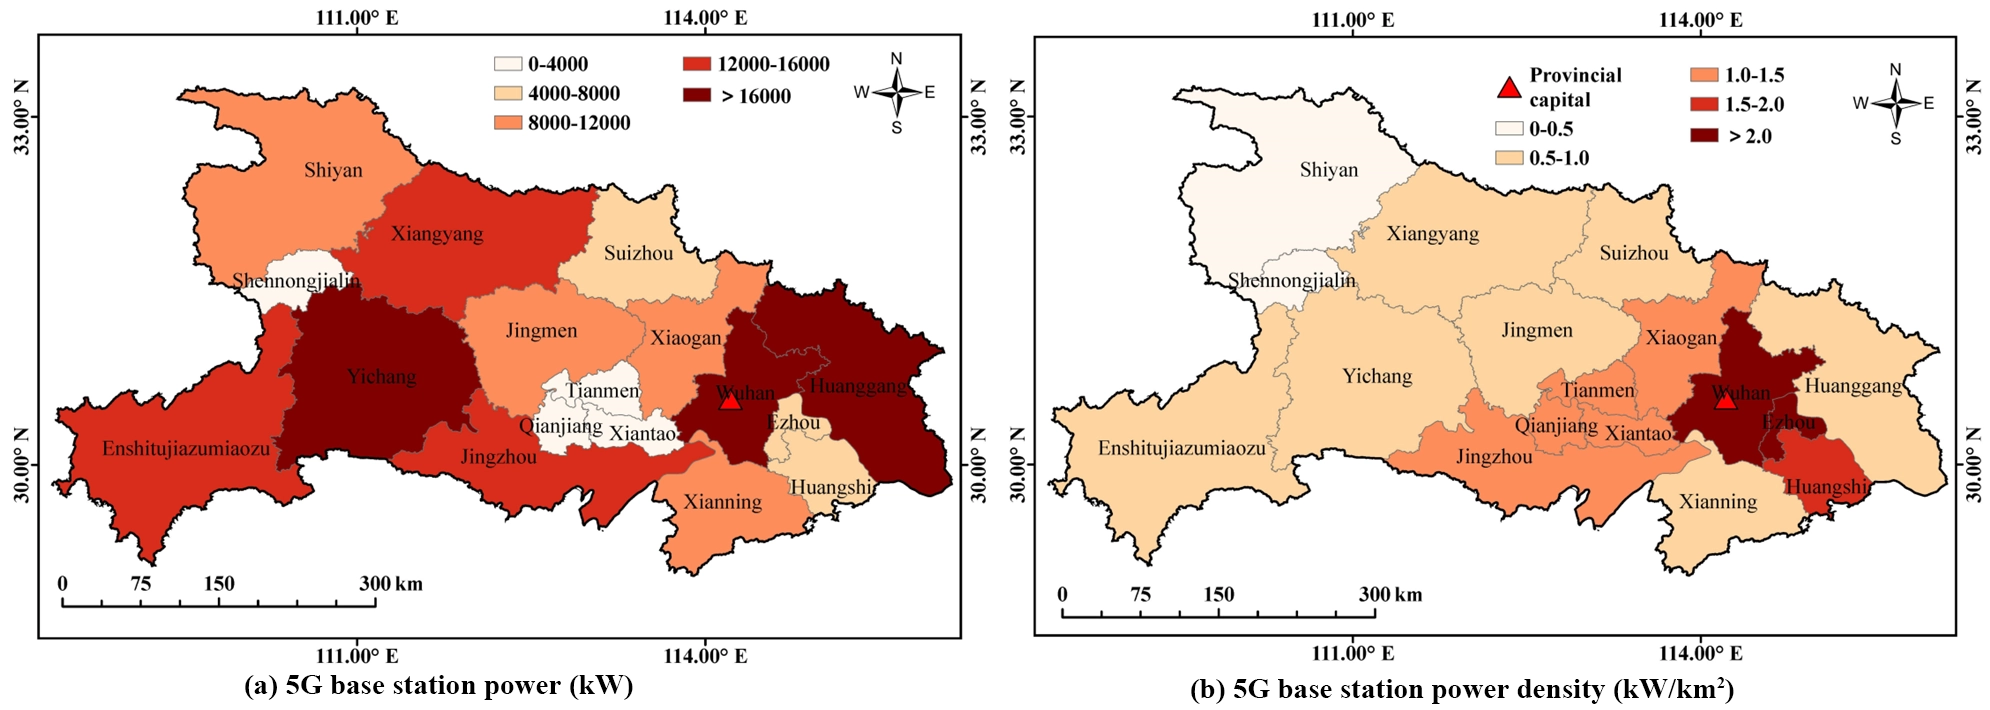
Figure 7. Distribution of the power and power density of 5G base stations.
4.2 Temporal distribution of 5G base station loads
4.2.1 Monthly load characteristics
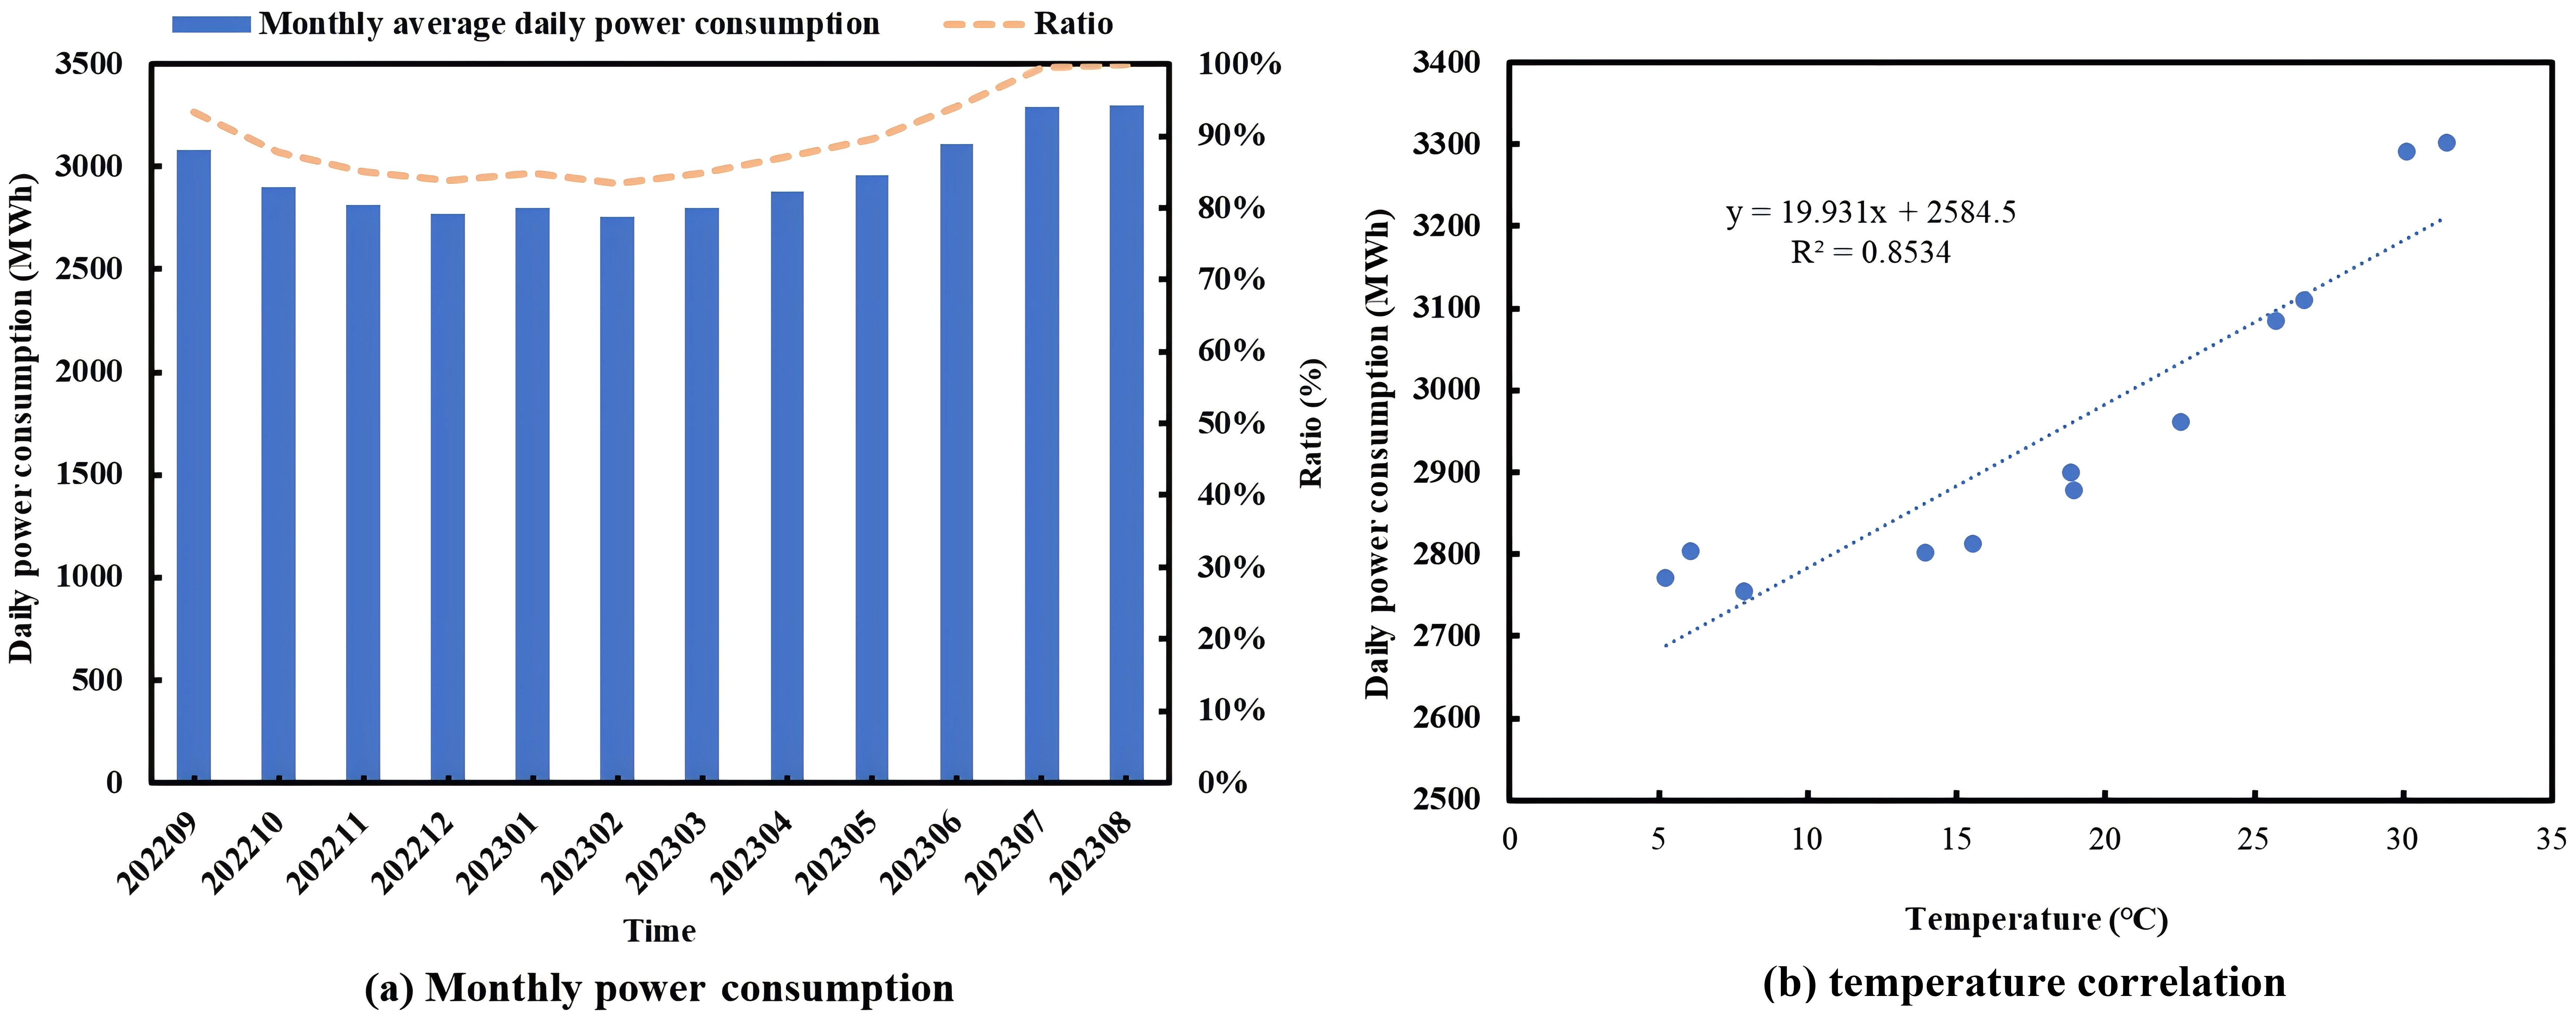
To eliminate differences in monthly total consumption caused by varying days per month, we analyze average daily power consumption for 37,525 base stations across 12 months from September 2022 to August 2023. As shown in Figure 8a, monthly average daily consumption varies between 2,755 and 3,302 MWh, with the ratio to maximum monthly consumption ranging from 84% to 100%. Consumption is lowest in February and highest in August, reflecting seasonal air-conditioning loads during the summer months. The correlation analysis in Figure 8b reveals a positive relationship between monthly average daily consumption and corresponding average temperature. Quantitatively, the Pearson correlation coefficient reaches 0.85, indicating a strong positive correlation. This temperature dependence primarily stems from cooling system operations, as power consumption increases with ambient temperature to maintain equipment operational temperatures. This pronounced temperature sensitivity has significant implications for urban grid operations: base station loads increase during summer months when urban grid systems typically experience peak demand from air conditioning in buildings and industrial facilities. The approximately 20% seasonal variation in consumption (a 547 MWh daily difference between winter and summer) represents substantial additional demand that urban distribution networks must accommodate during high-temperature periods, potentially exacerbating system-wide peak loading and increasing stress on urban energy infrastructure.
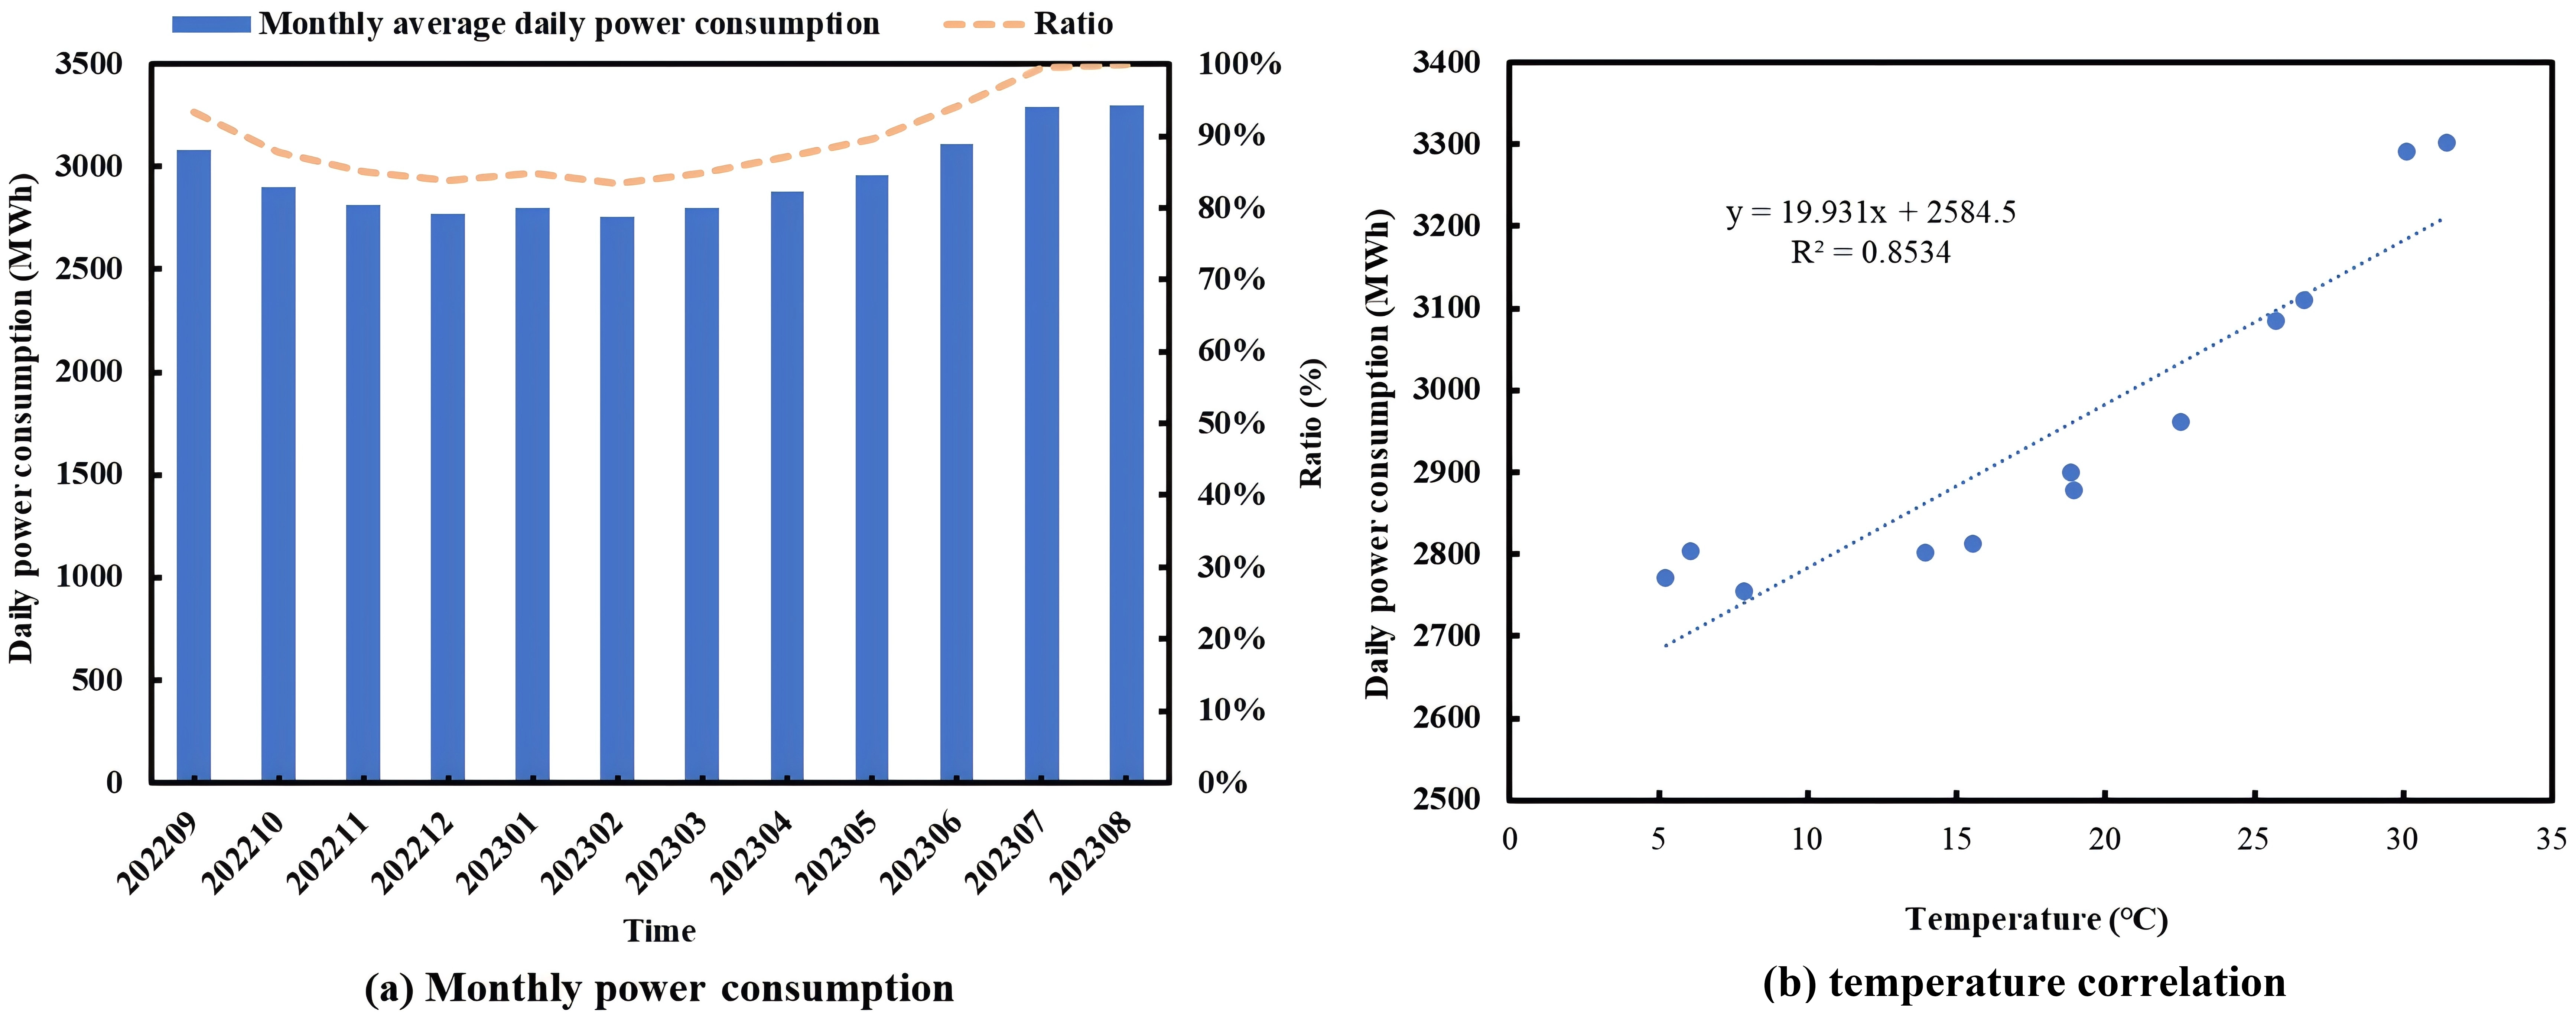
While the overall monthly consumption pattern shows clear seasonal correlation with temperature, individual base stations may exhibit different response patterns due to varying operational conditions, user demands, and local factors. To further investigate the diversity of monthly load patterns among individual stations and identify distinct operational clusters, a clustering analysis is performed. The analysis uses monthly average daily power consumption data from September 2022 to August 2023 for each of the 37,525 base stations. To facilitate comparison between stations with different power levels, the monthly data for each station are normalized according to Eq. (7), where, α denotes the power value after normalization, Pi denotes the original monthly average daily power consumption, and Pmax denotes the maximum monthly average daily power consumption of the base station during the 12 months of interest.
To ensure robust identification of distinct load patterns, comprehensive clustering validation analysis was conducted. K-means and hierarchical clustering algorithms were first compared to select the most appropriate method for the dataset. As shown in Figure 9a, K-means outperforms hierarchical clustering across multiple metrics: a higher silhouette score indicating better cluster separation (0.324 vs. 0.280), a lower Davies-Bouldin index indicating better cluster compactness (1.662 vs. 1.757), and significantly faster computation time (0.80 s vs. 68.92 s), making it more suitable for large-scale base station analysis. For the selected K-means algorithm, multiple validation metrics were employed to determine the optimal number of clusters. The silhouette analysis in Figure 9b indicates that k = 2 provides the highest silhouette score (0.324), suggesting optimal cluster separation and cohesion. The Davies-Bouldin index in Figure 9c reaches its minimum at k = 3 (1.490) but shows only marginal improvement over k = 2 (1.662). The elbow method shown in Figure 9d reveals a clear elbow point at k = 2, with a substantial 23.9% reduction in within-cluster sum of squares from k = 1 to k = 2, compared to 16.8% from k = 2 to k = 3. Based on these converging validation metrics, k = 2 was selected as the optimal number of clusters.
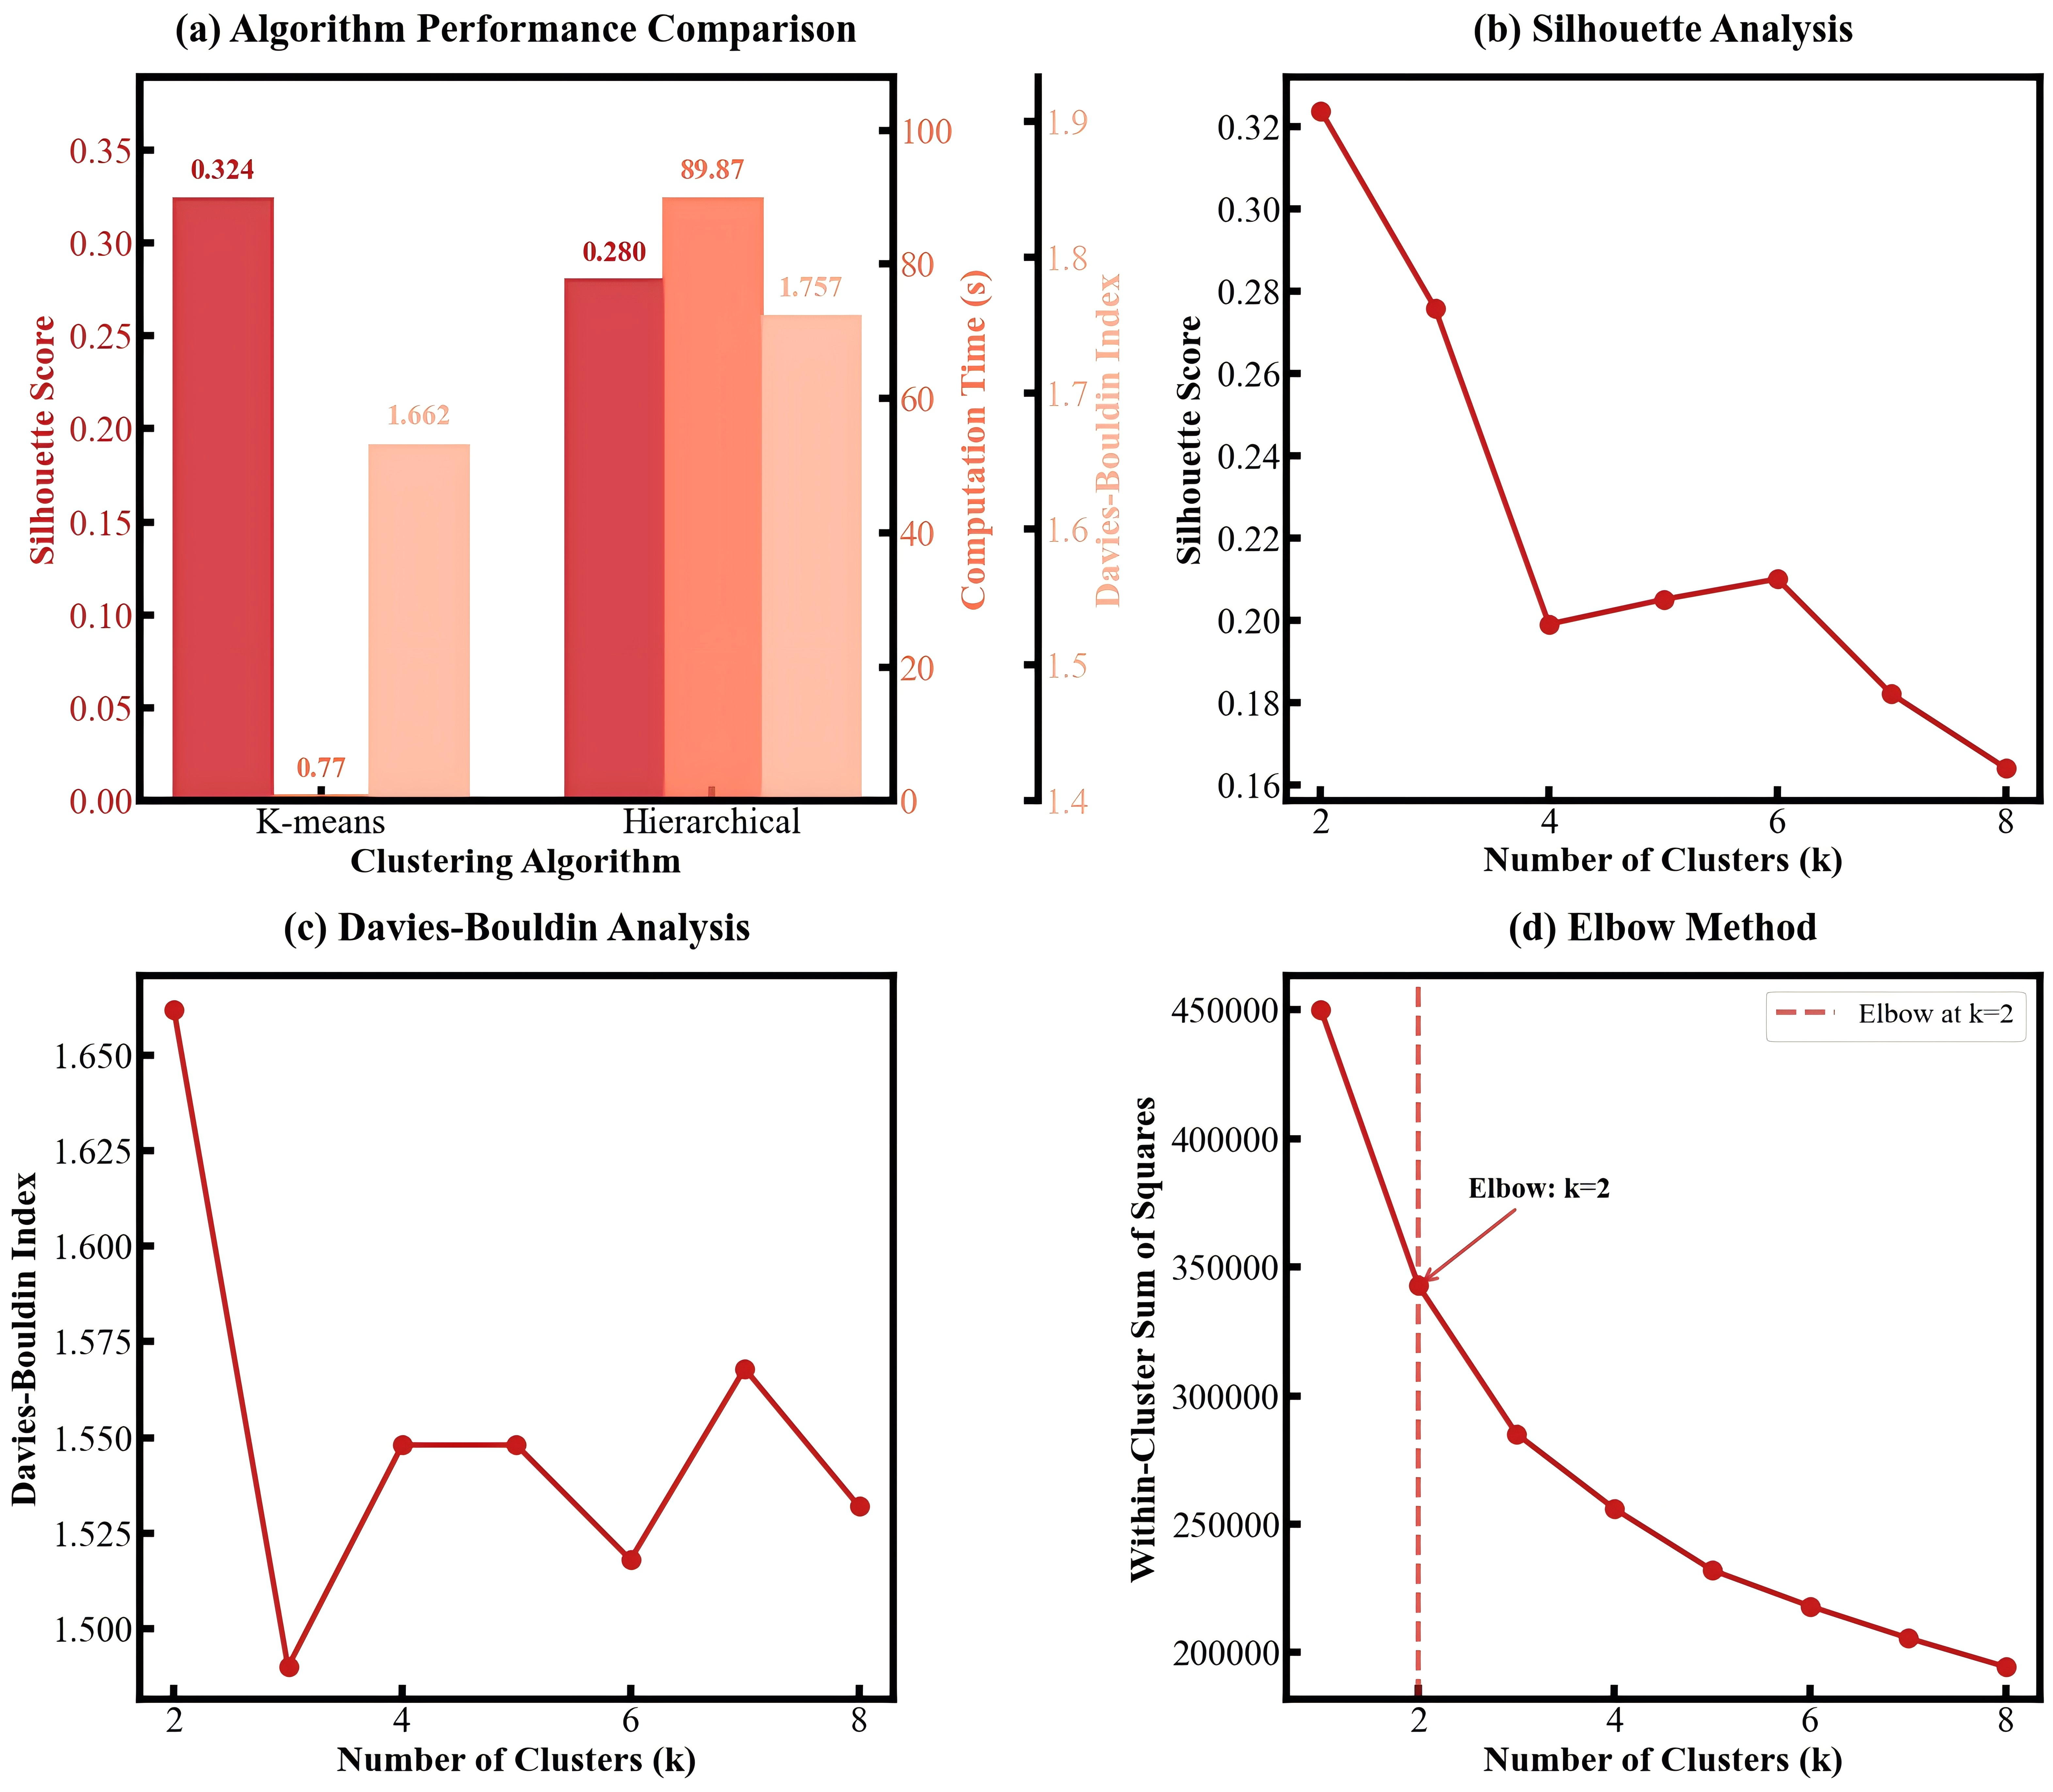
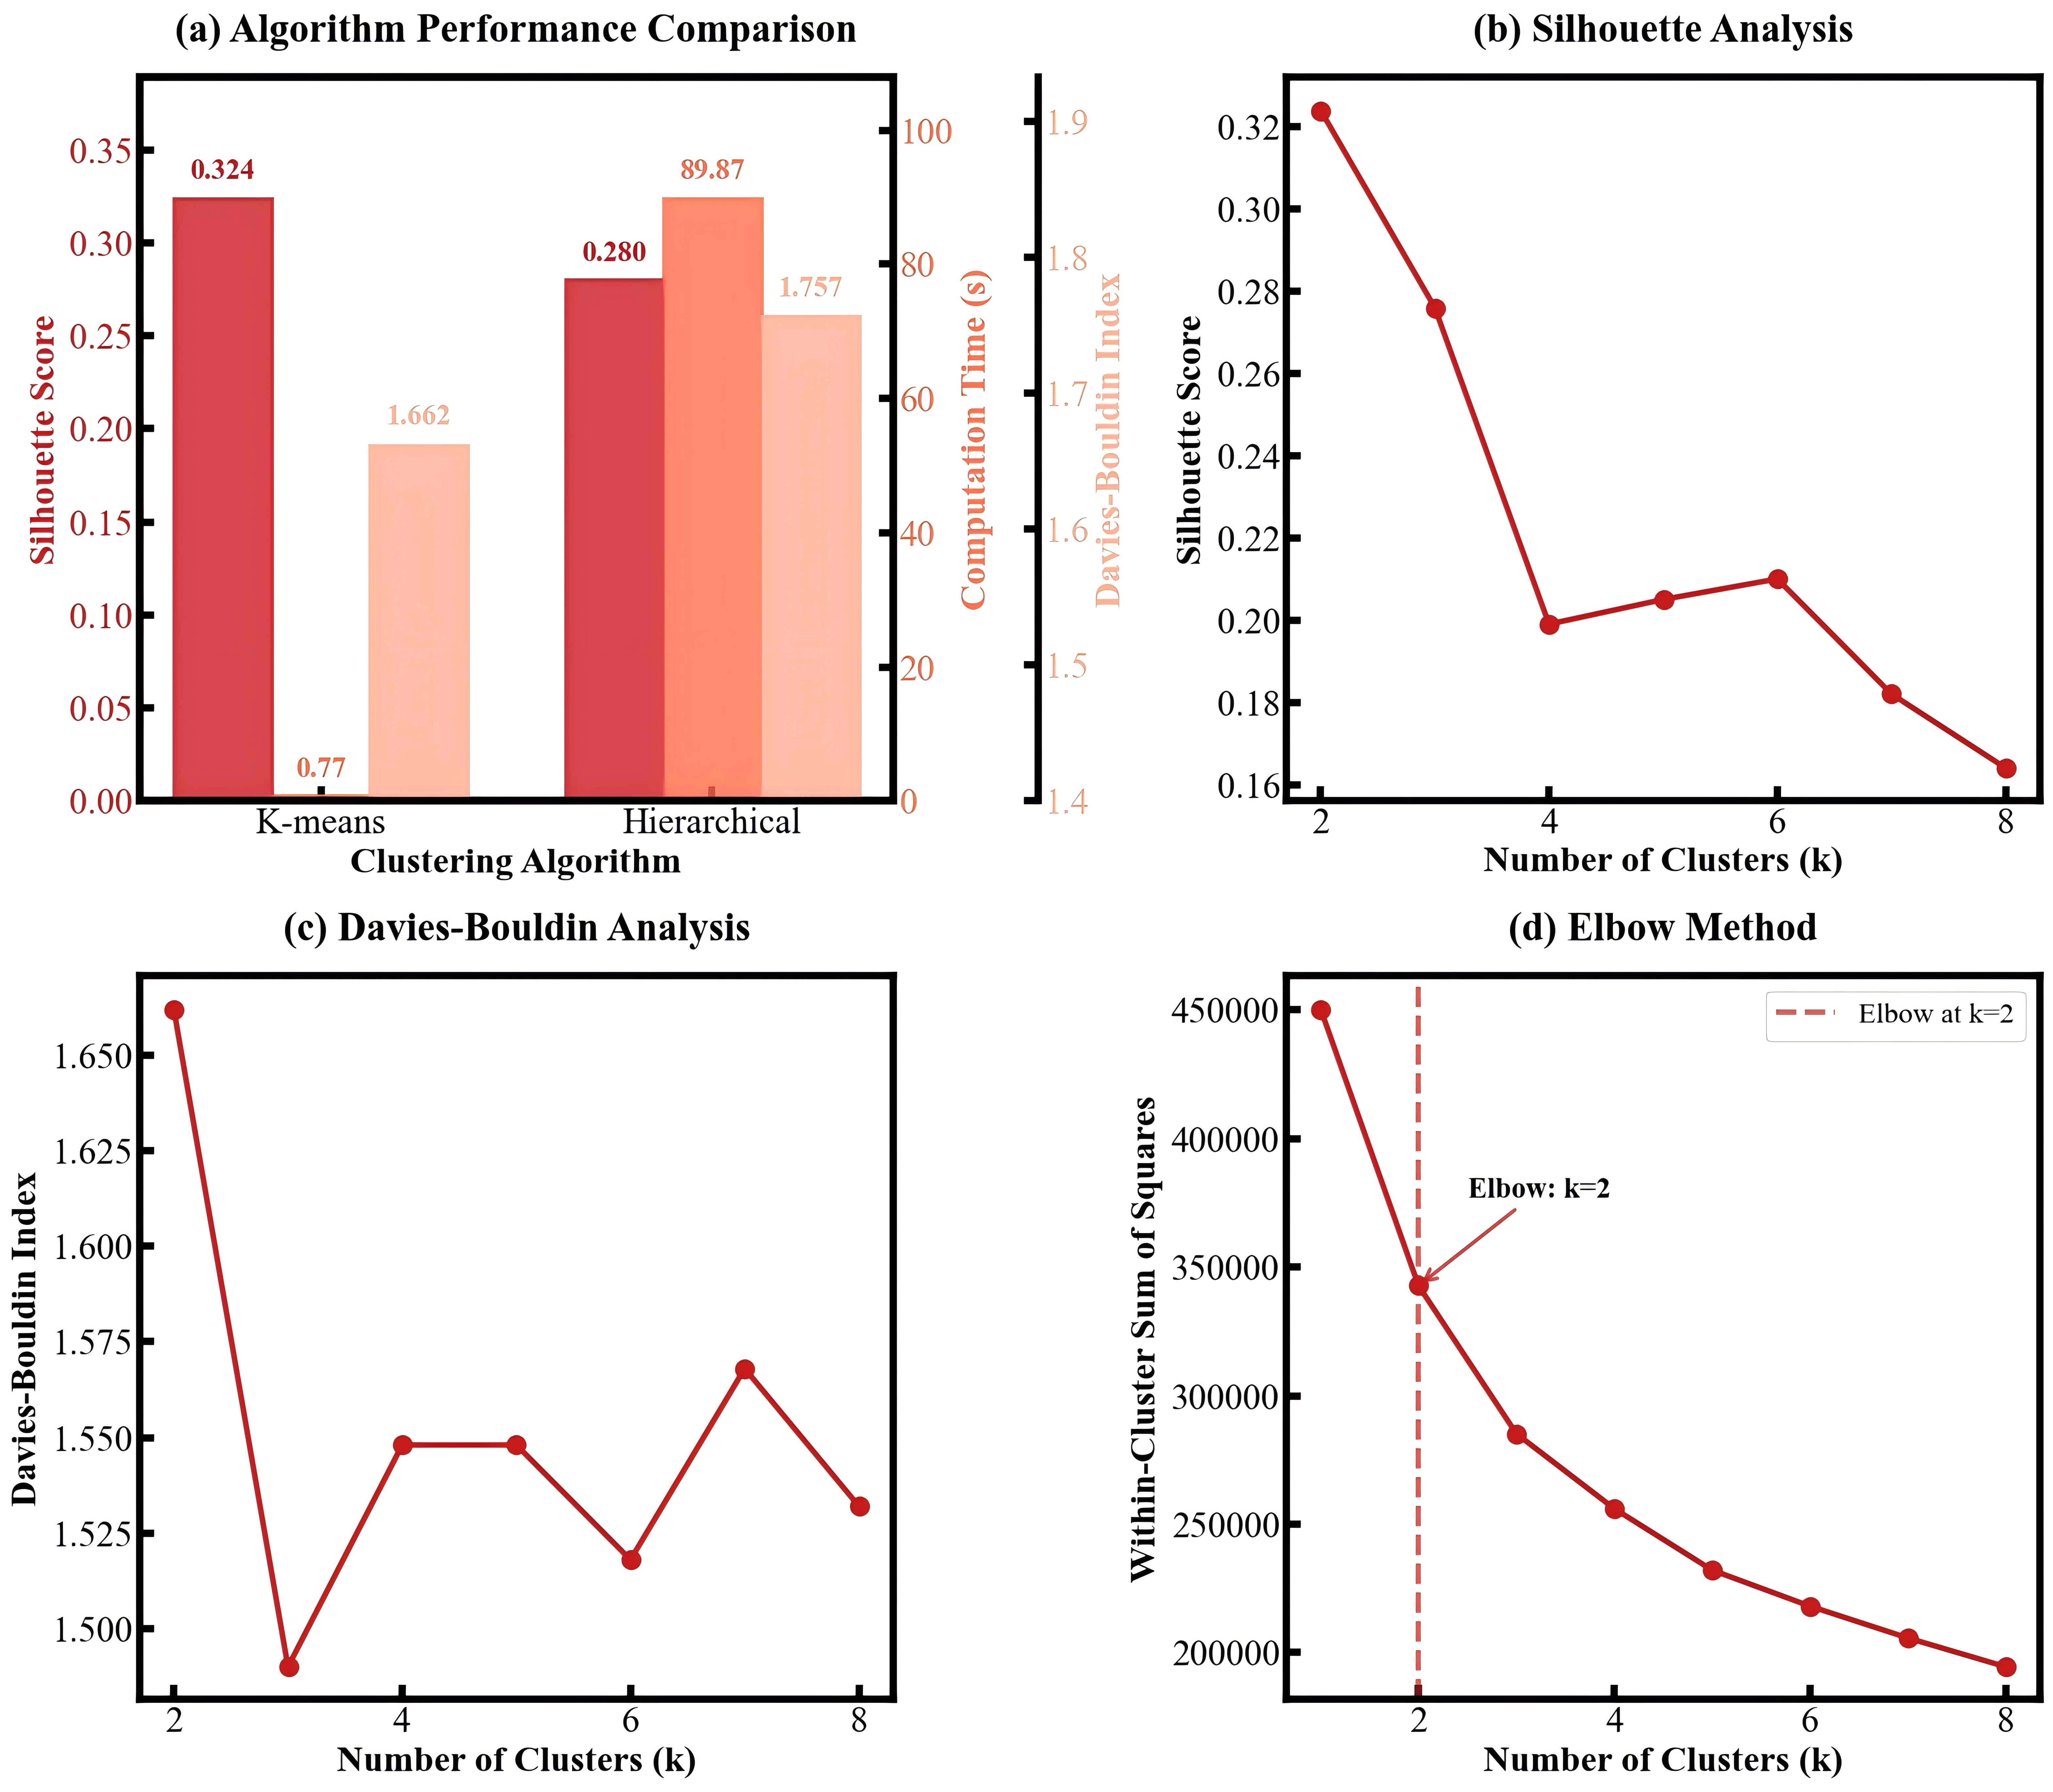
Figure 9. Clustering validation results for monthly load pattern analysis.
Based on the validated clustering approach, K-means clustering analysis with k = 2 reveals two distinct load patterns among the 37,525 base stations, as shown in Figure 10. Cluster 1 (73.5% of stations) shows clear seasonal variations in monthly power consumption, decreasing after September and reaching a minimum in the winter months, followed by a gradual increase to a peak in August. This pattern strongly correlates with the monthly average temperature trends. This seasonal variation may be primarily attributable to temperature-dependent air-conditioning loads. As temperatures rise during summer months, cooling demand increases power consumption. The slight consumption increase observed during January-February despite low temperatures may be associated with the one-week Chinese New Year holiday, during which increased population mobility and network utilization may temporarily increase base-station energy demand. Stations in Cluster 2 (26.5%) exhibit distinct characteristics. Their consumption correlates with the temperature only from September 2022 to February 2023, then remains relatively stable despite significant temperature increases throughout August.
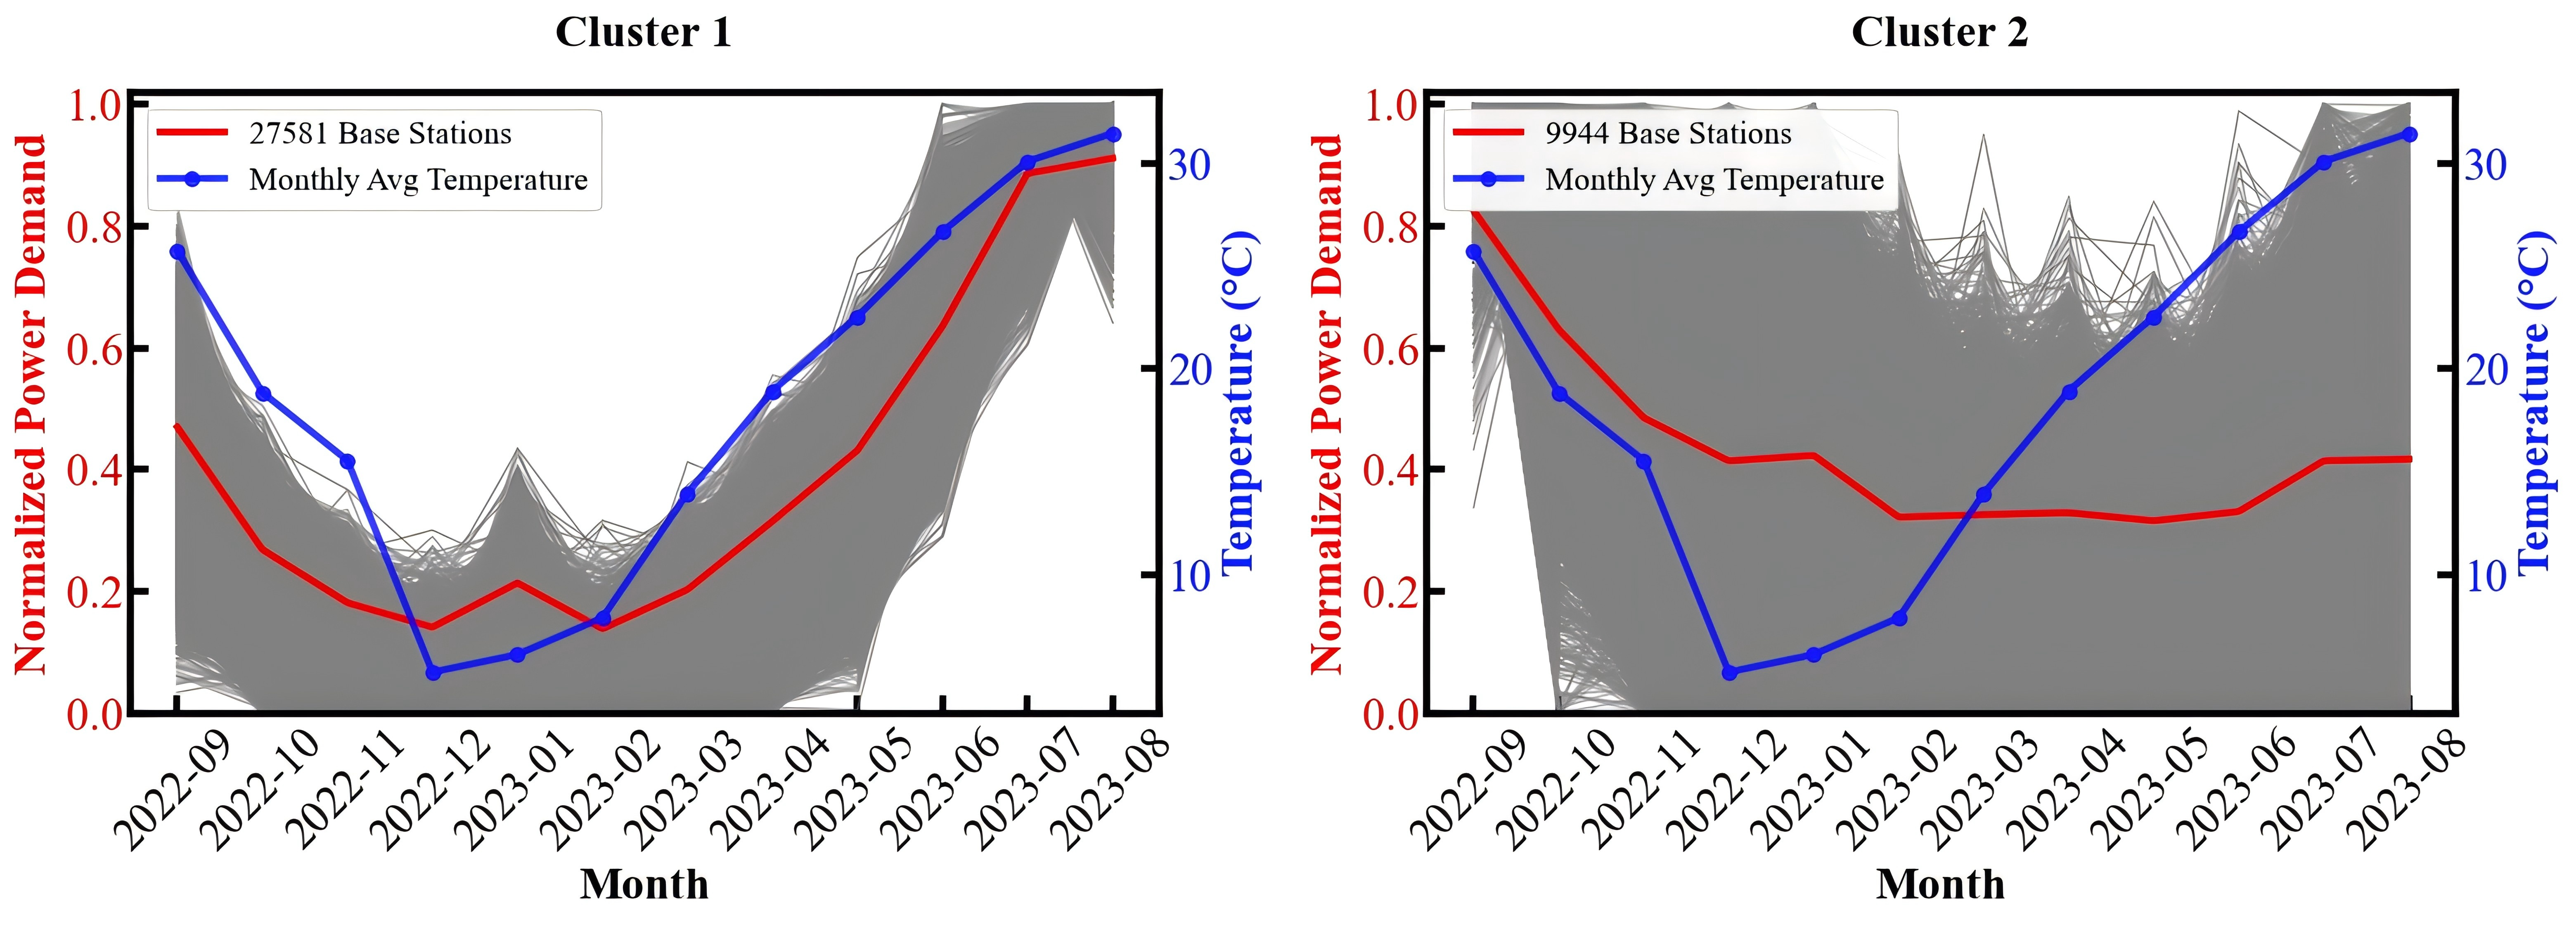
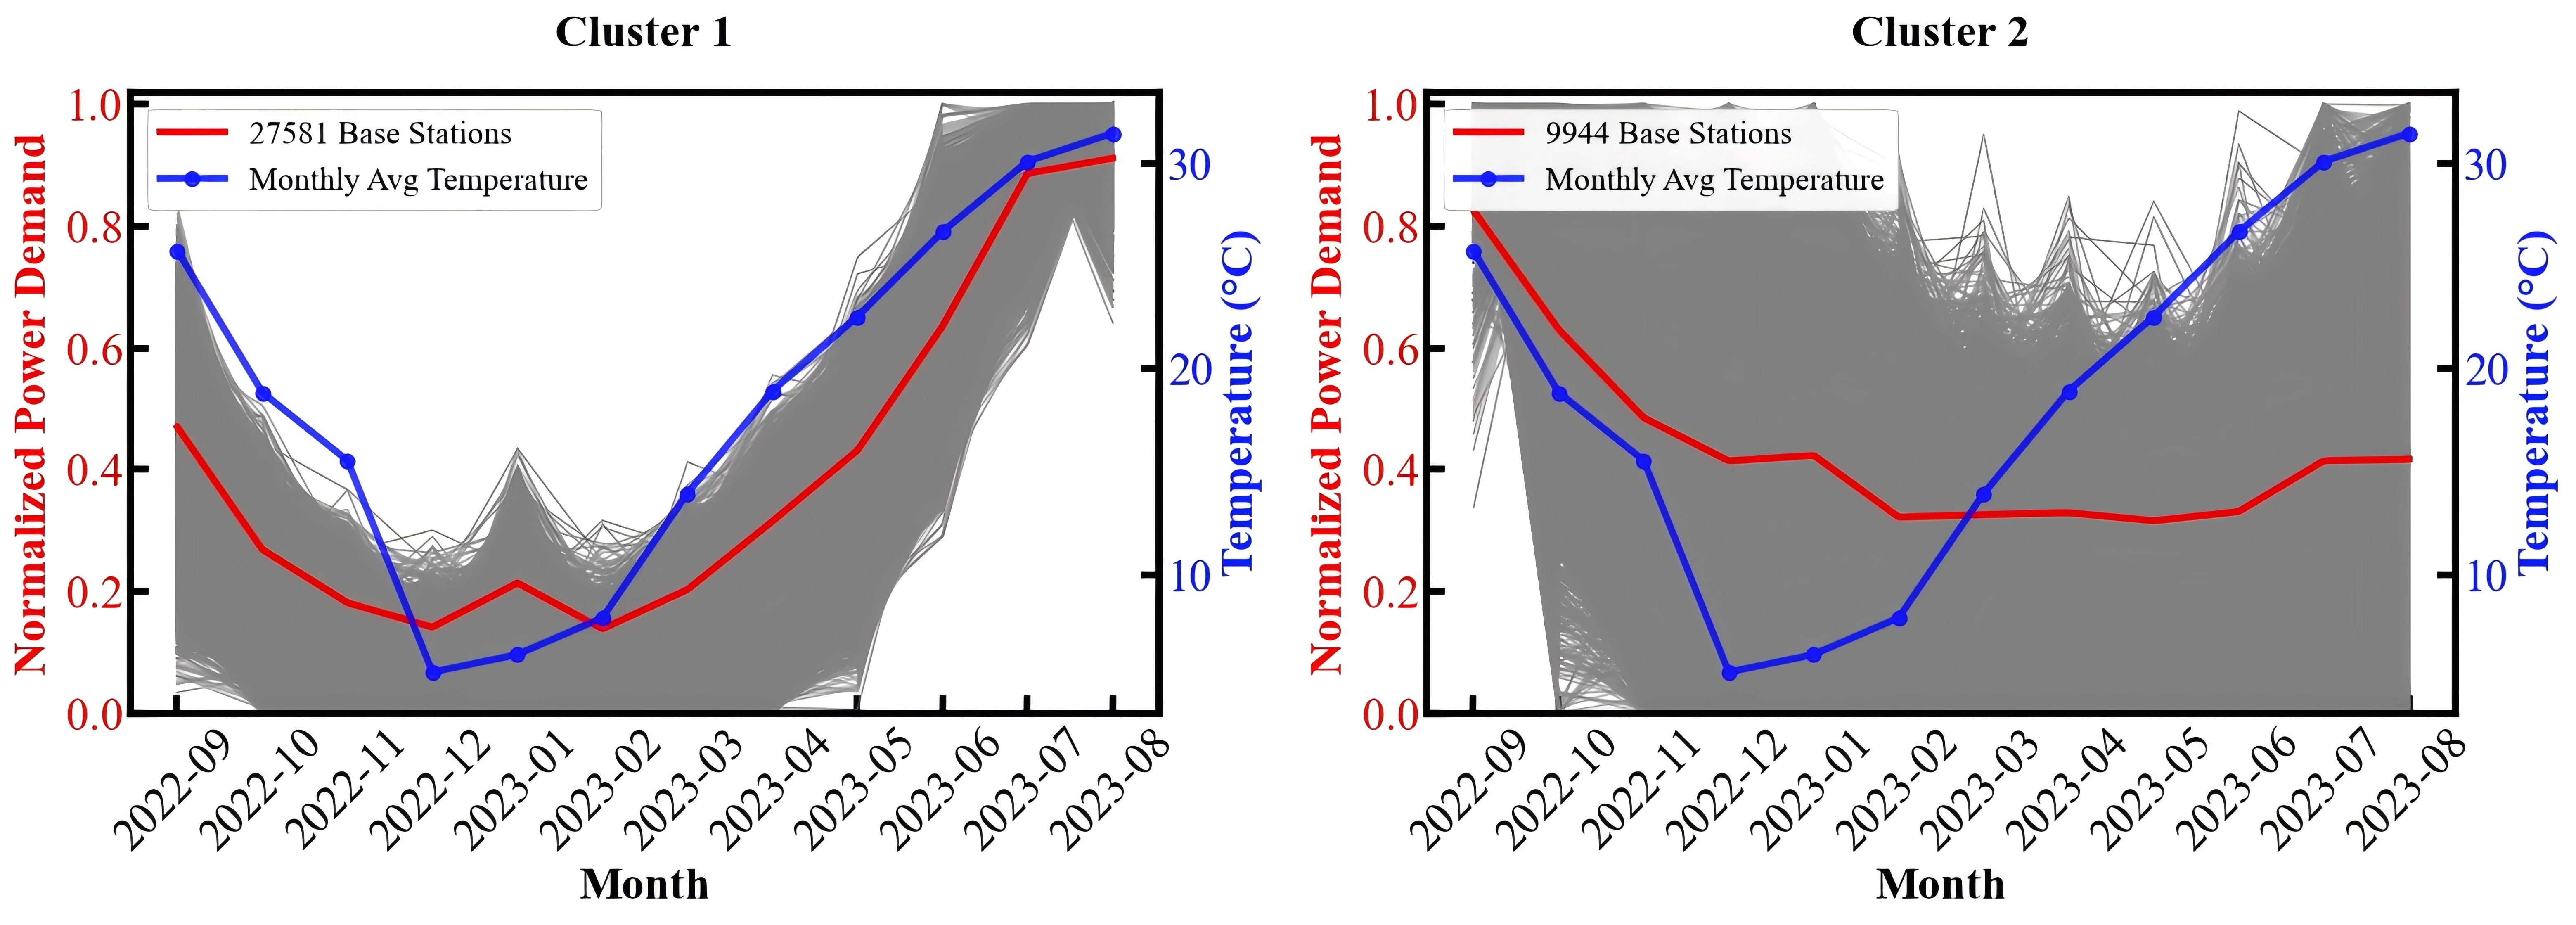
Figure 10. Clustering results of monthly average daily power consumption patterns of 5G base stations.
4.2.2 Weekly load characteristics
Based on typical weekly power data collected at 15-minute resolution for winter (February 13-26, 2023) and summer (August 3-16, 2023), this section analyzes weekly load characteristics. Figure 11 compares power consumption between urban and rural base stations across both seasons, revealing distinct seasonal and spatial patterns with implications for urban grid operations. Seasonal analysis reveals significant temperature-driven variations. Power consumption fluctuates between 2.7-3.3 kW in winter and 3.3-4.2 kW in summer, representing an average seasonal increase of approximately 1 kW. This 30% consumption increase during summer months coincides with urban peak grid-loading periods, when urban distribution networks simultaneously accommodate elevated air-conditioning loads from residential and commercial buildings. The synchronization of base station cooling demands with system-wide peak periods compounds stress on urban distribution infrastructure during high-temperature conditions. The urban-rural comparison shows consistent spatial disparities across both seasons. Urban stations consume approximately 0.5 kW more than rural counterparts, operating at 2.8-3.3 kW (winter) and 3.3-4.3 kW (summer), while rural stations range from 2.4-2.8 kW (winter) to 2.9-3.7 kW (summer). Beyond absolute consumption differences, daily load amplitude varies substantially: urban areas show about 1 kW of daily fluctuation in summer, compared with 0.8 kW in rural areas. This 25% greater volatility in urban load profiles reflects more dynamic user activity patterns, where pronounced business-hour peaks and off-hour reductions create sharper demand variations. From an urban distribution network perspective, this higher volatility in urban base station loads requires larger capacity margins to accommodate peak-to-average ratios, particularly when aggregated across thousands of urban stations within municipal distribution networks.
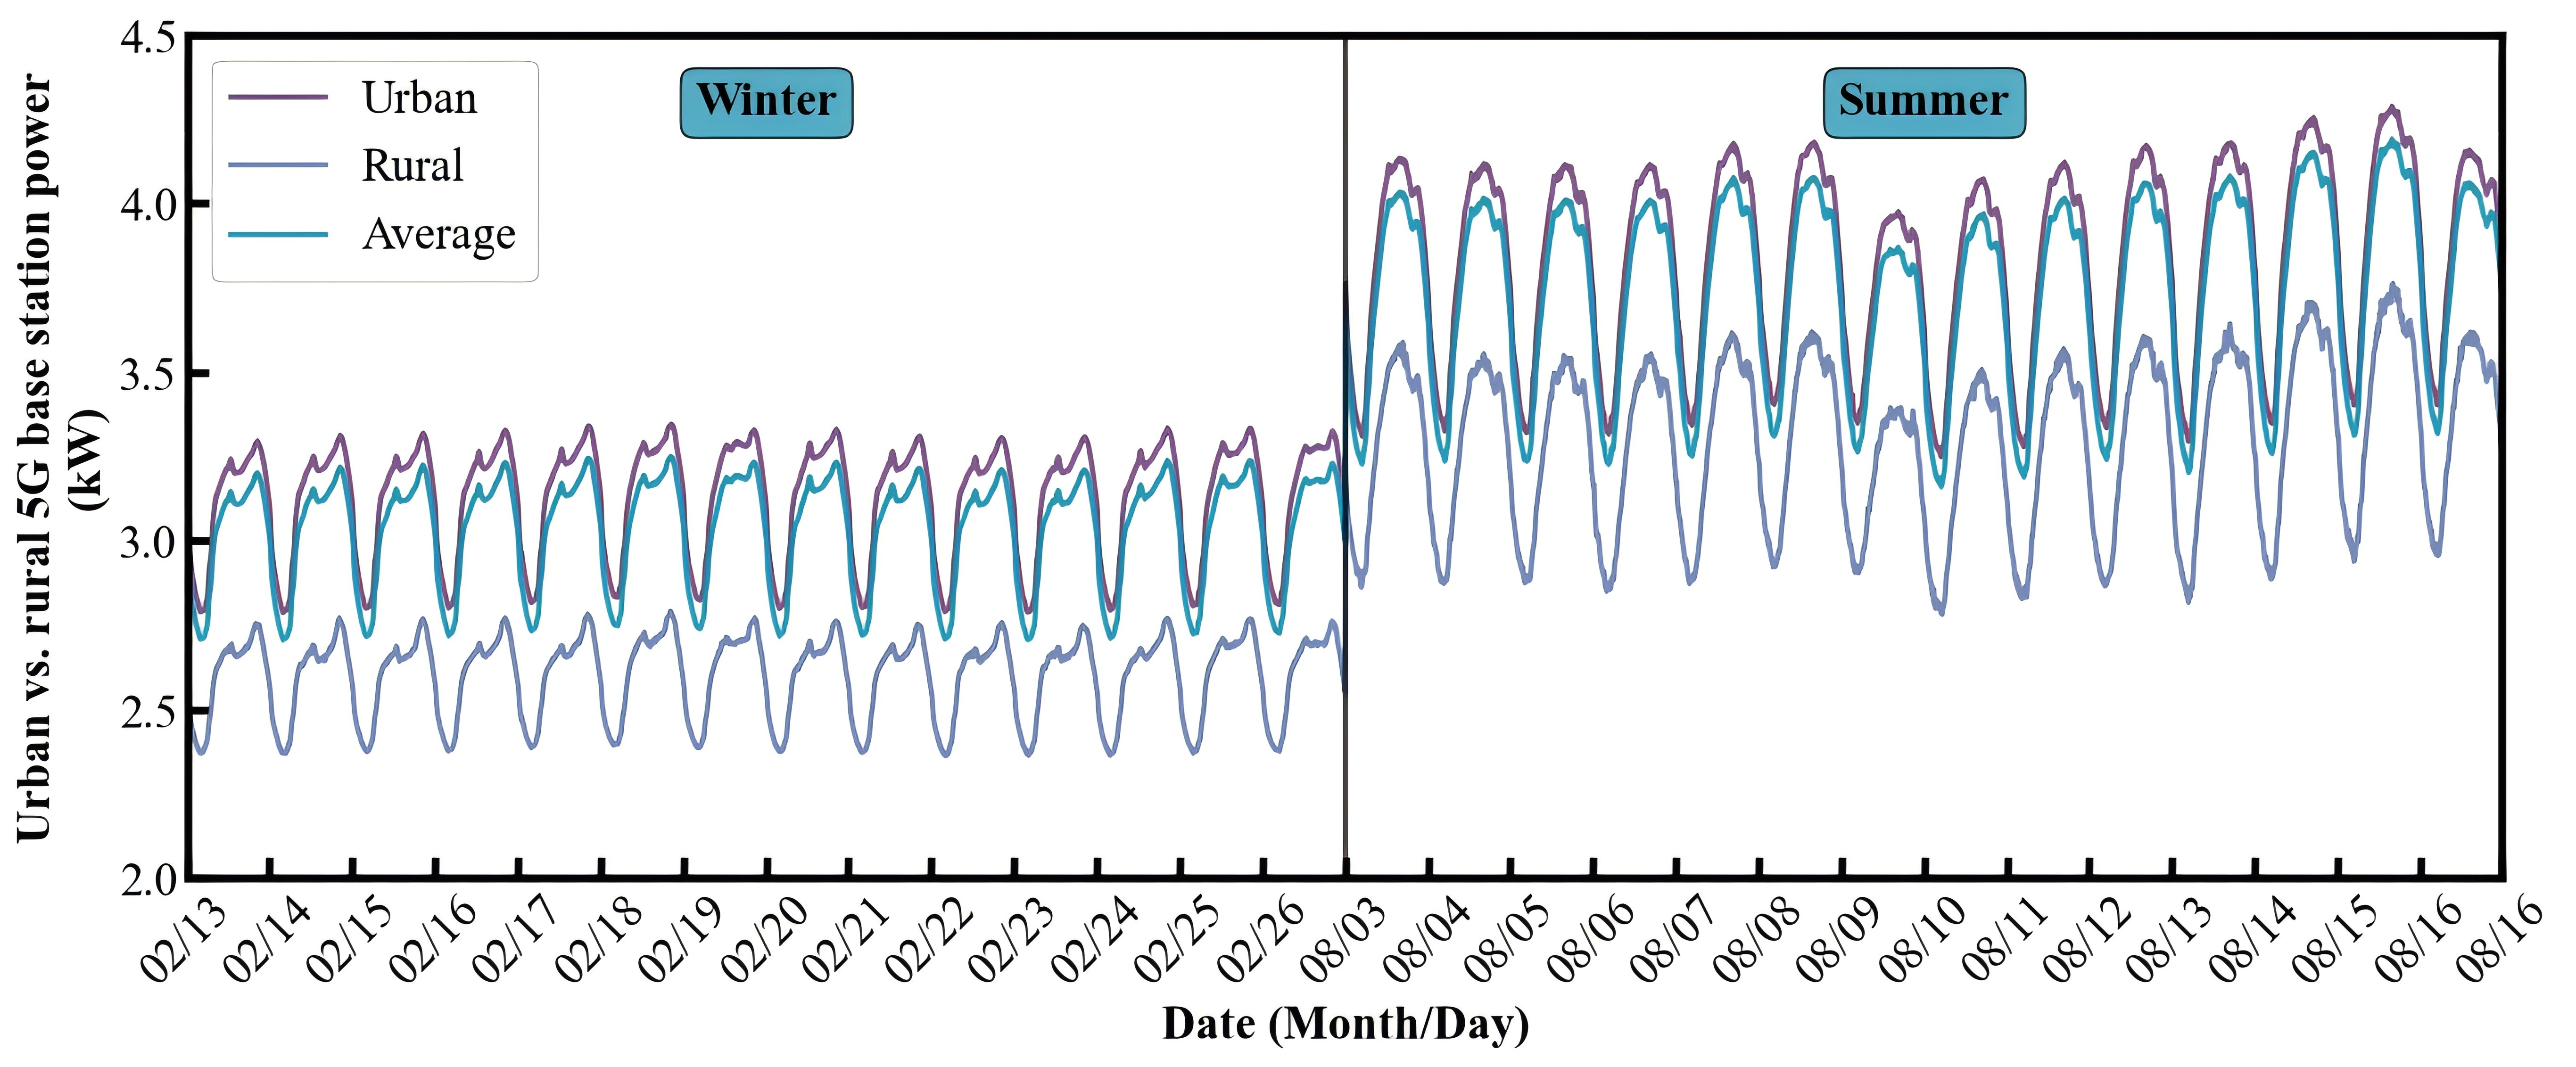
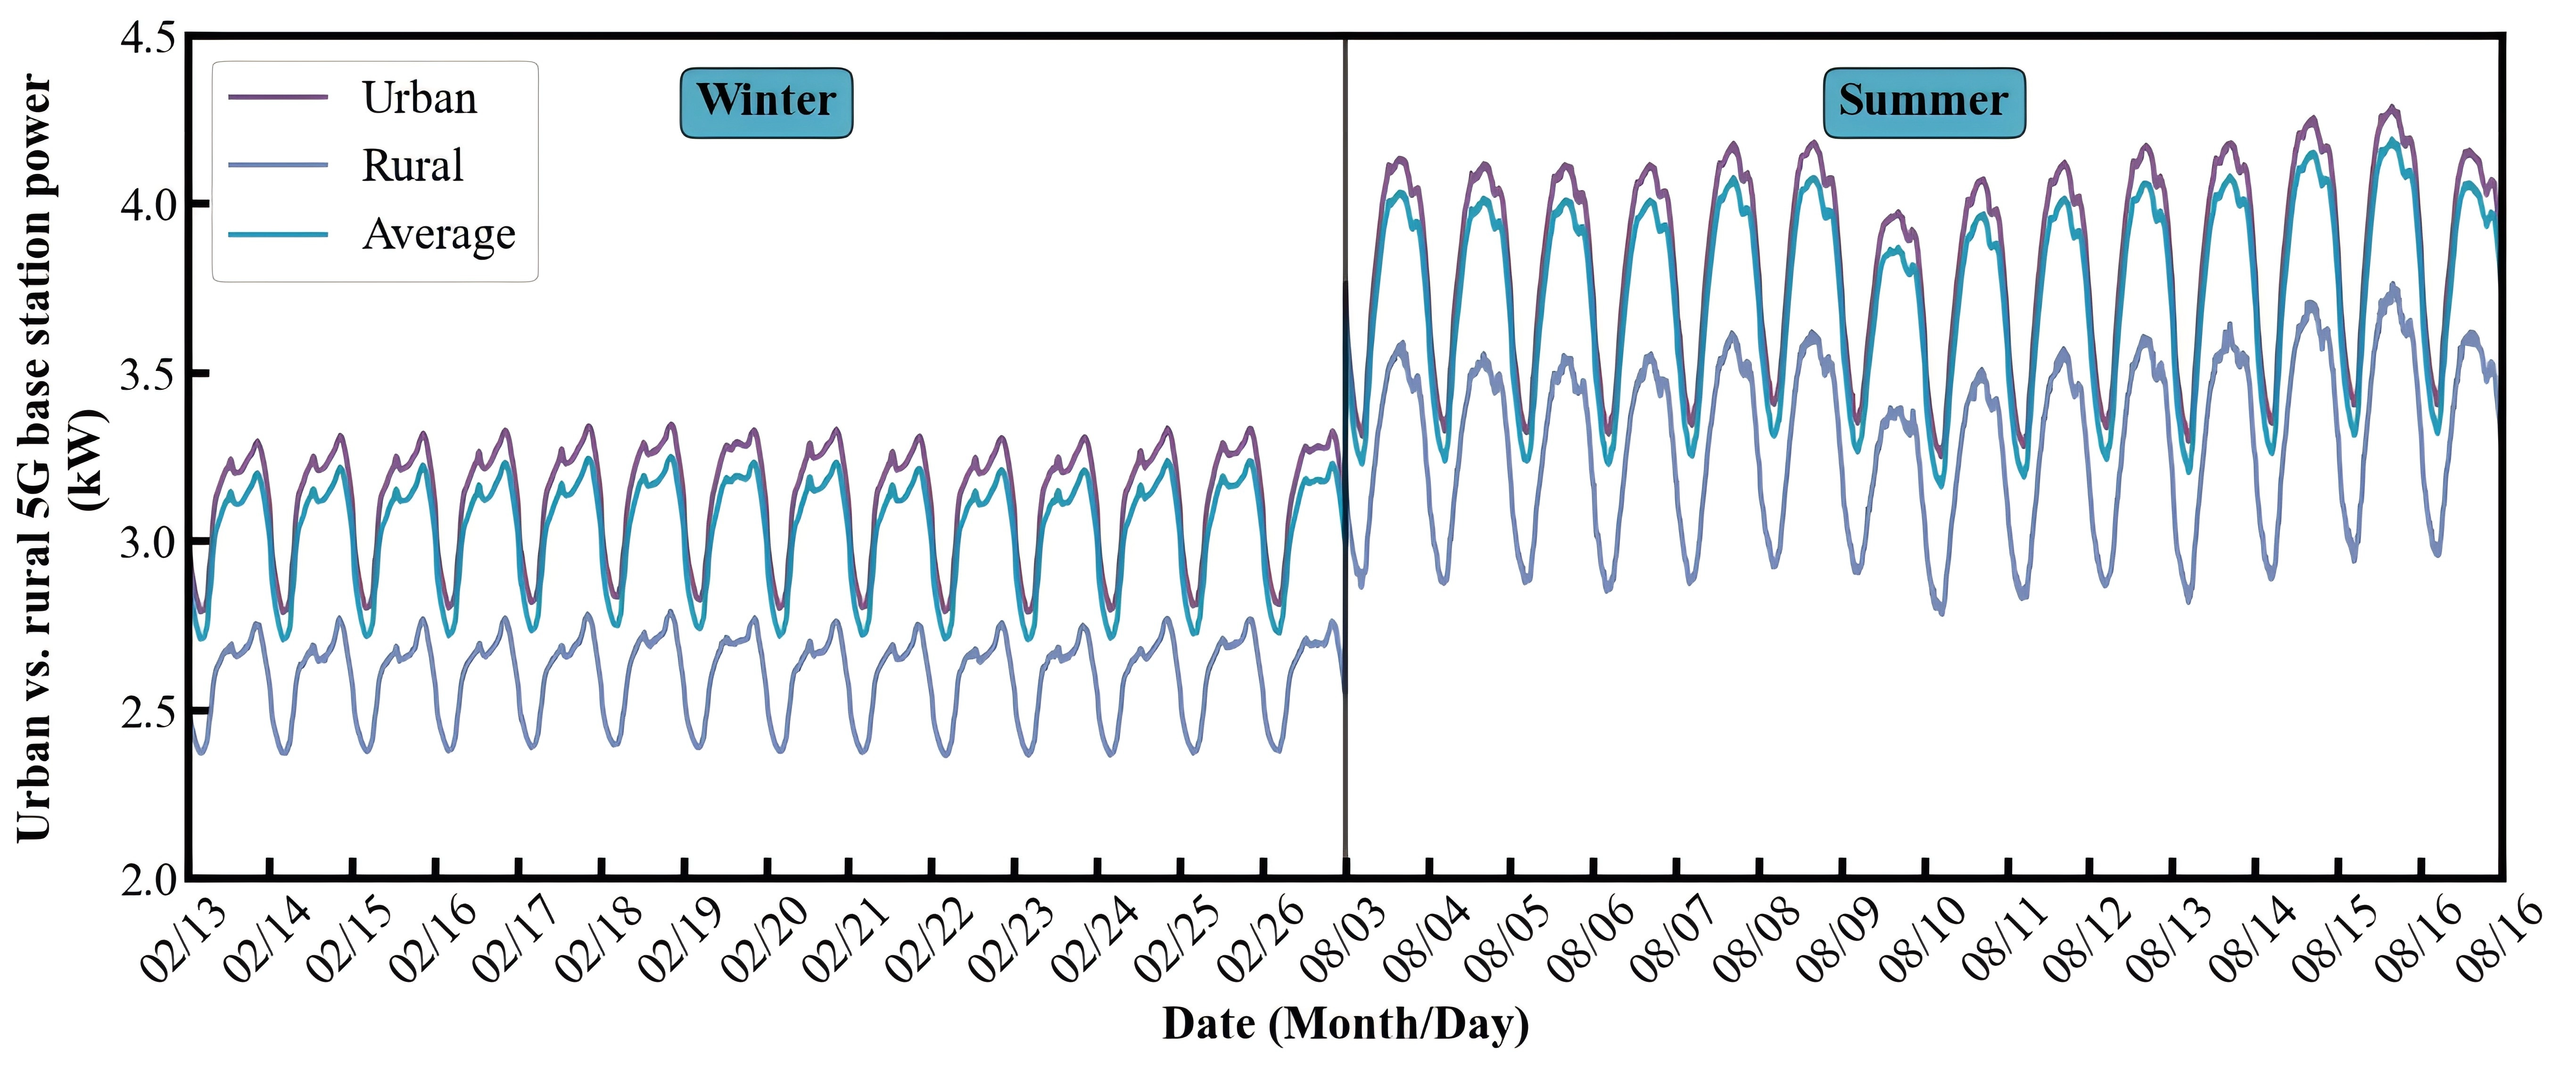
Figure 11. Weekly power consumption patterns of urban and rural 5G base stations in winter and summer.
To identify distinct operational patterns in weekly power consumption, clustering validation analysis was performed, which indicated k = 2 as the optimal number of clusters for weekly load patterns. The analysis consistently identified two distinct groups across both seasons, as shown in Figure 12, with remarkably stable membership. This suggests the data reflect fundamental infrastructure characteristics rather than seasonal variation. In winter, Cluster 1 contains 20,649 stations and Cluster 2 contains 16,876 stations. The summer analysis shows a similar grouping, with 20,616 and 16,909 stations in Clusters 1 and 2, respectively. Cluster 1 consistently exhibits lower load rates between 0.1 and 0.4, while Cluster 2 exhibits higher load rates between 0.2 and 0.6 during both seasons. These two clusters primarily reflect differences in service-area characteristics and user activity intensity. The higher-load cluster typically serves high-traffic urban areas such as business districts, transportation hubs, and densely populated zones, where intensive user activities create pronounced daily load variations and higher baseline consumption. The lower-load cluster predominantly covers areas with lower user density and less intensive network usage, resulting in more stable consumption patterns with smaller daily fluctuations.
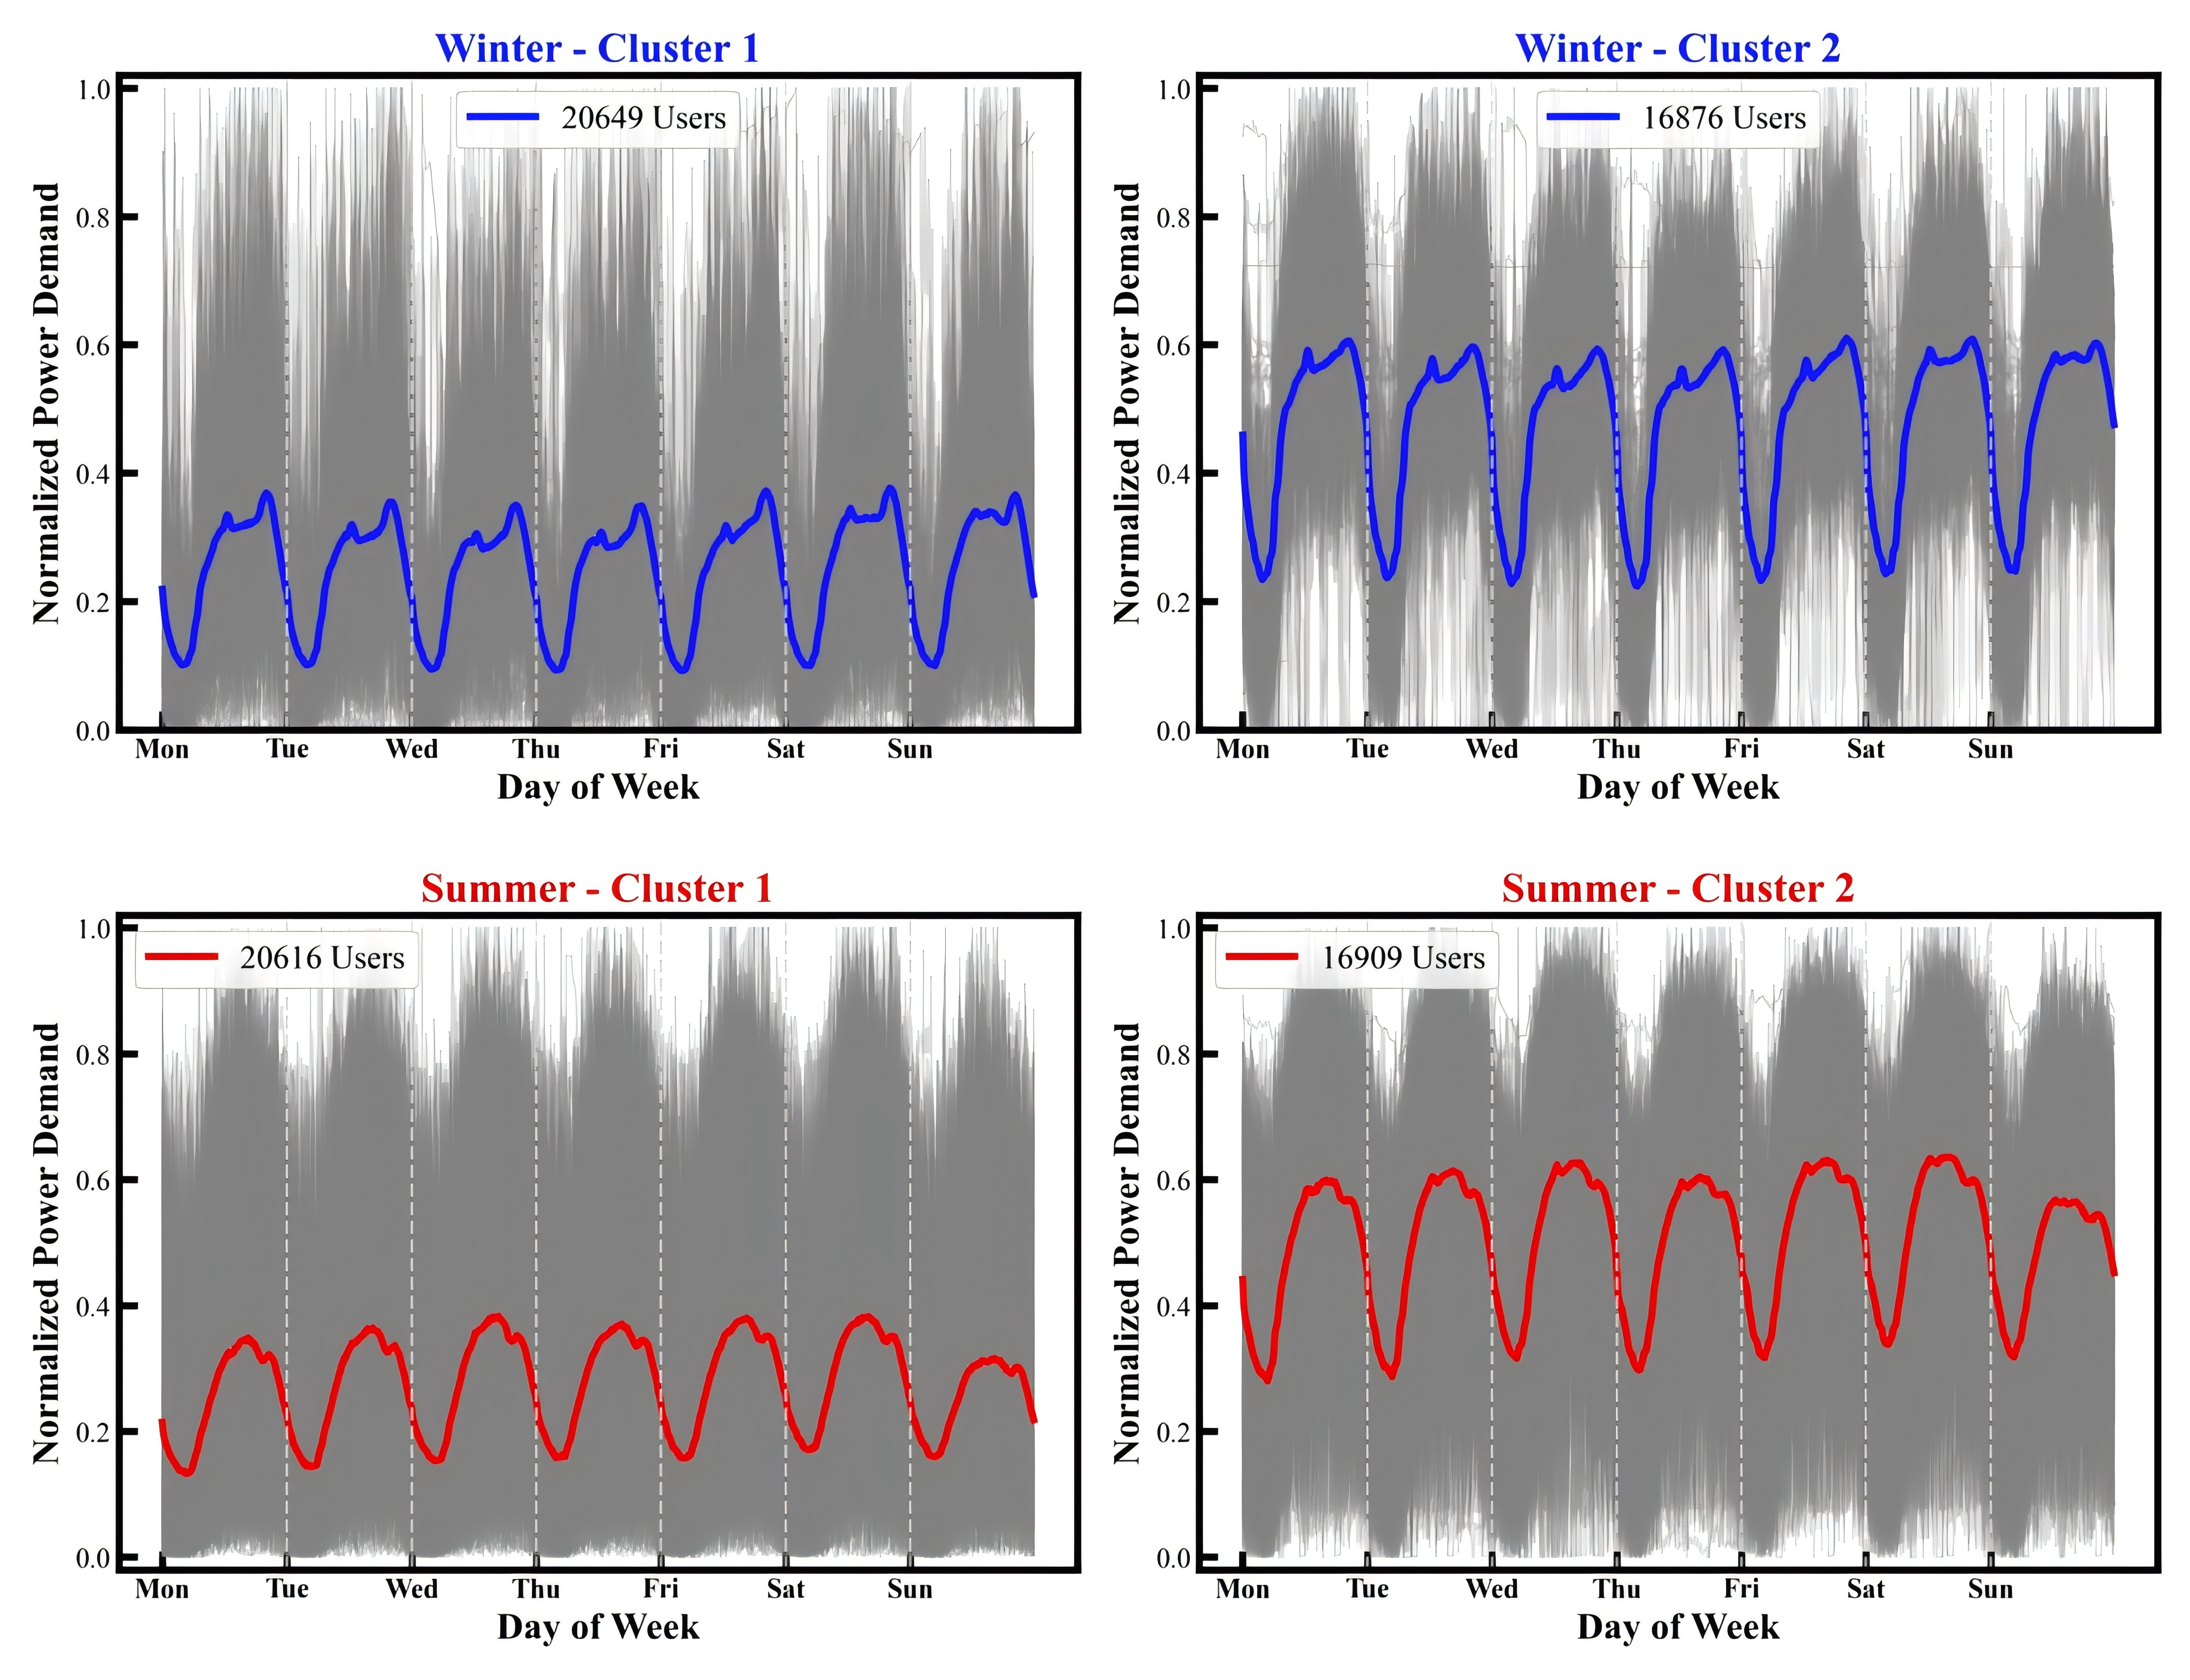
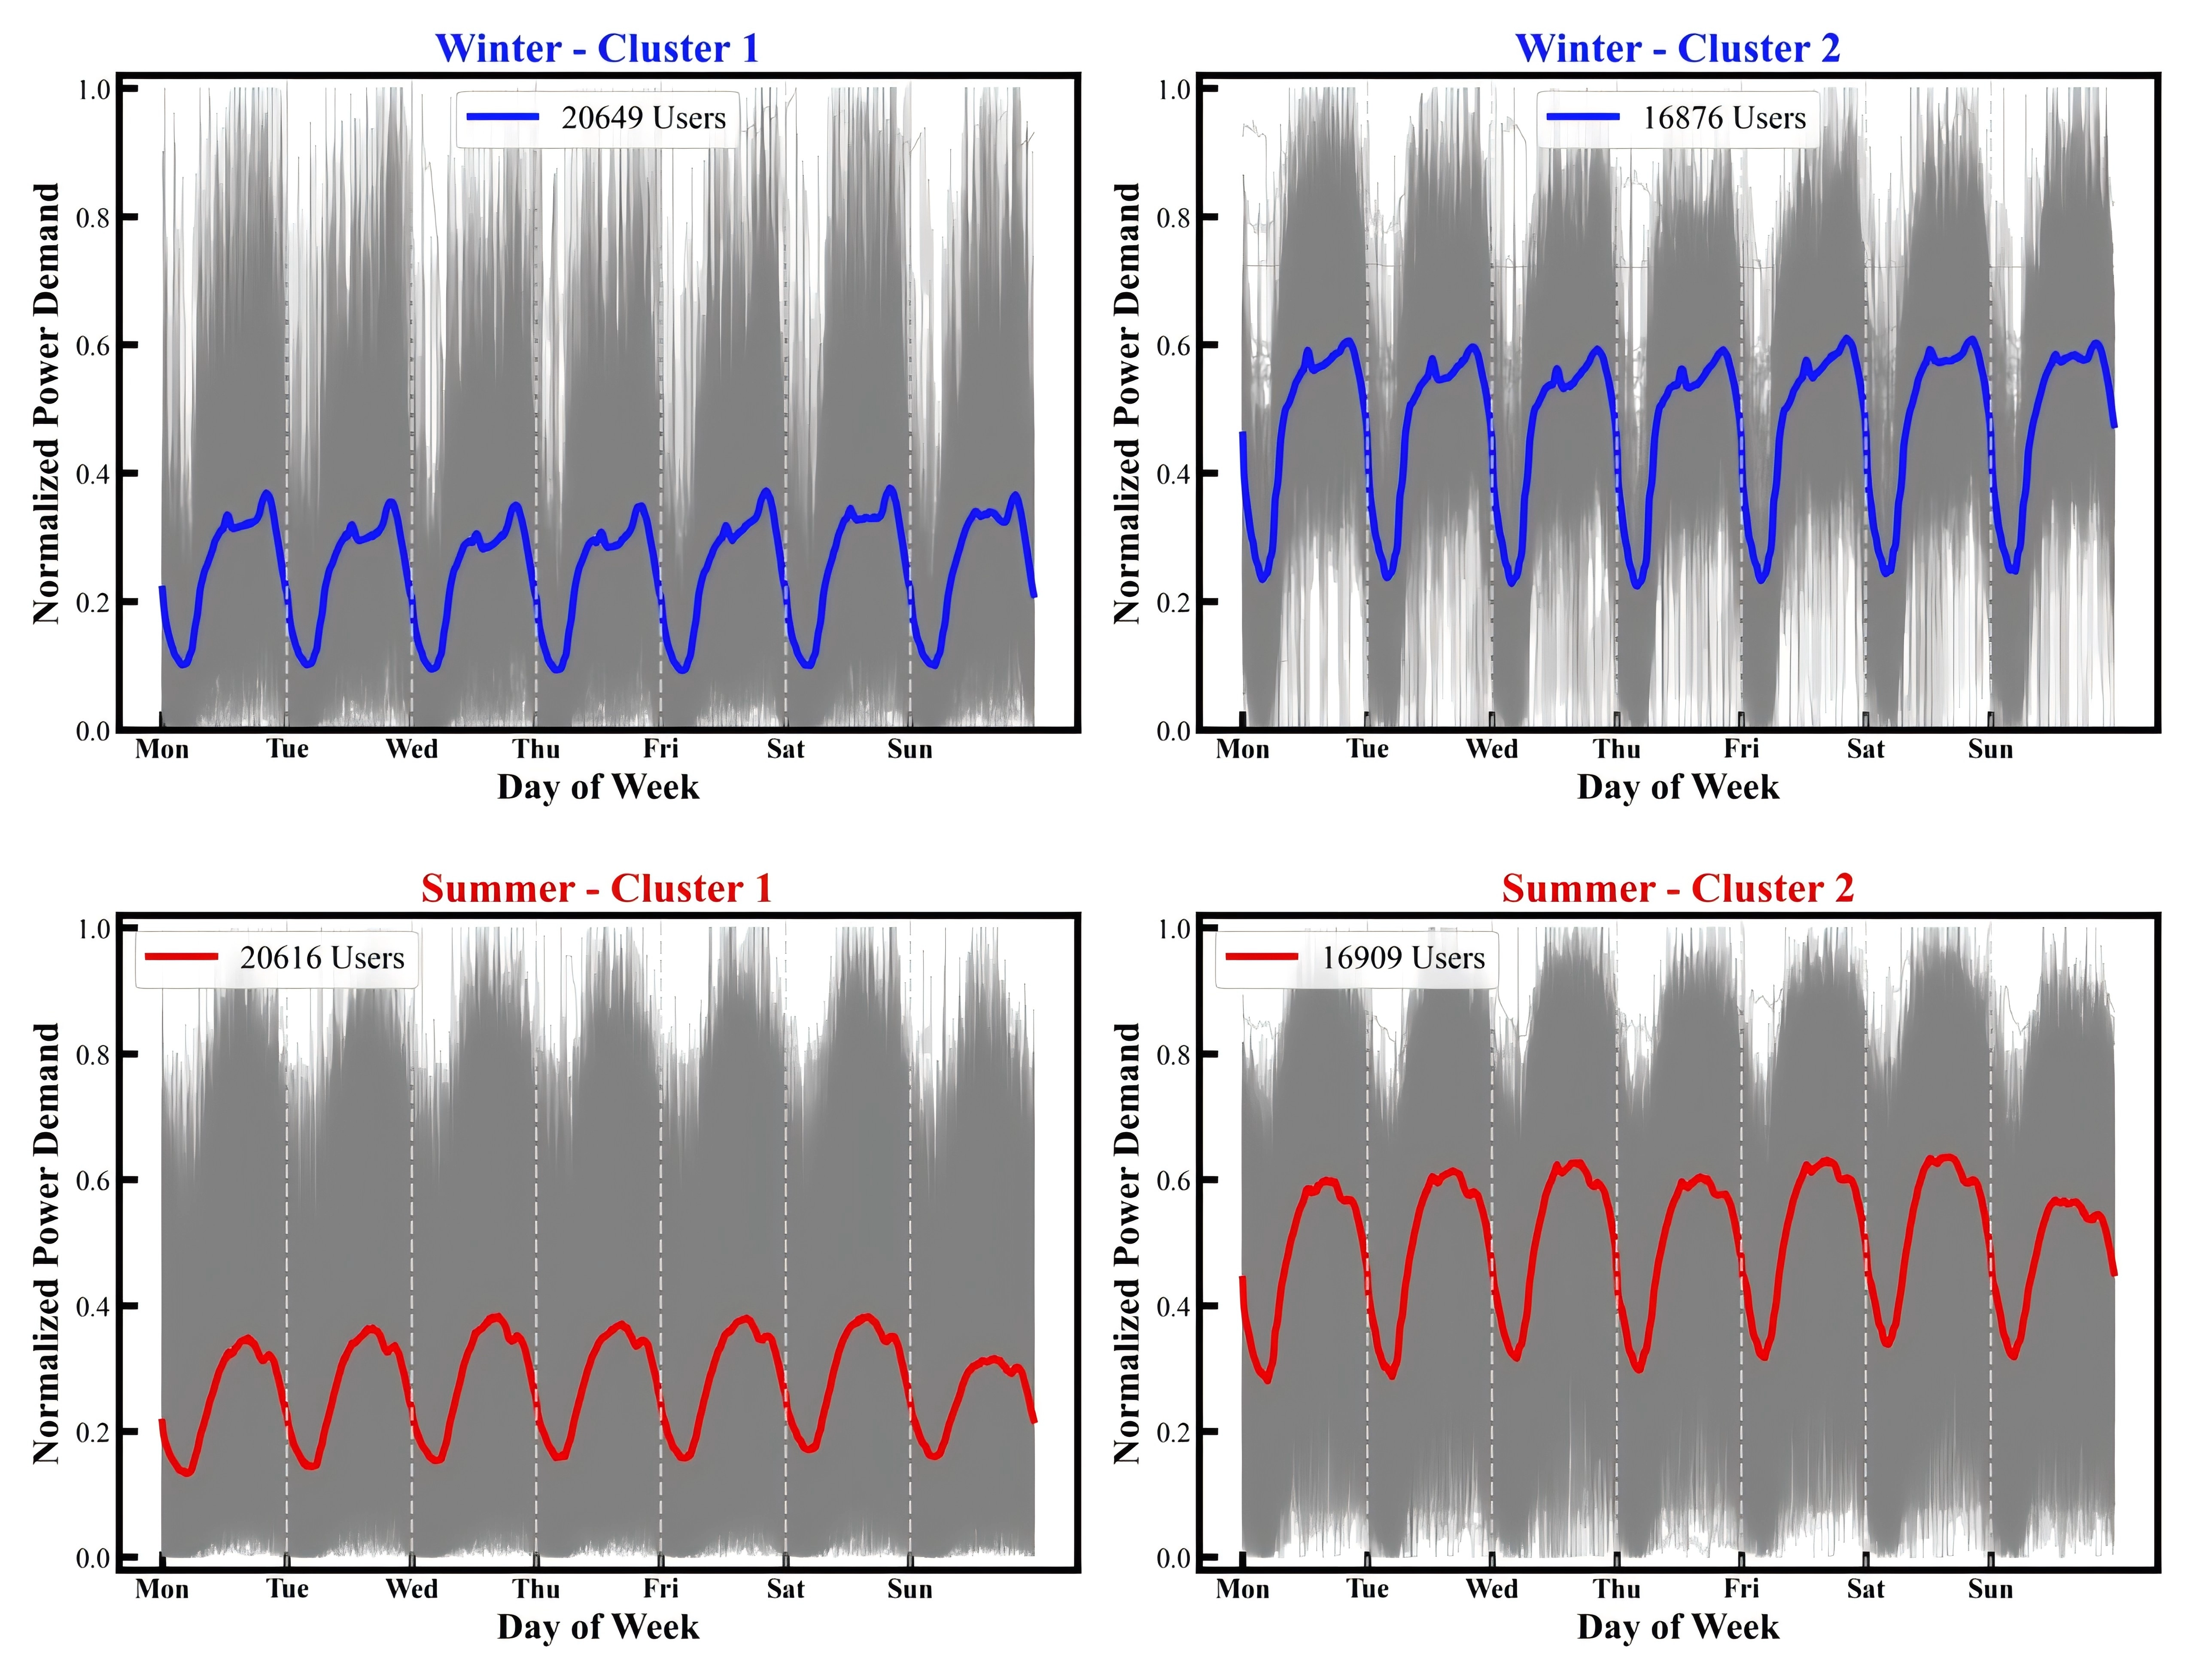
Figure 12. Typical weekly power clustering results of 5G base stations in winter and summer.
The seasonal comparison reveals distinct operational patterns between winter and summer. In winter, the distinction between weekdays and off-days is less pronounced, with a relatively stable usage pattern from Monday to Sunday and slightly lower use on Sundays. The reduction on Sunday can be attributed to fewer people working overtime. Moreover, with many users at home or indoors using Wi-Fi, fewer users connect to 5G base stations, reducing base station load. In terms of intra-day load behavior, 5G base station load is lower between 2 AM and 5 AM and increases thereafter. The daily load shows two peaks, from 12 PM to 1 PM and from 5:30 PM to 6:30 PM, reflecting that more users access the network on mobile phones during breaks. After 5 PM, the curve gradually declines, likely because users return home and switch to home Wi-Fi, reducing the base station connection rate. However, summer operational patterns differ significantly from winter. The weekly load distribution exhibits more pronounced variations, with relatively consistent consumption from Monday to Saturday but notably lower levels on Sundays. This stronger weekend effect reflects people's daily routines; in many organizations, more people work overtime on Saturdays than Sundays, so Saturday and weekday loads are similar. On Sundays, more users rest at home or are involved in indoor activities, especially in the hot summer months, resulting in lower 5G network usage and reduced load. Intra-day load characteristics in summer differ significantly from those in winter, with lower loads from 2 AM to 5 AM and sustained higher loads from 12 PM to 7 PM, without the two distinct peaks particularly noticeable in winter. This change is mainly due to air conditioners, which are less efficient and draw higher loads when outdoor temperatures are high at noon. Although the number of connected users decreases in the middle of the day, higher outdoor temperatures reduce air-conditioning efficiency, increasing power consumption and masking typical user-driven load variations.
Analyzing the relationship between the geographical distribution and load patterns provides further insights into 5G network characteristics. As shown in Figure 13, the Sankey diagrams reveal significant spatial patterns in 5G base station load distributions. Urban areas (84.4% of stations) exhibit a nearly balanced distribution between low- and high-load installations (44.4% vs. 40.0%). In comparison, rural areas (15.6% of stations) show a clear predominance of low-load stations (10.6% vs. 5.0%), creating a 2:1 ratio. This pattern remains stable across seasons (±0.04% variation), indicating structural rather than weather-dependent characteristics. The urban load balance reflects diverse functional zones: business districts generate high loads while residential areas produce lower loads, creating mixed operational profiles within urban networks. Rural areas exhibit uniformly low loads due to consistently low user density. This spatial-load coupling creates asymmetric urban grid requirements: urban networks must accommodate both high absolute demand and operational diversity, while rural networks benefit from predictable, homogeneous load patterns. Consequently, urban grid integration strategies for 5G infrastructure require differentiated approaches that account for fundamental differences in both load magnitude and operational heterogeneity across urban-rural contexts.
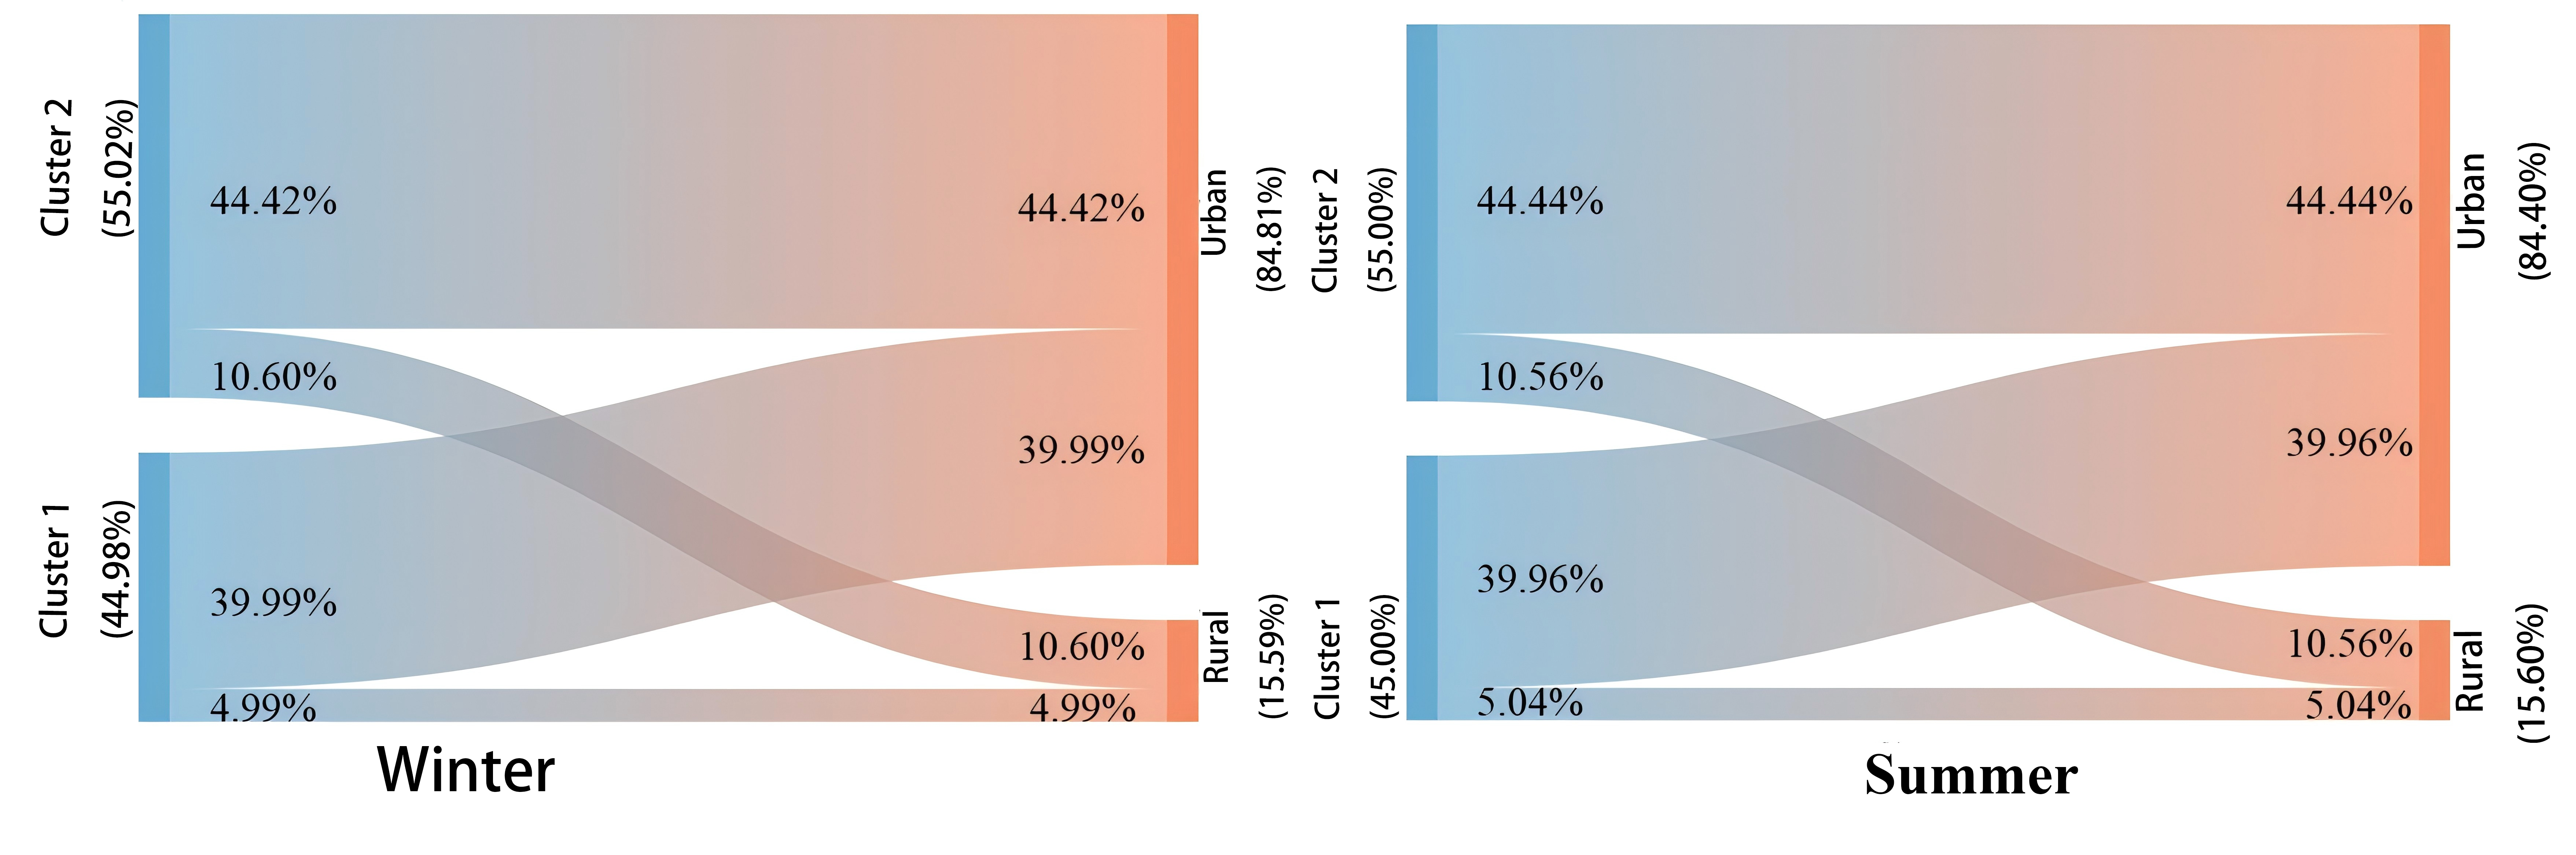
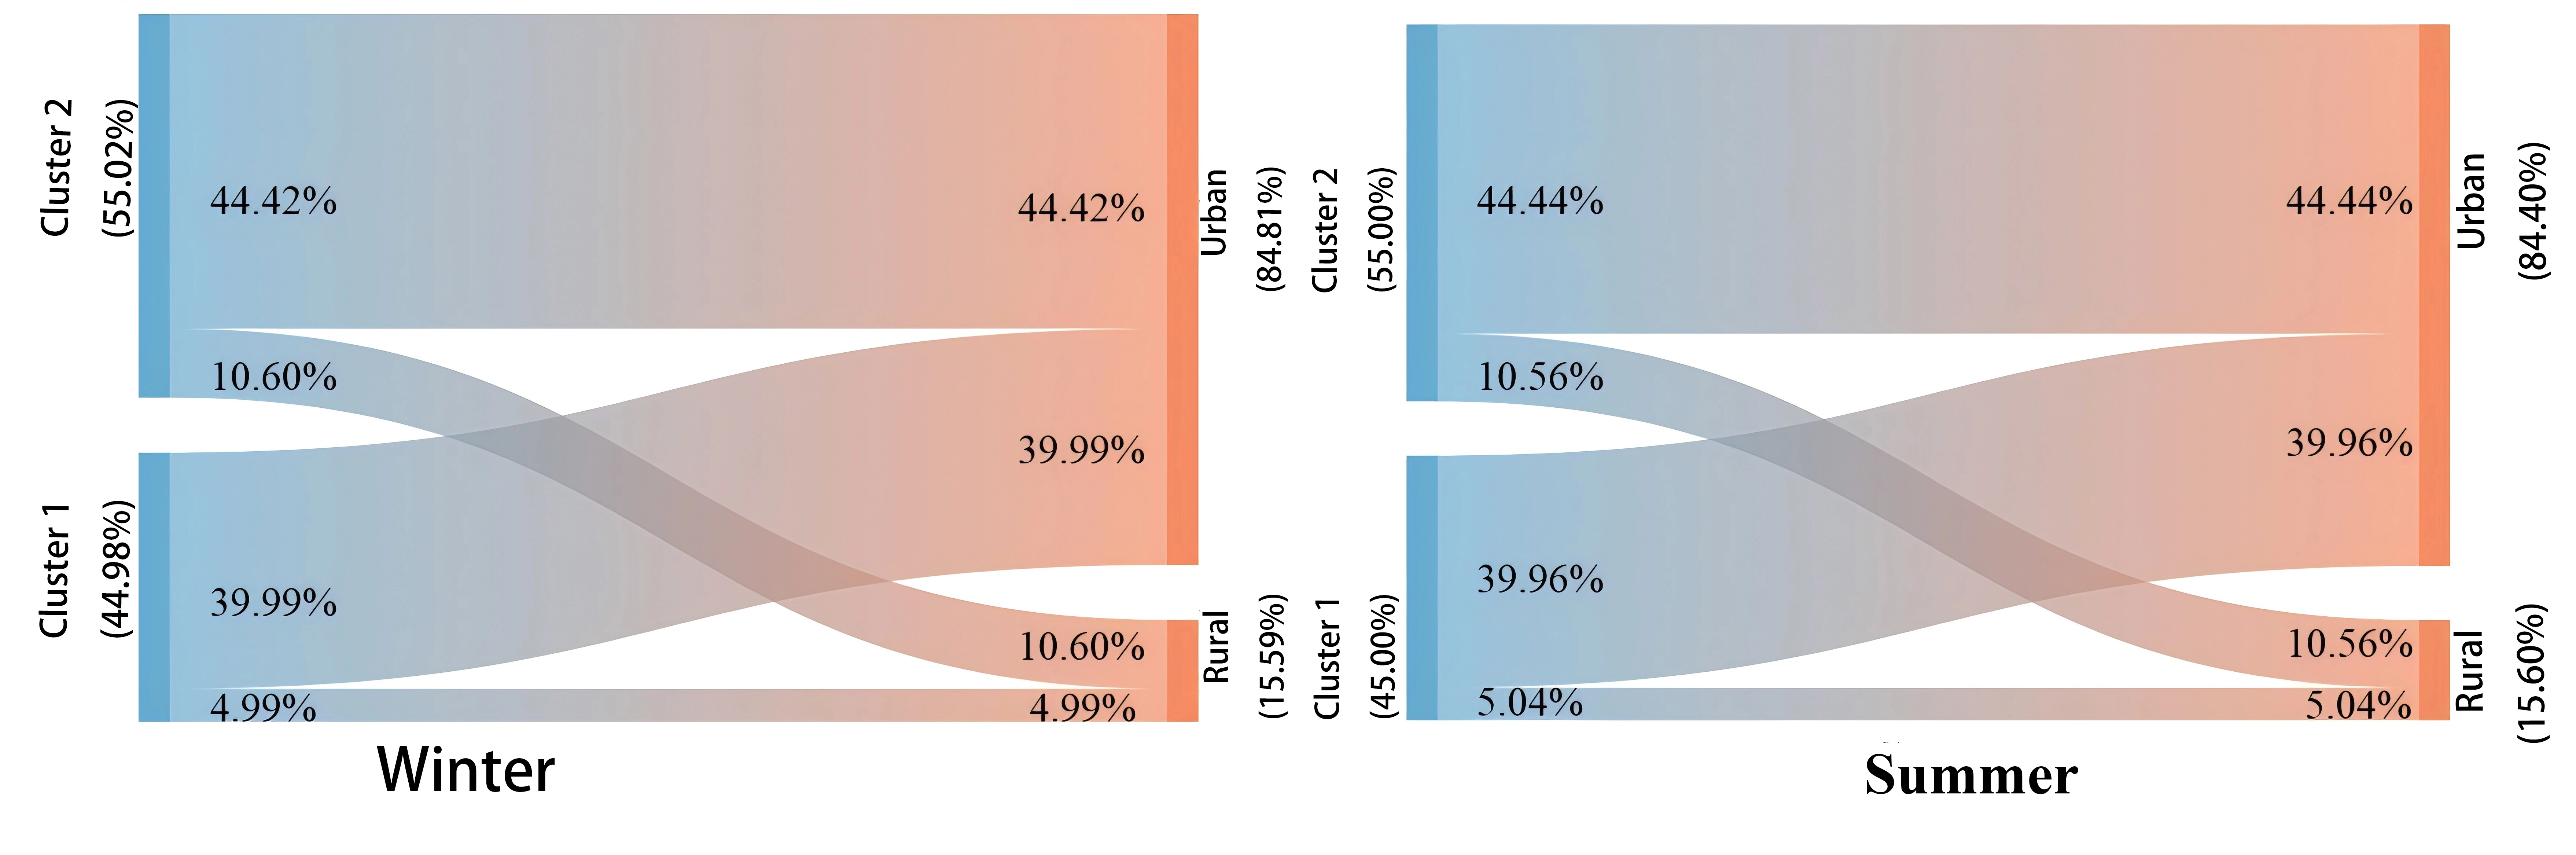
Figure 13. Sankey diagram showing the relationship between geographical distribution and load patterns of 5G base stations.
4.2.3 Capacity utilization rate analysis
Beyond understanding load patterns, analyzing the operational efficiency of 5G base stations is crucial for urban energy infrastructure planning, network optimization, and resource management. Capacity utilization rate, defined as the ratio of actual power consumption to maximum operational capacity, provides insights into infrastructure efficiency and optimization potential within the urban energy system. The monthly capacity utilization rates exhibit remarkable stability with moderate seasonal variations, as shown in Figure 14. These rates fluctuate between 30% and 36% throughout the year, with the lowest utilization in February. Figure 15 shows the hourly average capacity utilization rate. In winter, the capacity utilization rates fluctuate between 26% and 31%, with rural base stations operating at 24%-28% and urban installations exhibiting higher efficiency at 27%-32%. Summer rates show greater variation, ranging from 31% to 40%, with rural stations increasing to 29%-37% and urban areas reaching 31%-40%. The consistently higher urban utilization rates reflect fundamental differences in user density and network traffic patterns, with urban areas serving higher user concentrations and data volumes. The consistently low utilization rates across all temporal scales indicate substantial infrastructure redundancy, representing untapped flexibility within the urban energy system and suggesting opportunities for capacity optimization while maintaining the operational resilience required for telecommunications networks.
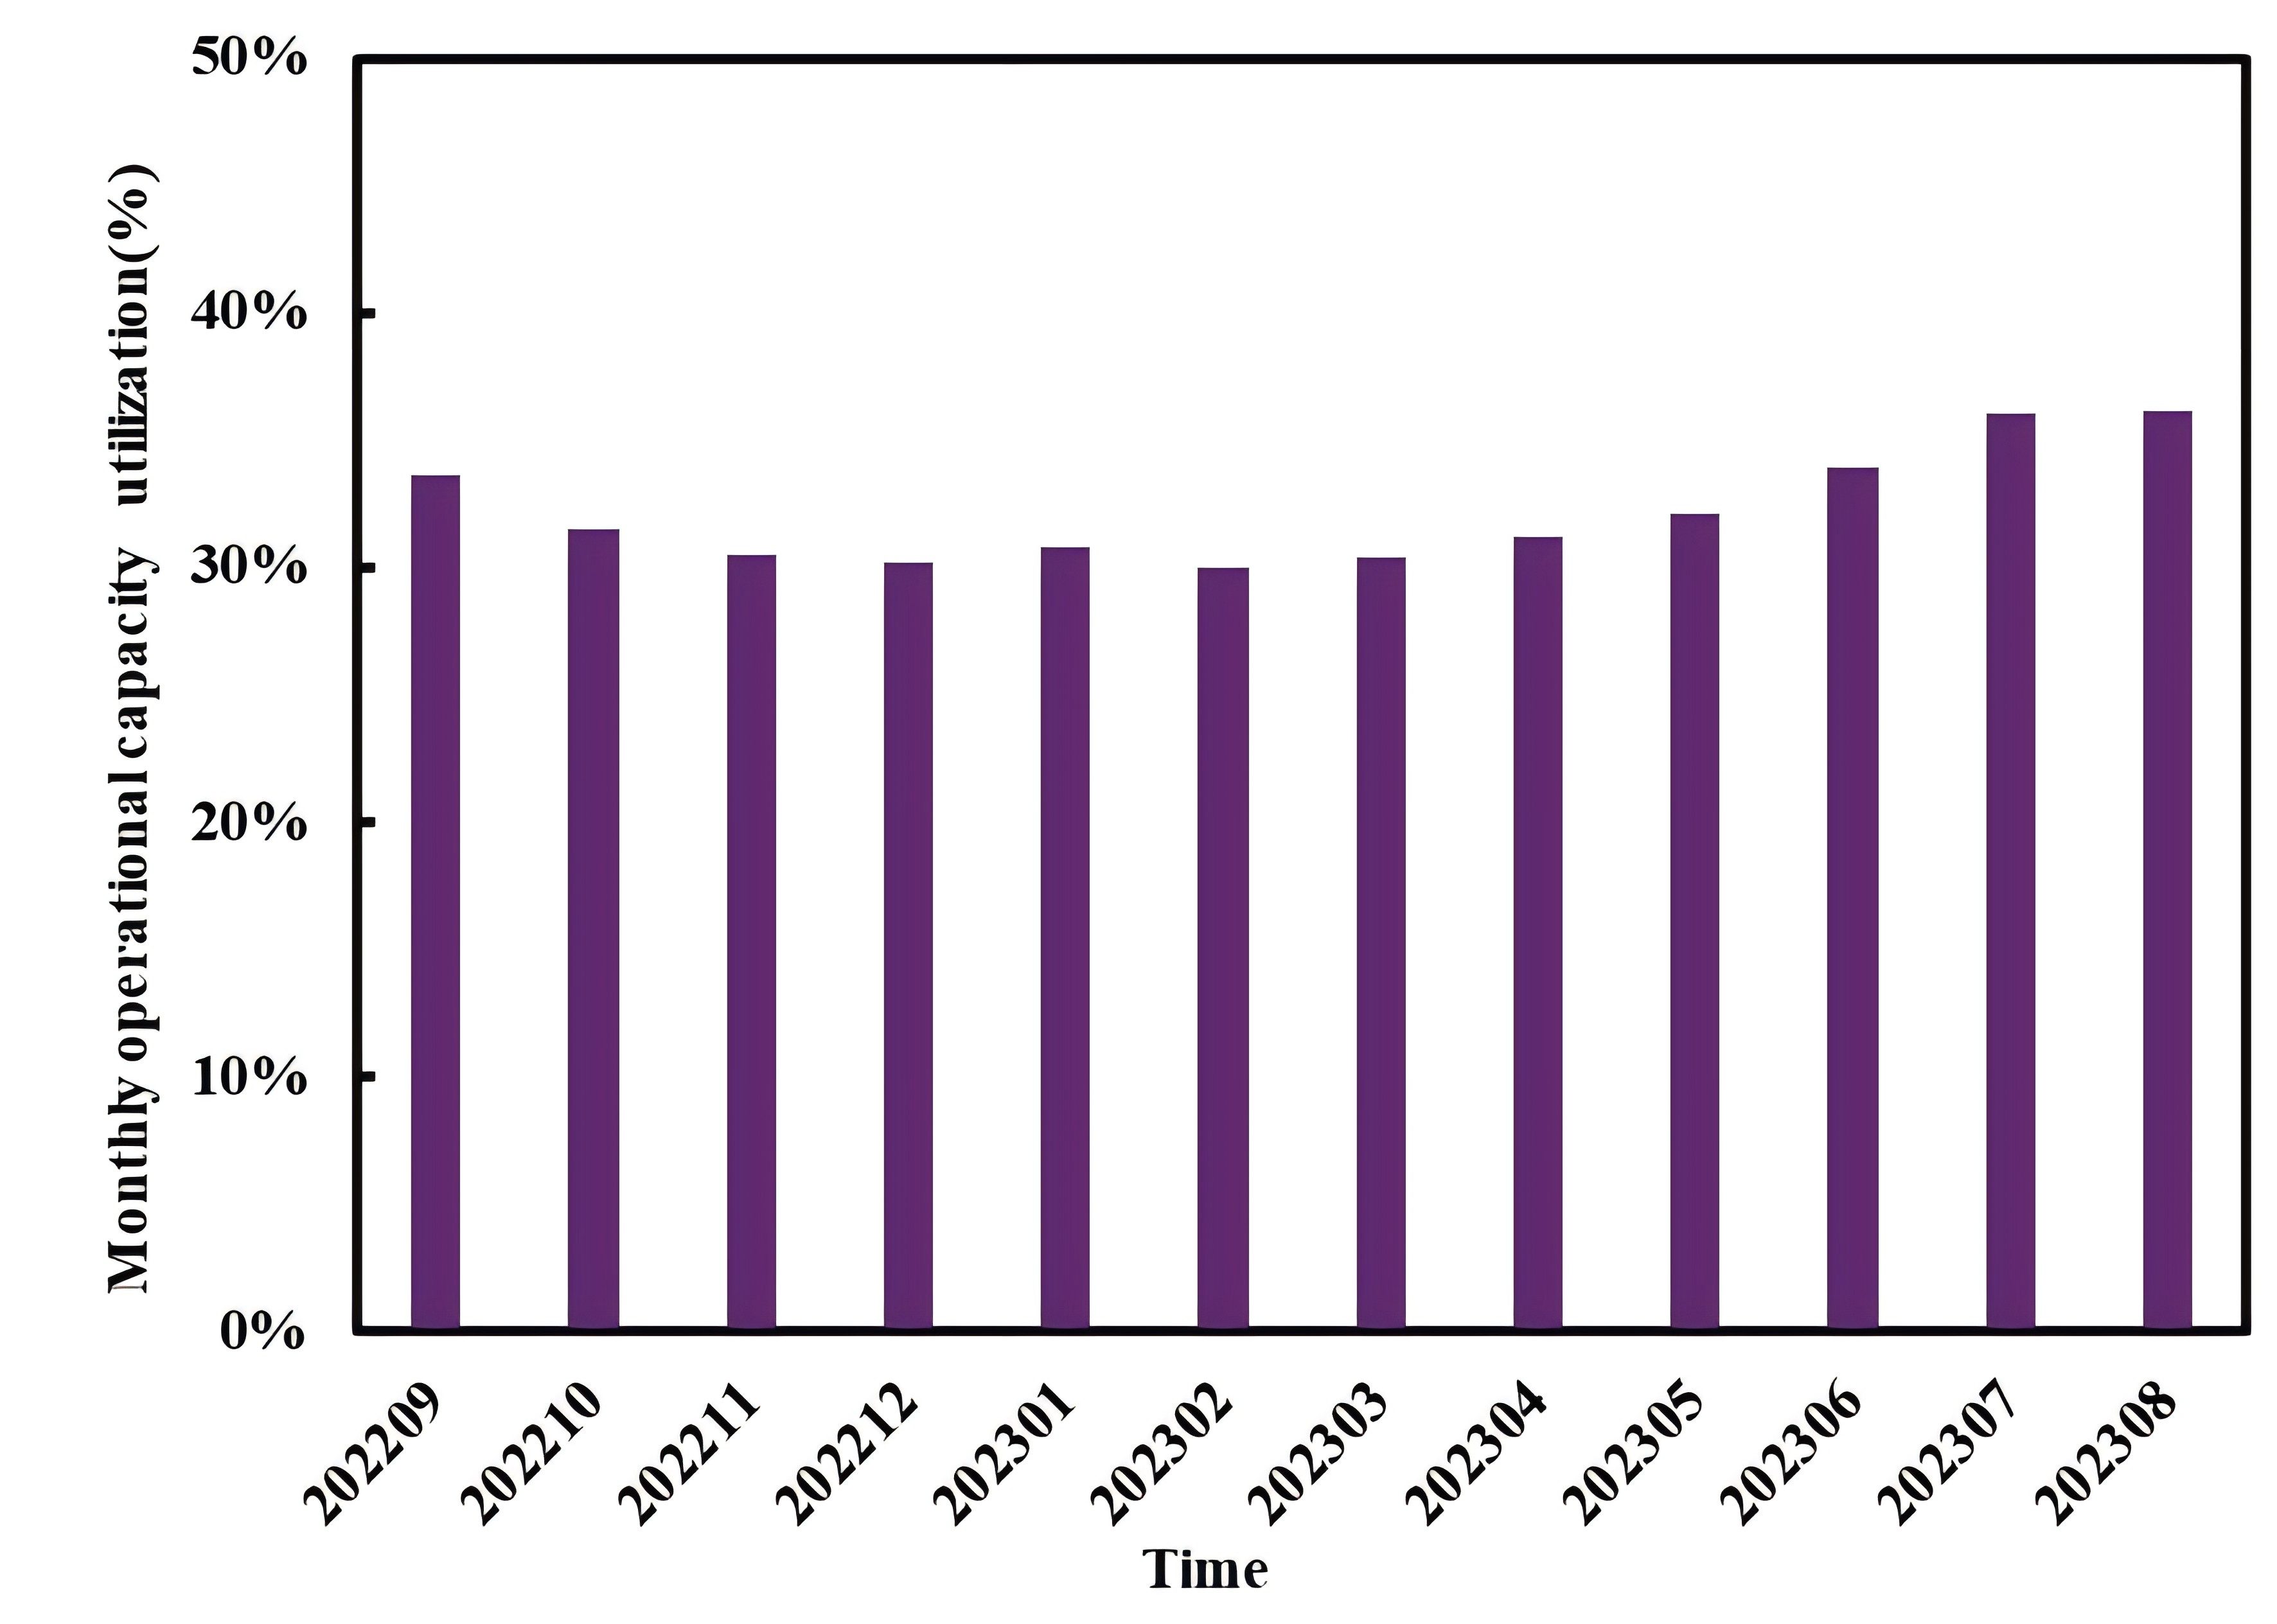
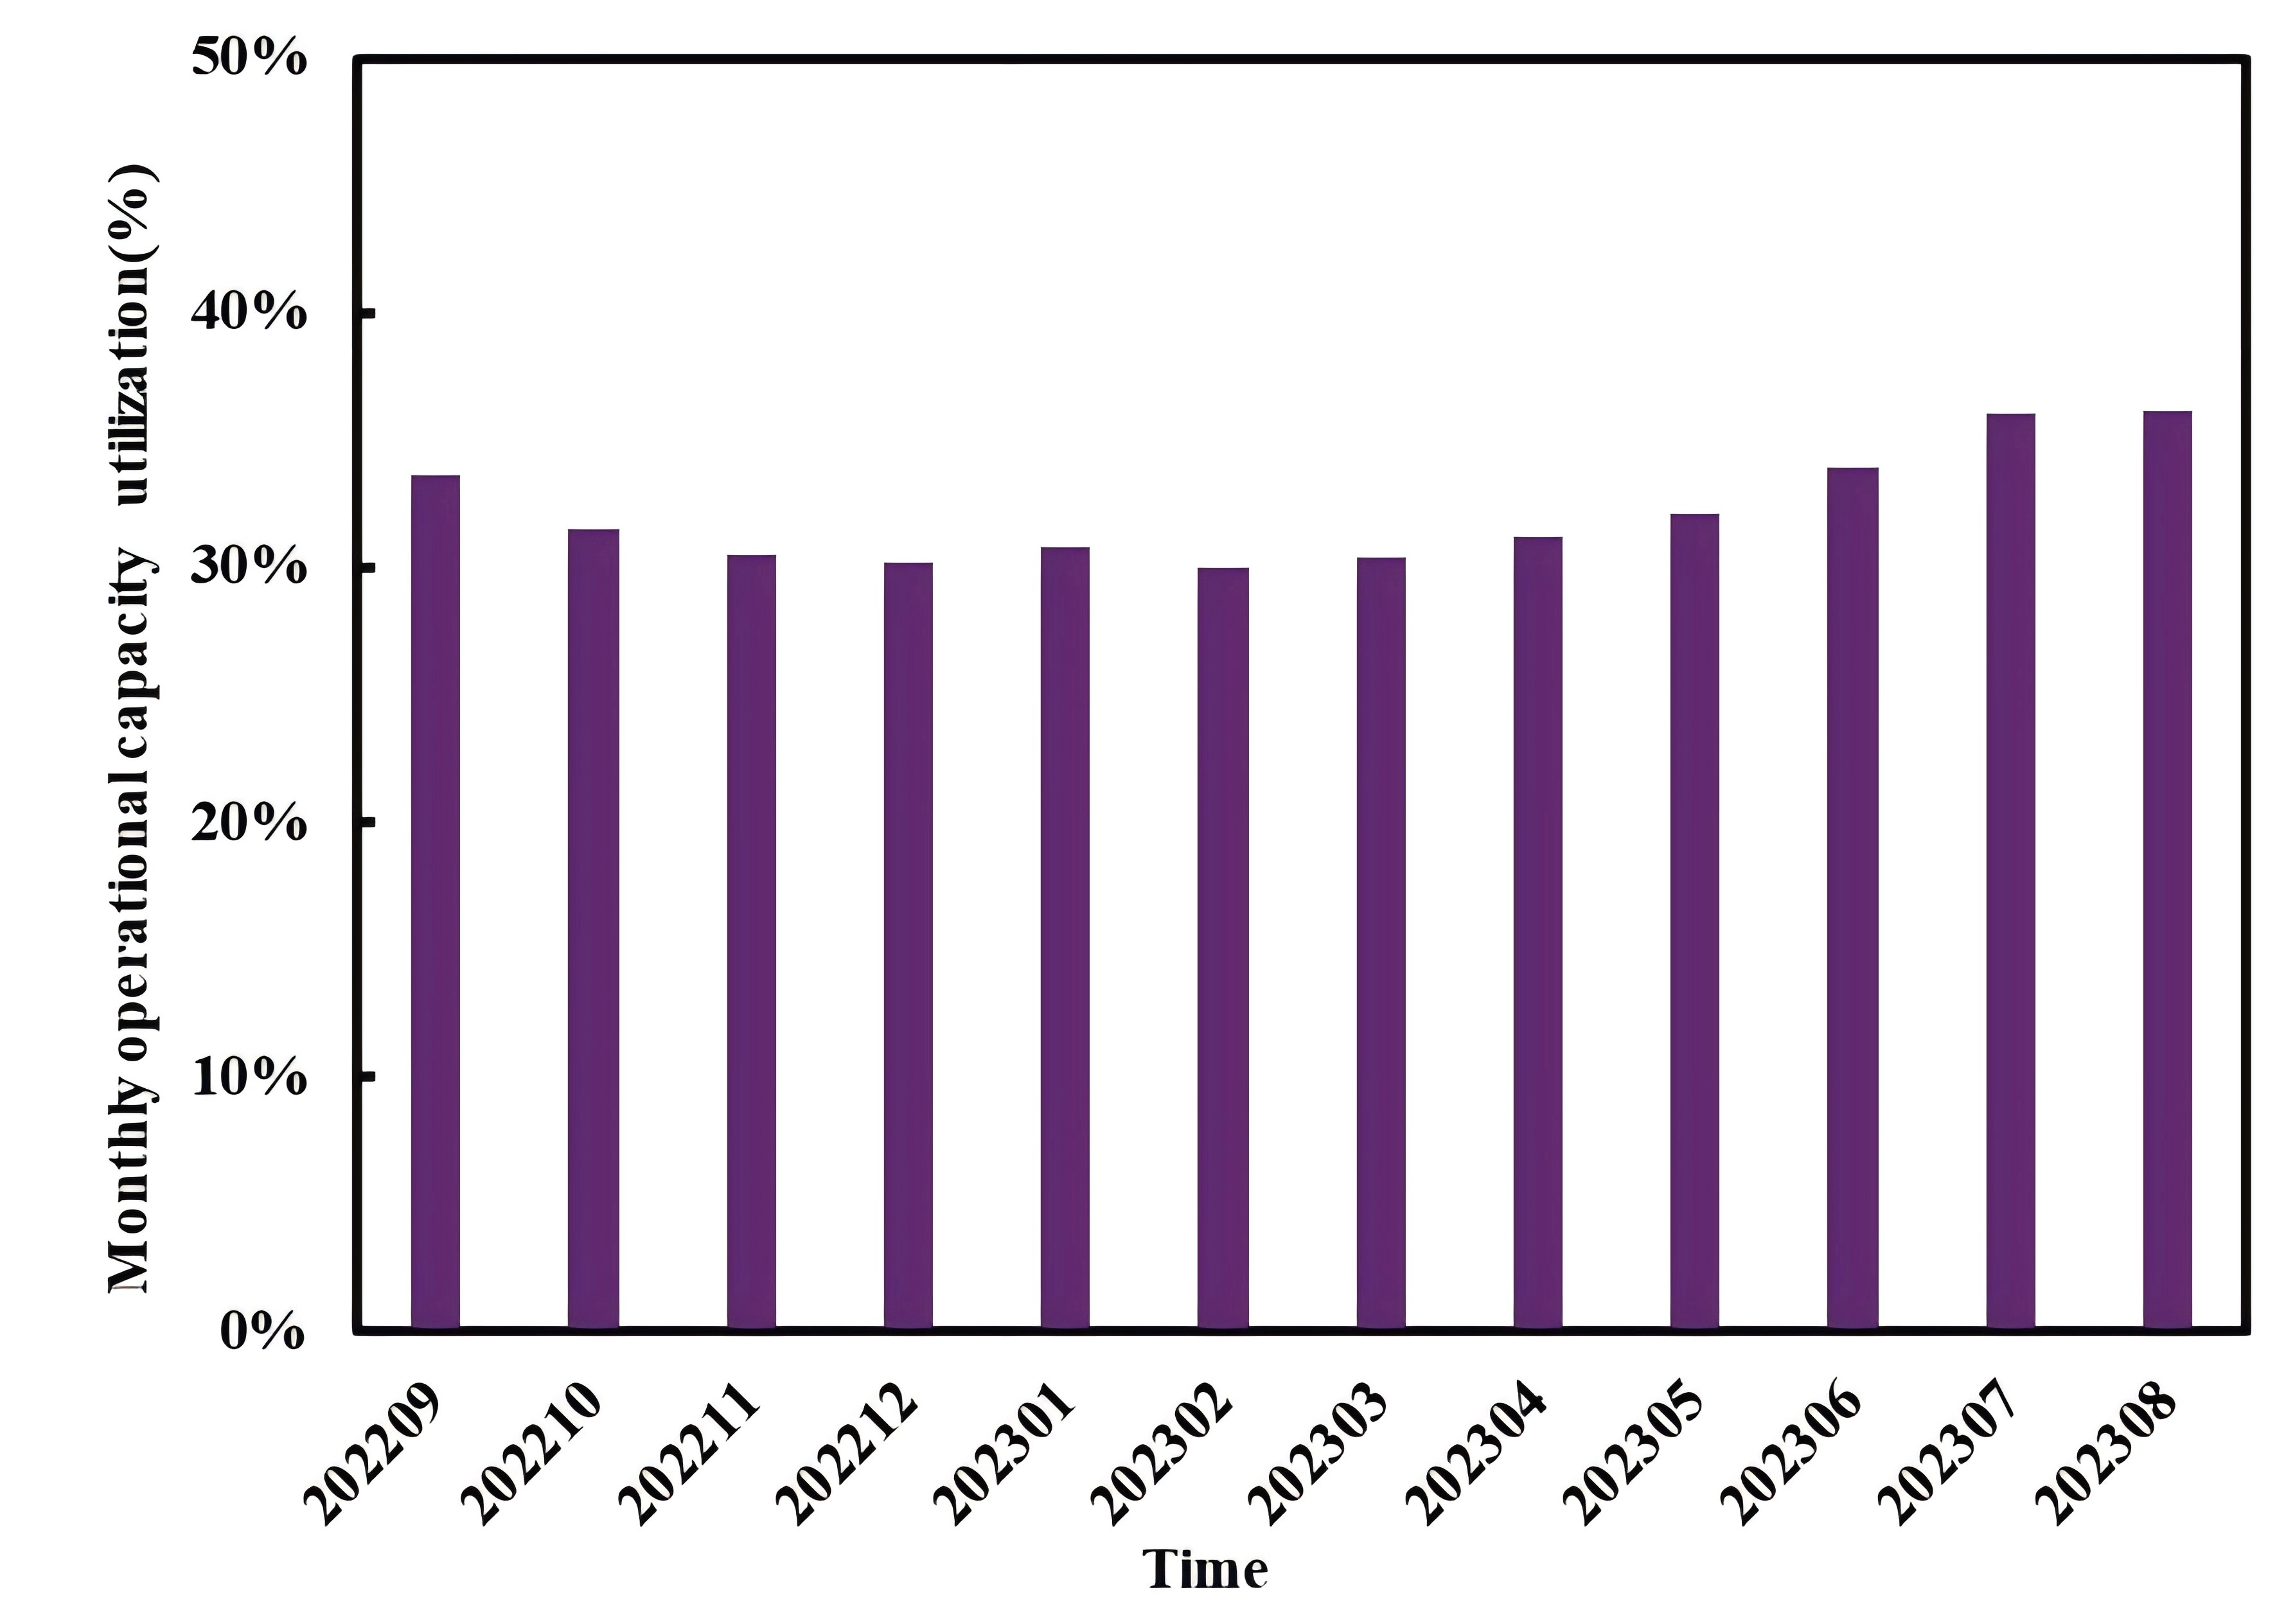
Figure 14. Monthly capacity utilization rates of 5G base stations from September 2022 to August 2023.
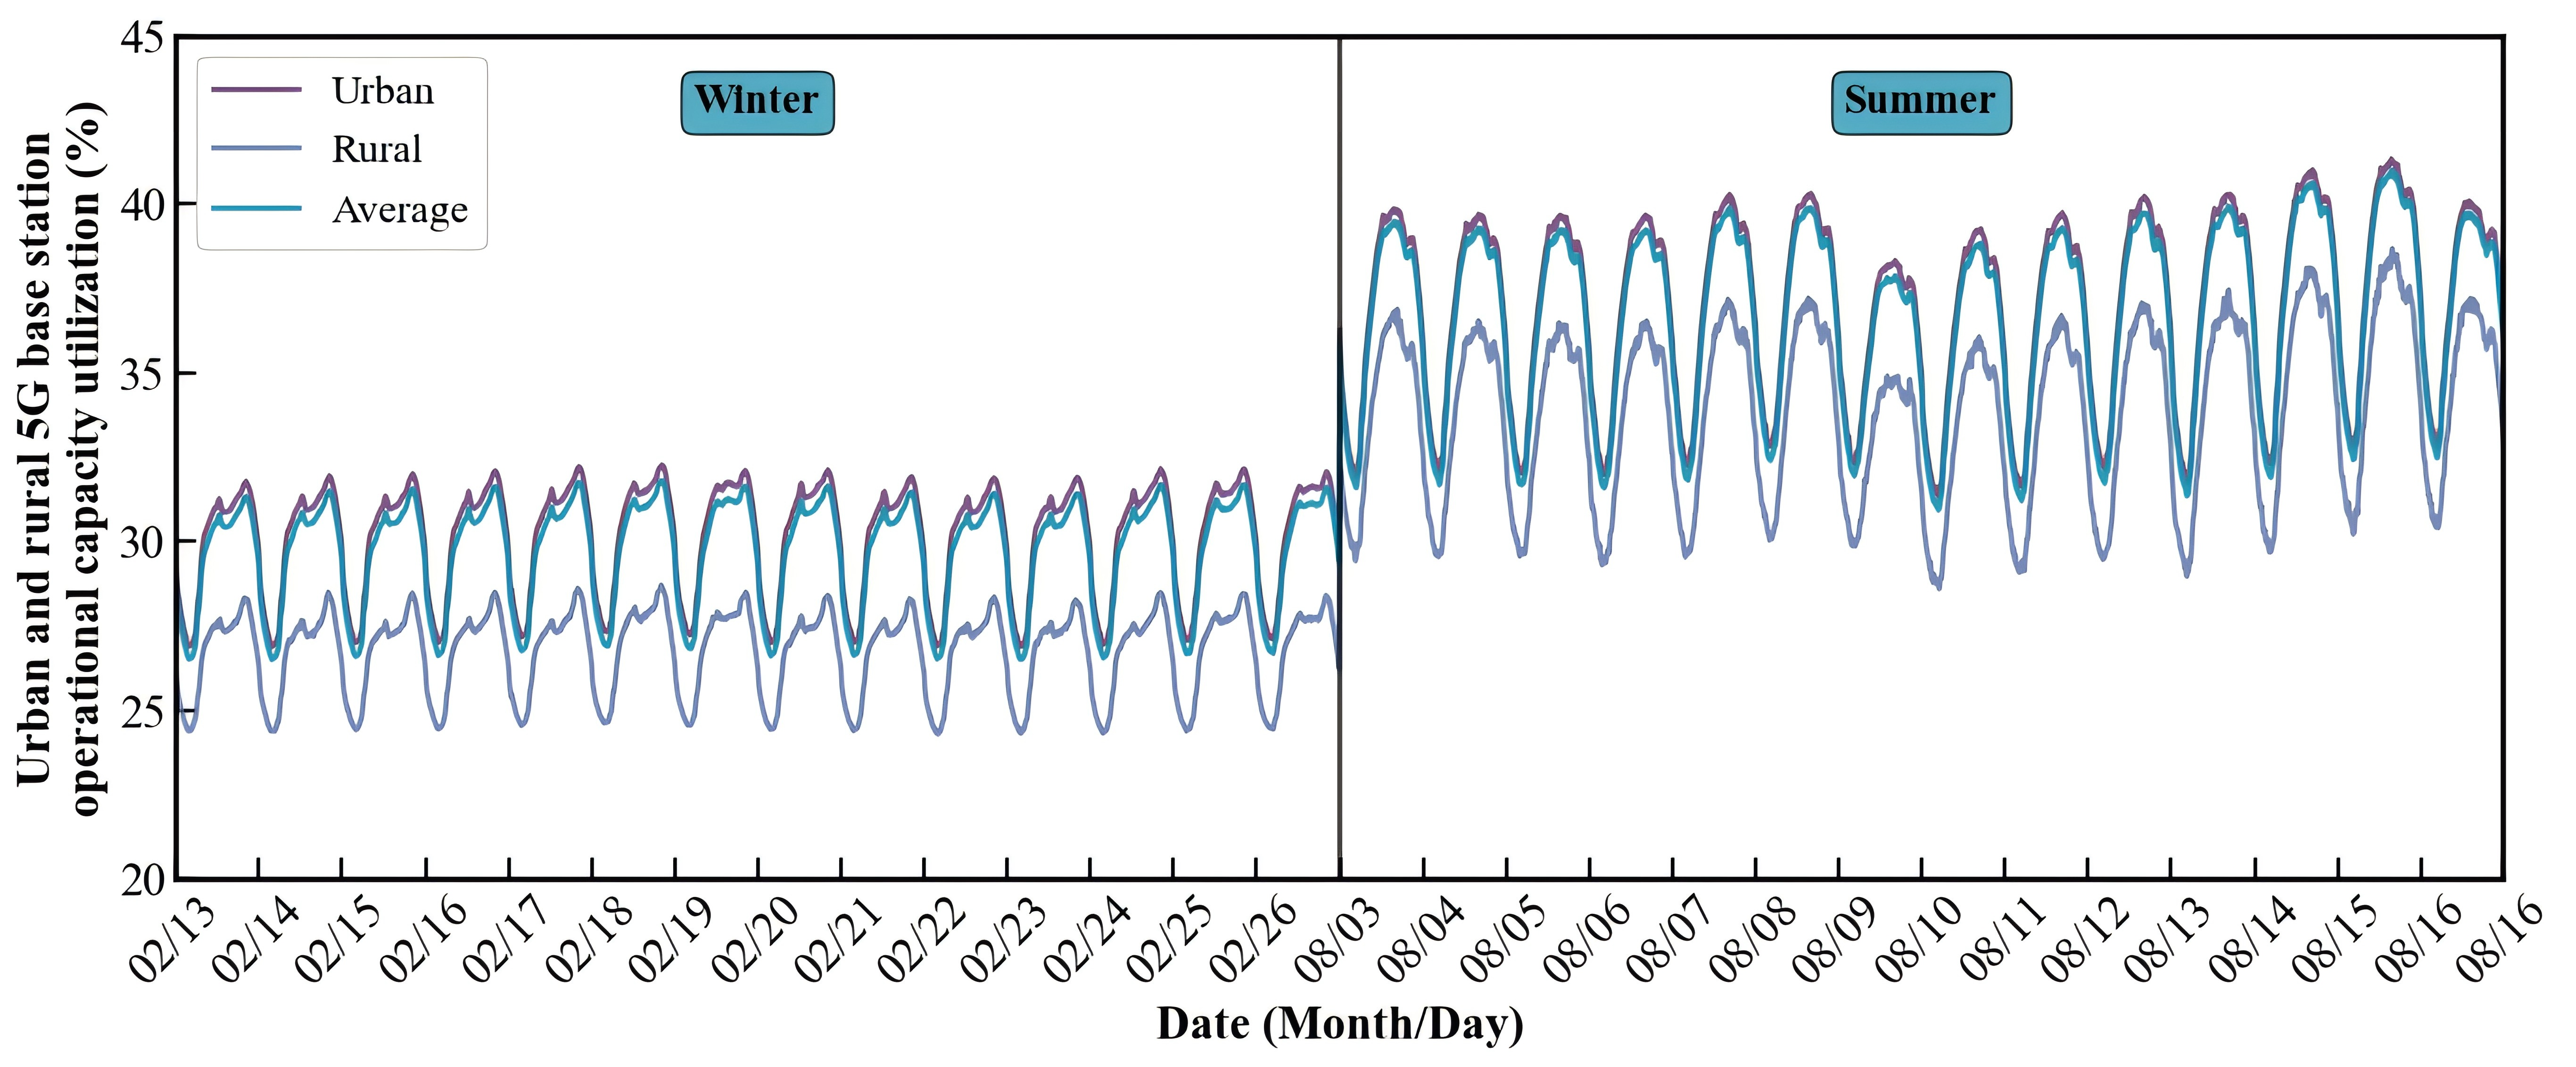
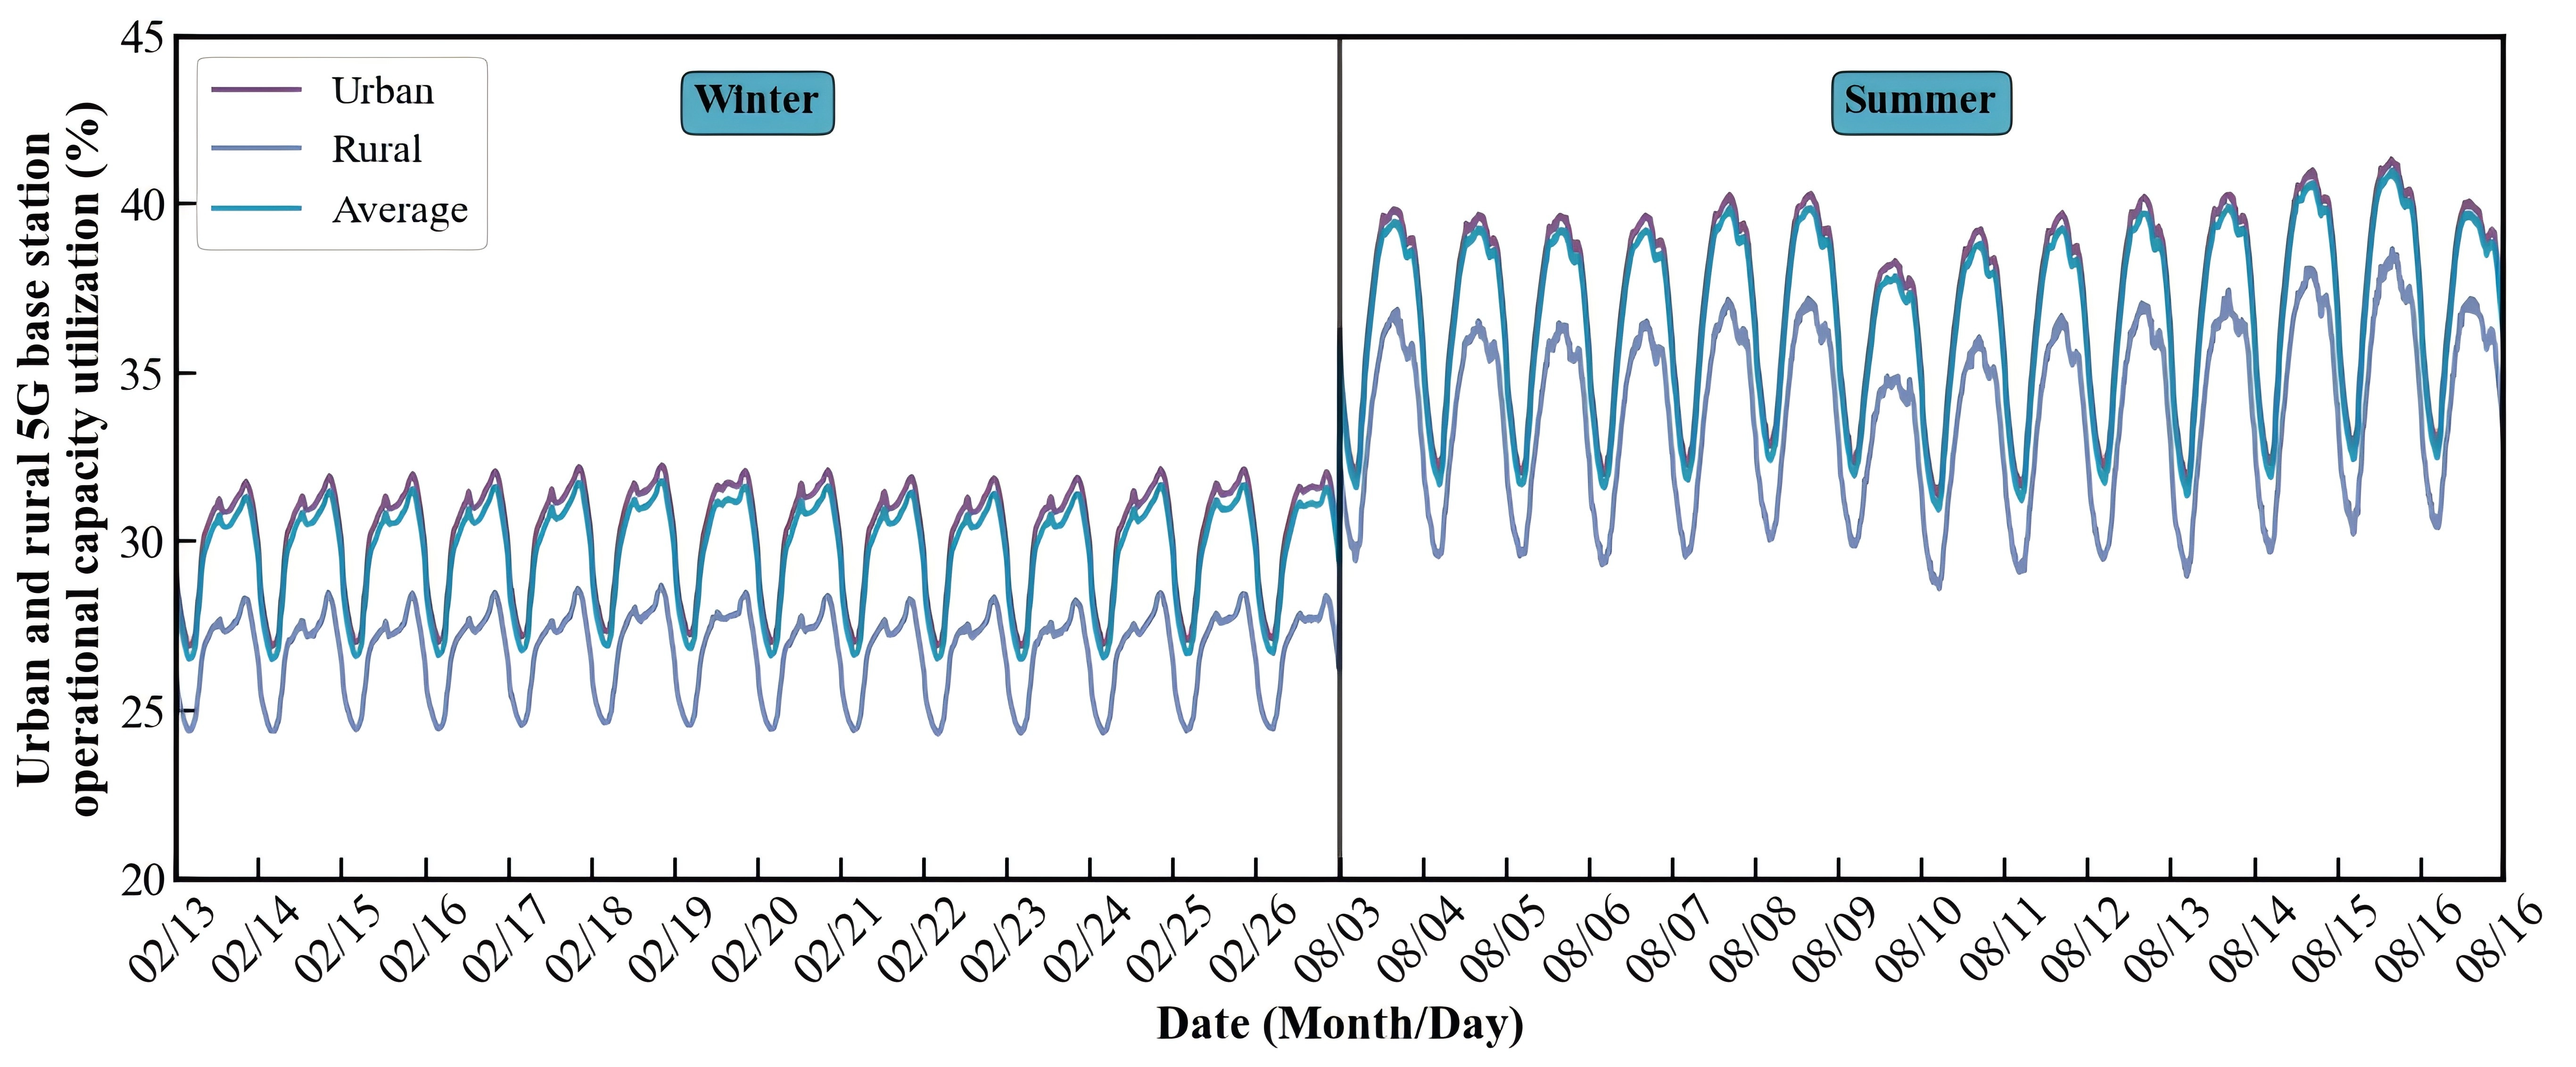
Figure 15. Capacity utilization rates of 5G base stations at each time step in winter and summer.
4.2.4 Temperature sensitivity analysis of 5G base station loads
Temperature sensitivity at the individual base-station level was evaluated by calculating Pearson correlation coefficients between paired 15-minute base-station power-consumption and ambient-temperature observations during typical winter (February 13-26, 2023) and summer (August 3-16, 2023) weeks, as shown in Figure 16. Individual base station analysis reveals substantial heterogeneity in temperature responsiveness, with correlation coefficients ranging from -0.44 to 0.62 in winter and -0.59 to 0.89 in summer. Winter correlations average 0.267 (standard deviation 0.130), while summer exhibits stronger sensitivity with an average correlation of 0.340 and greater variability (standard deviation 0.191), reflecting intensified cooling demands during high-temperature periods. Combining both seasons yields an overall average correlation coefficient of 0.480 with a standard deviation of 0.308, indicating that temperature represents only one factor influencing consumption patterns, with operational characteristics and local conditions contributing to the observed heterogeneity.
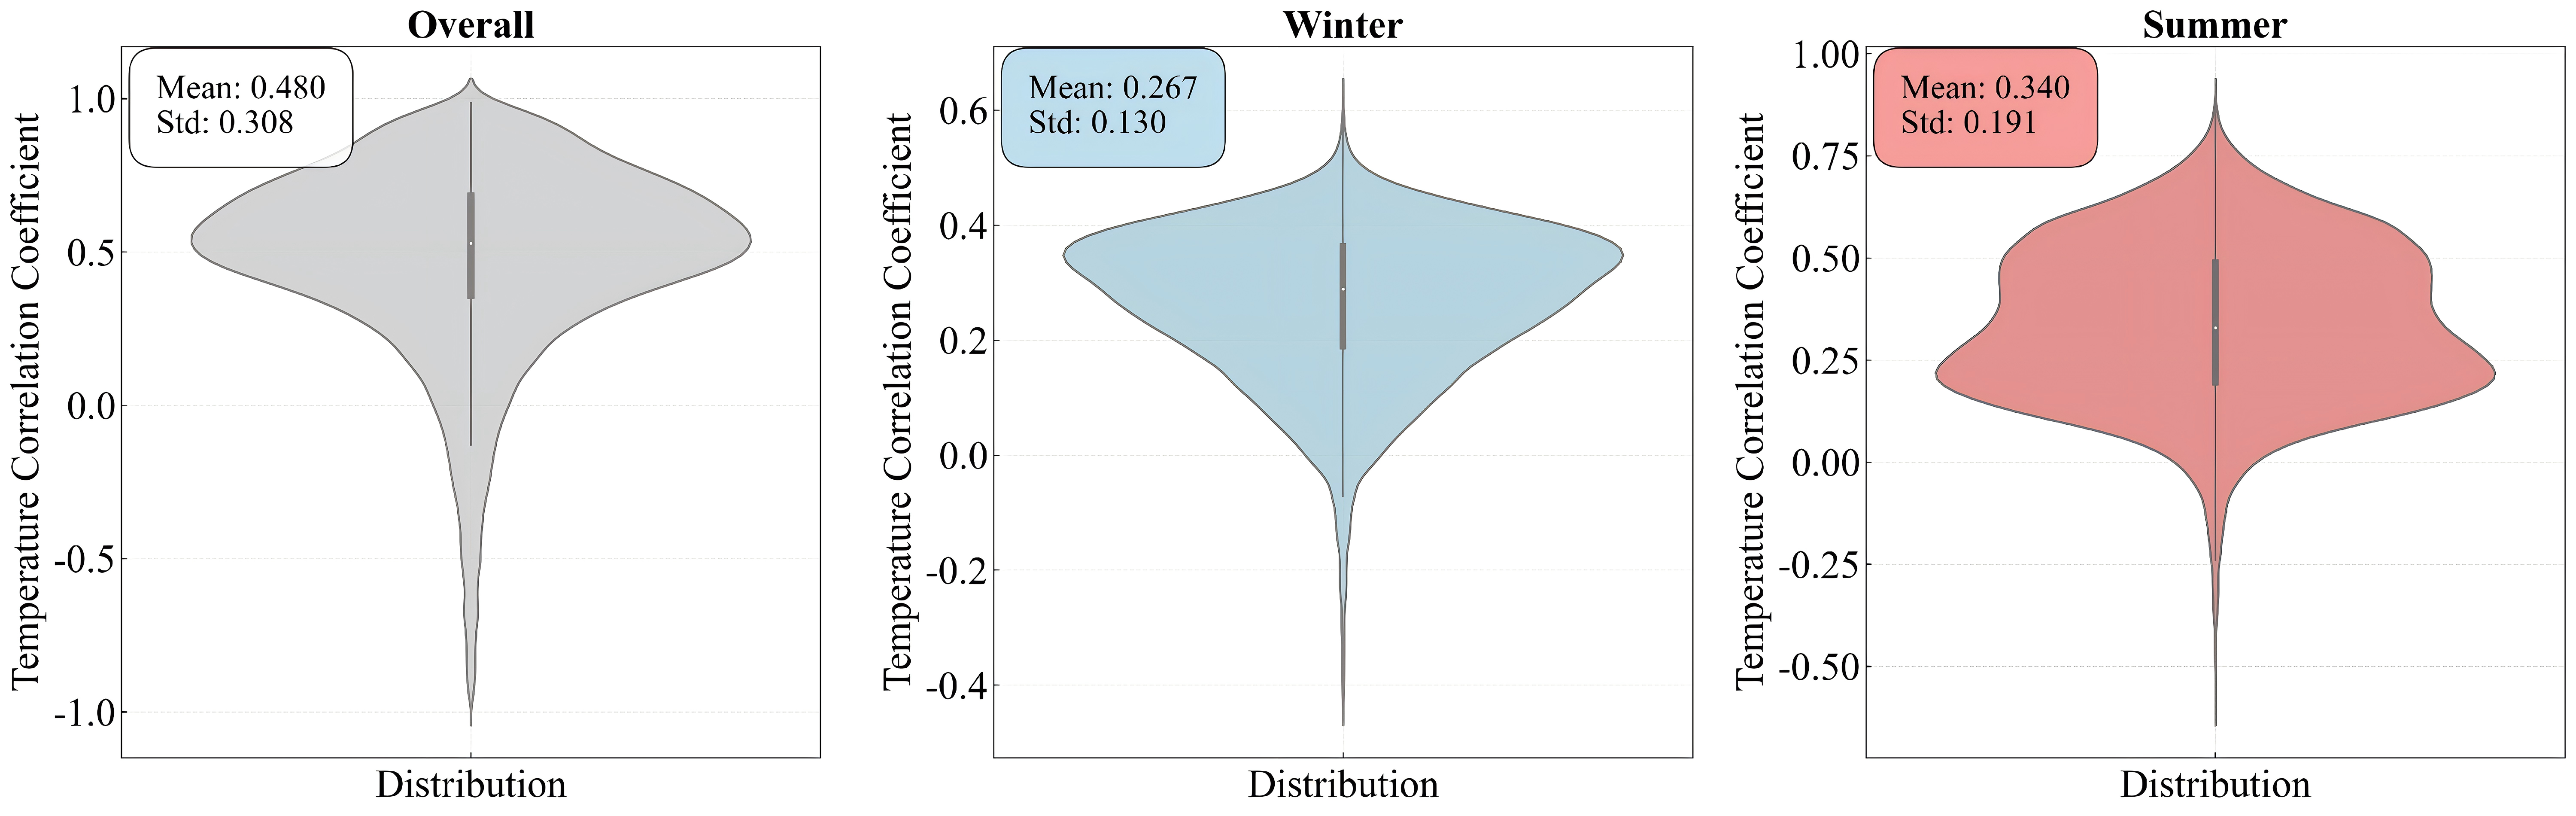
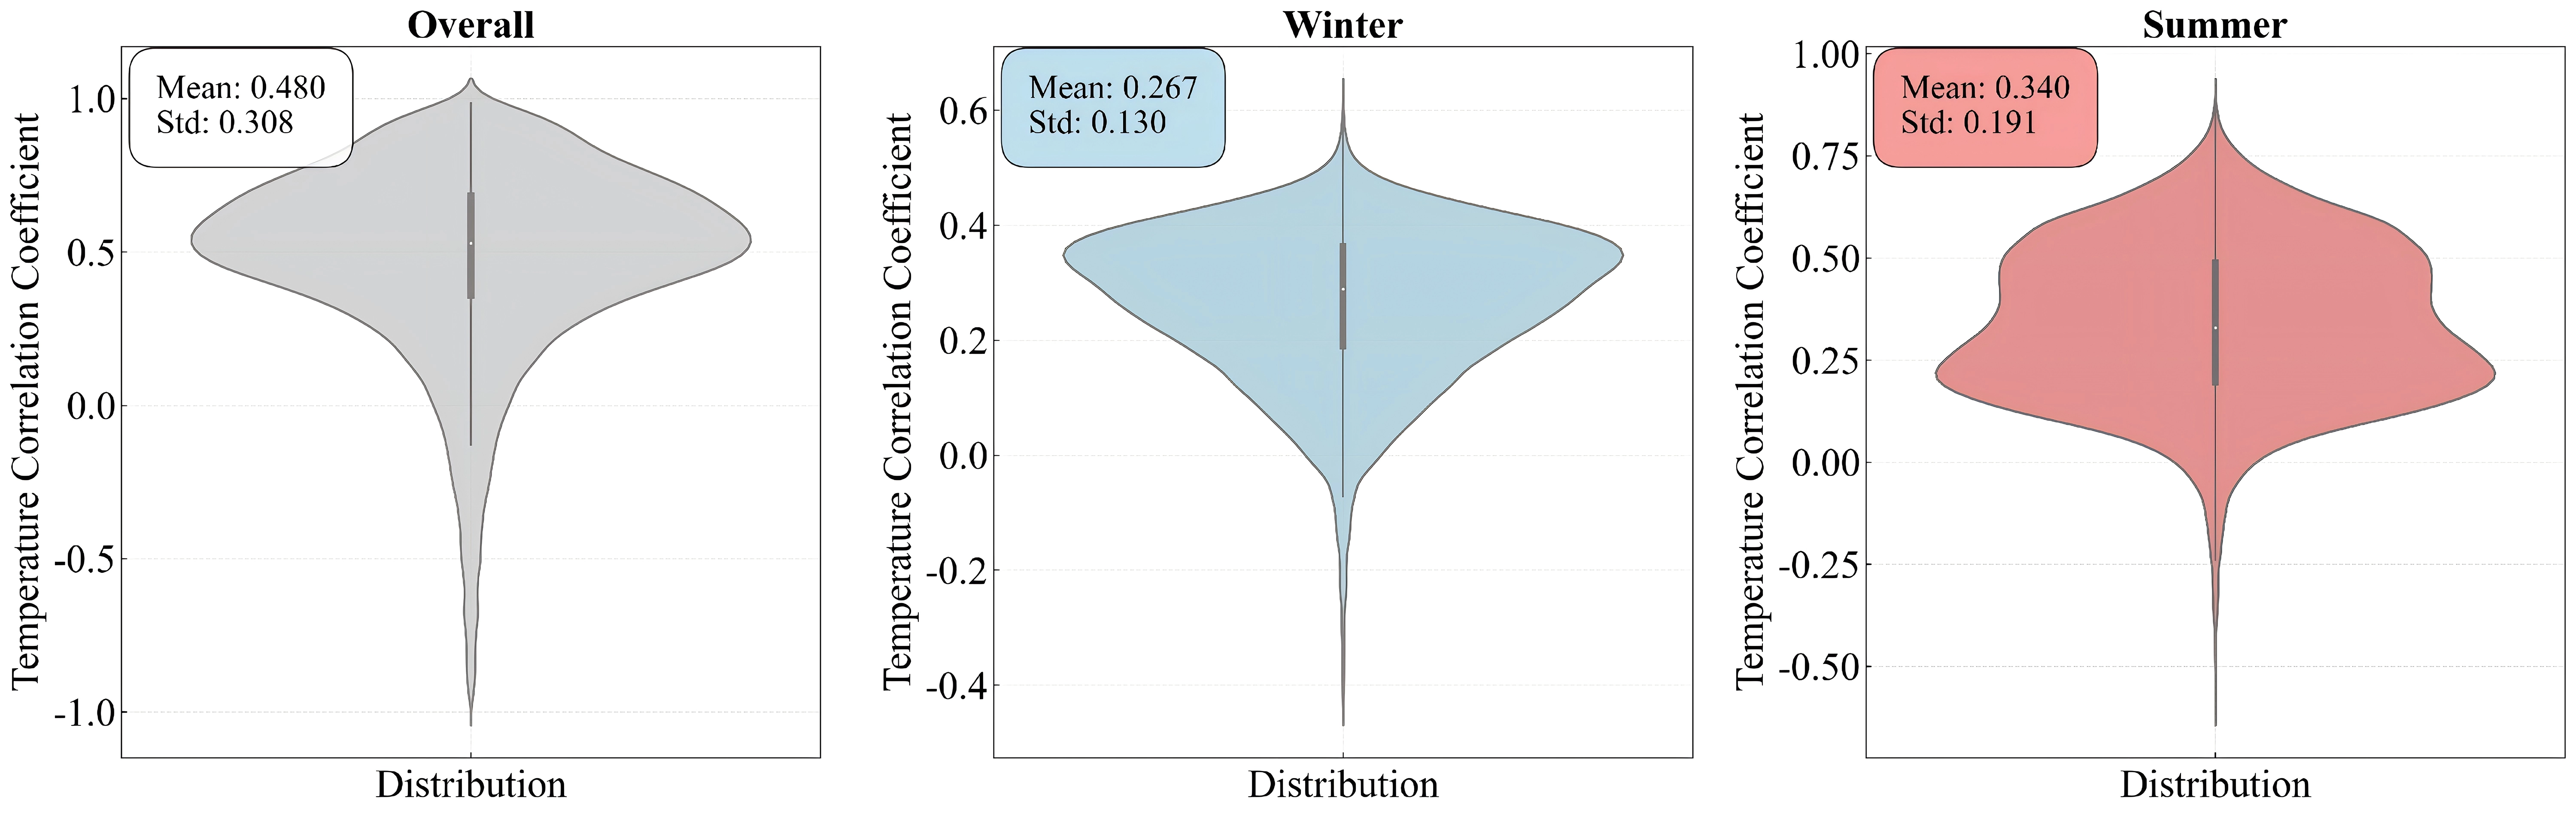
Figure 16. Distribution of correlation coefficients between base station power consumption and ambient temperature.
Network-level analysis was conducted separately using daily average temperature and daily average power consumption of the entire 5G infrastructure, as shown in Figure 17. The daily average series were obtained by aggregating the original 15-minute temperature and aggregate base-station power data and matching them by date. The aggregated network shows pronounced seasonal differences in temperature responsiveness, with a strong linear correlation in summer (Pearson r = 0.738, R2 = 0.545) compared to a weaker correlation in winter (r = 0.360, R2 = 0.129). The linear relationship during summer reflects consistent air-conditioning responses across the network, where higher temperatures systematically drive increased cooling demand throughout the infrastructure. The winter correlations show weaker temperature dependence, with only 12.9% of the power consumption variance attributable to temperature changes, suggesting that baseline operational loads dominate during cold periods when cooling demand is minimal. This network-level correlation analysis using daily average data complements the individual station variability observed in high-resolution analysis. It shows that, despite substantial individual differences, the overall network exhibits strong temperature sensitivity with clear seasonal dependencies. The strong temperature-power correlations indicate potential grid stress during extreme weather events, as simultaneous surges in building and base station cooling loads create compounding pressure on urban power infrastructure and suggest opportunities to leverage base station energy storage systems to mitigate temperature-driven load fluctuations and enhance urban energy resilience.
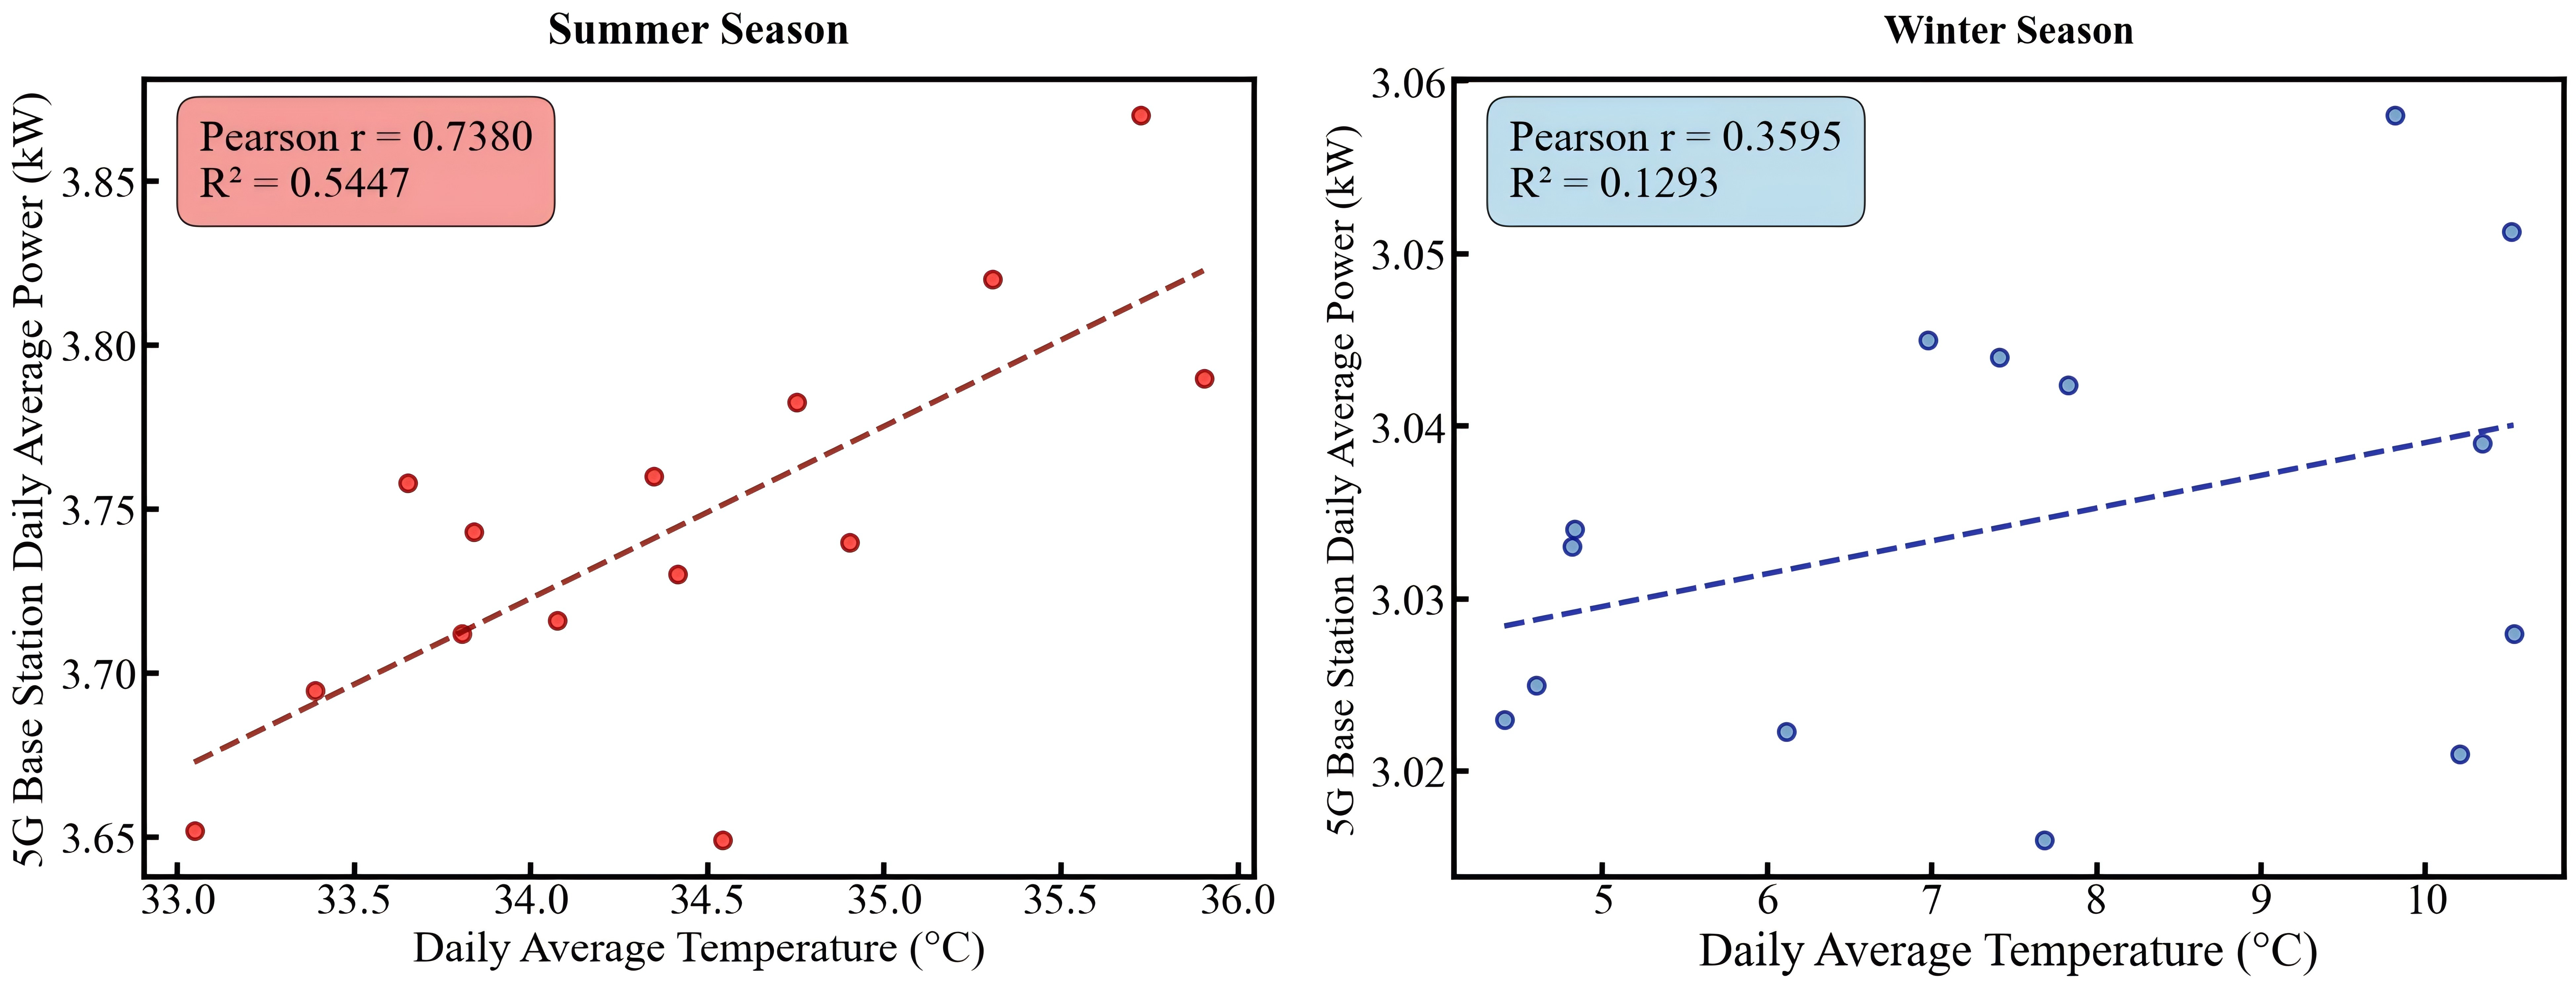
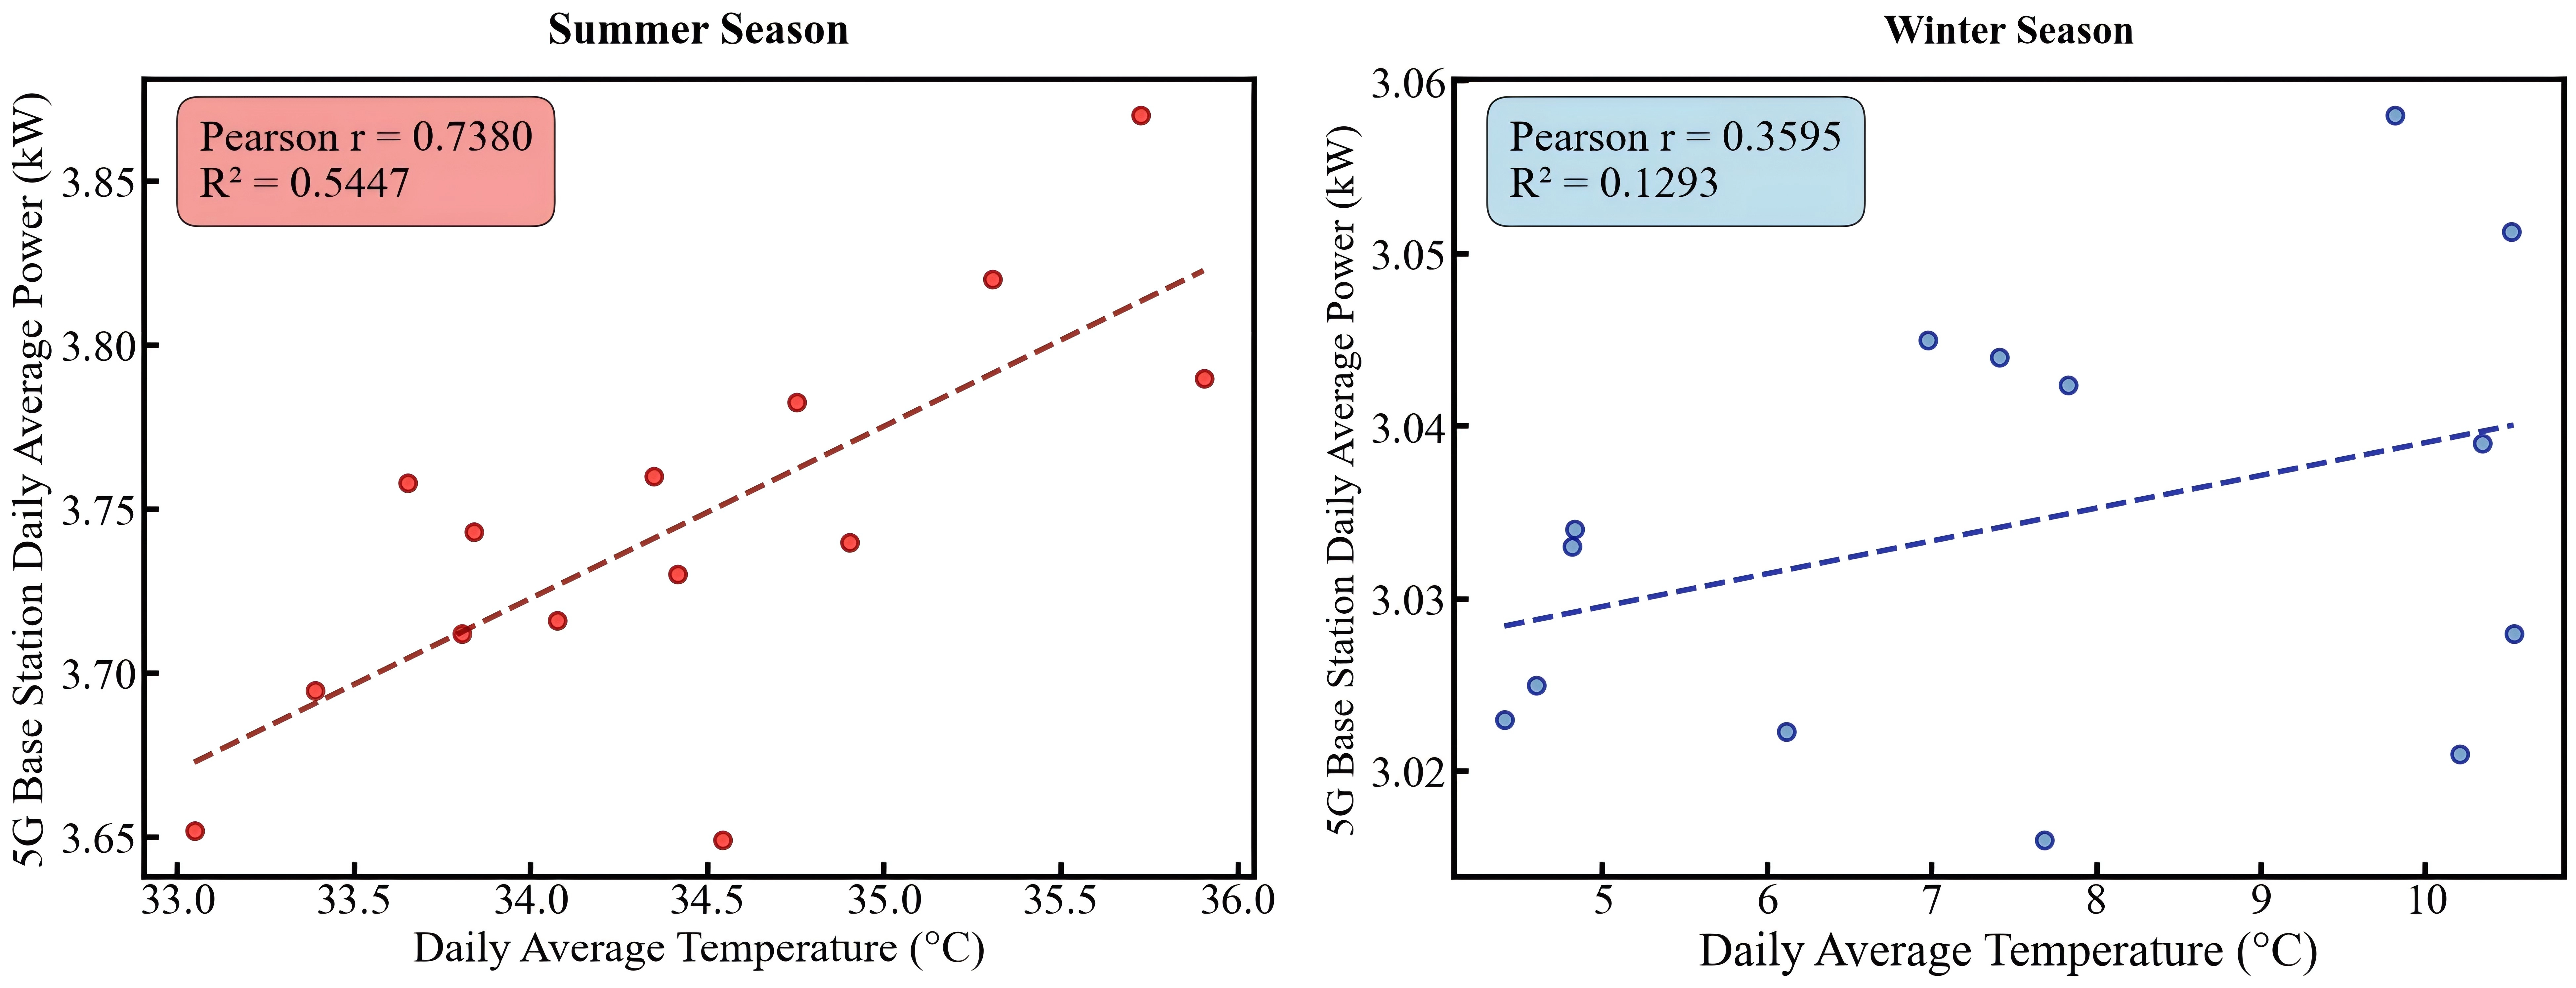
Figure 17. Daily average power consumption per base station vs. ambient temperature.
4.3 Impact of 5G base station loads on the grid
4.3.1 Load comparison with grid patterns
This section analyzes the relationship between 5G base stations and regional power grid loads to understand the potential impacts and interactions between urban telecommunications infrastructure and the broader urban energy system. This comparative analysis utilizes synchronized power data from both 5G base stations and regional grids during typical winter (February 13-26, 2023) and summer (August 3-16, 2023) weeks, employing advanced phase correlation analysis to quantify the temporal alignment patterns. The comparative analysis reveals fundamental temporal patterns and seasonal variations between the base station and grid loads across the study period, as shown in Figure 18. Base station loads show distinct seasonal characteristics, ranging from 97,000-115,000 kW during winter and increasing to 115,000-142,000 kW in summer. Provincial grid loads show larger absolute fluctuations, ranging from 24,000-33,000 MW in winter to 25,000-45,000 MW in summer, with more pronounced daily cycles and weekend reductions. During winter, 5G base stations account for approximately 0.31%-0.43% of the provincial grid load, while summer proportions range between 0.31%-0.39%. Although these proportions are relatively small, the current analysis includes only 37,525 of 93,800 5G base stations deployed across the province as of March 2023. Extrapolating from the analyzed sample, the complete 5G infrastructure is estimated to represent over 1% of the provincial grid demand, positioning urban telecommunications infrastructure as a non-negligible and growing component of urban energy consumption that warrants integration into city-level energy planning frameworks.
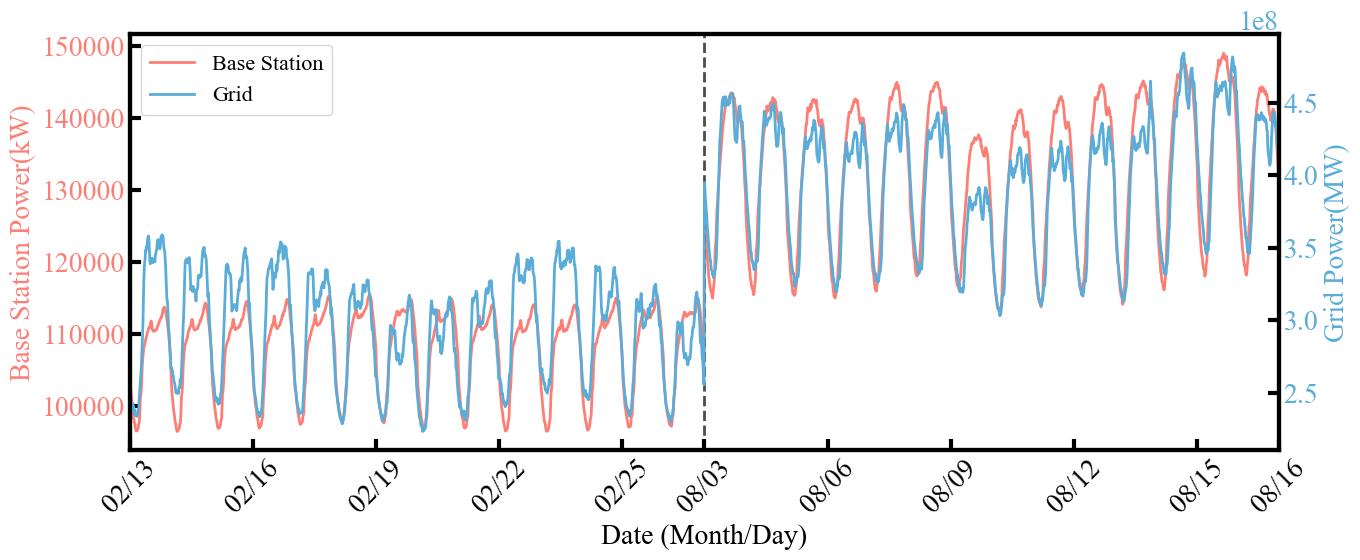
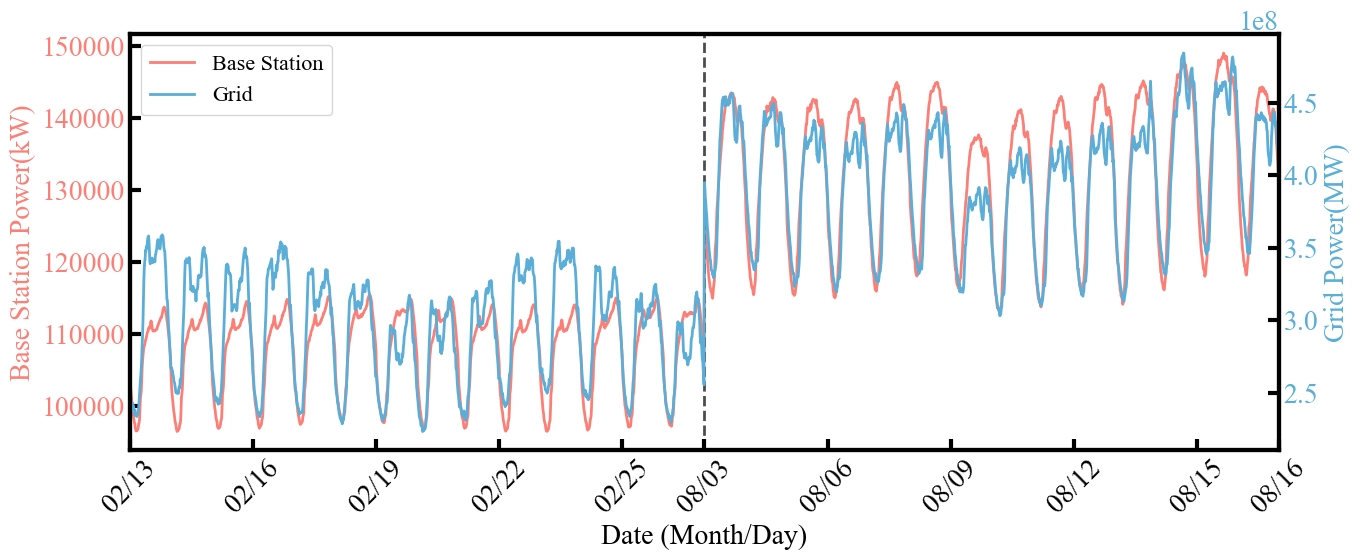
Figure 18. Comparison of 5G base station loads and provincial grid loads in winter and summer.
The phase correlation analysis reveals strong temporal synchronization between base station and grid loads, with enhanced alignment during summer. Figure 19a shows the phase differences between the base station and grid loads over time, where smaller phase differences indicate better synchronization. Winter periods show higher and more variable phase differences, while summer periods show smaller and more stable phase differences. The corresponding correlation analysis shown in Figure 19b further confirms this seasonal pattern. Based on these phase-difference patterns, the PLV values calculated from the seasonally standardized load series were 0.816 in winter and 0.912 in summer. To evaluate the sensitivity of these results to signal preprocessing, the PLV was recalculated after linear detrending and zero-phase high-pass filtering. After linear detrending, the PLV values were 0.831 in winter and 0.908 in summer. After zero-phase high-pass filtering, the corresponding values were 0.893 and 0.964, respectively. Although the absolute values varied with the preprocessing method, all three preprocessing conditions indicated strong synchronization, with consistently higher PLV values in summer than in winter. The consistently stronger summer synchronization suggests that the base-station and grid loads become more uniformly responsive to shared environmental factors during warmer periods, particularly temperature-related cooling demand. This seasonal alignment indicates greater potential for coordinated demand-response strategies during summer peak periods.
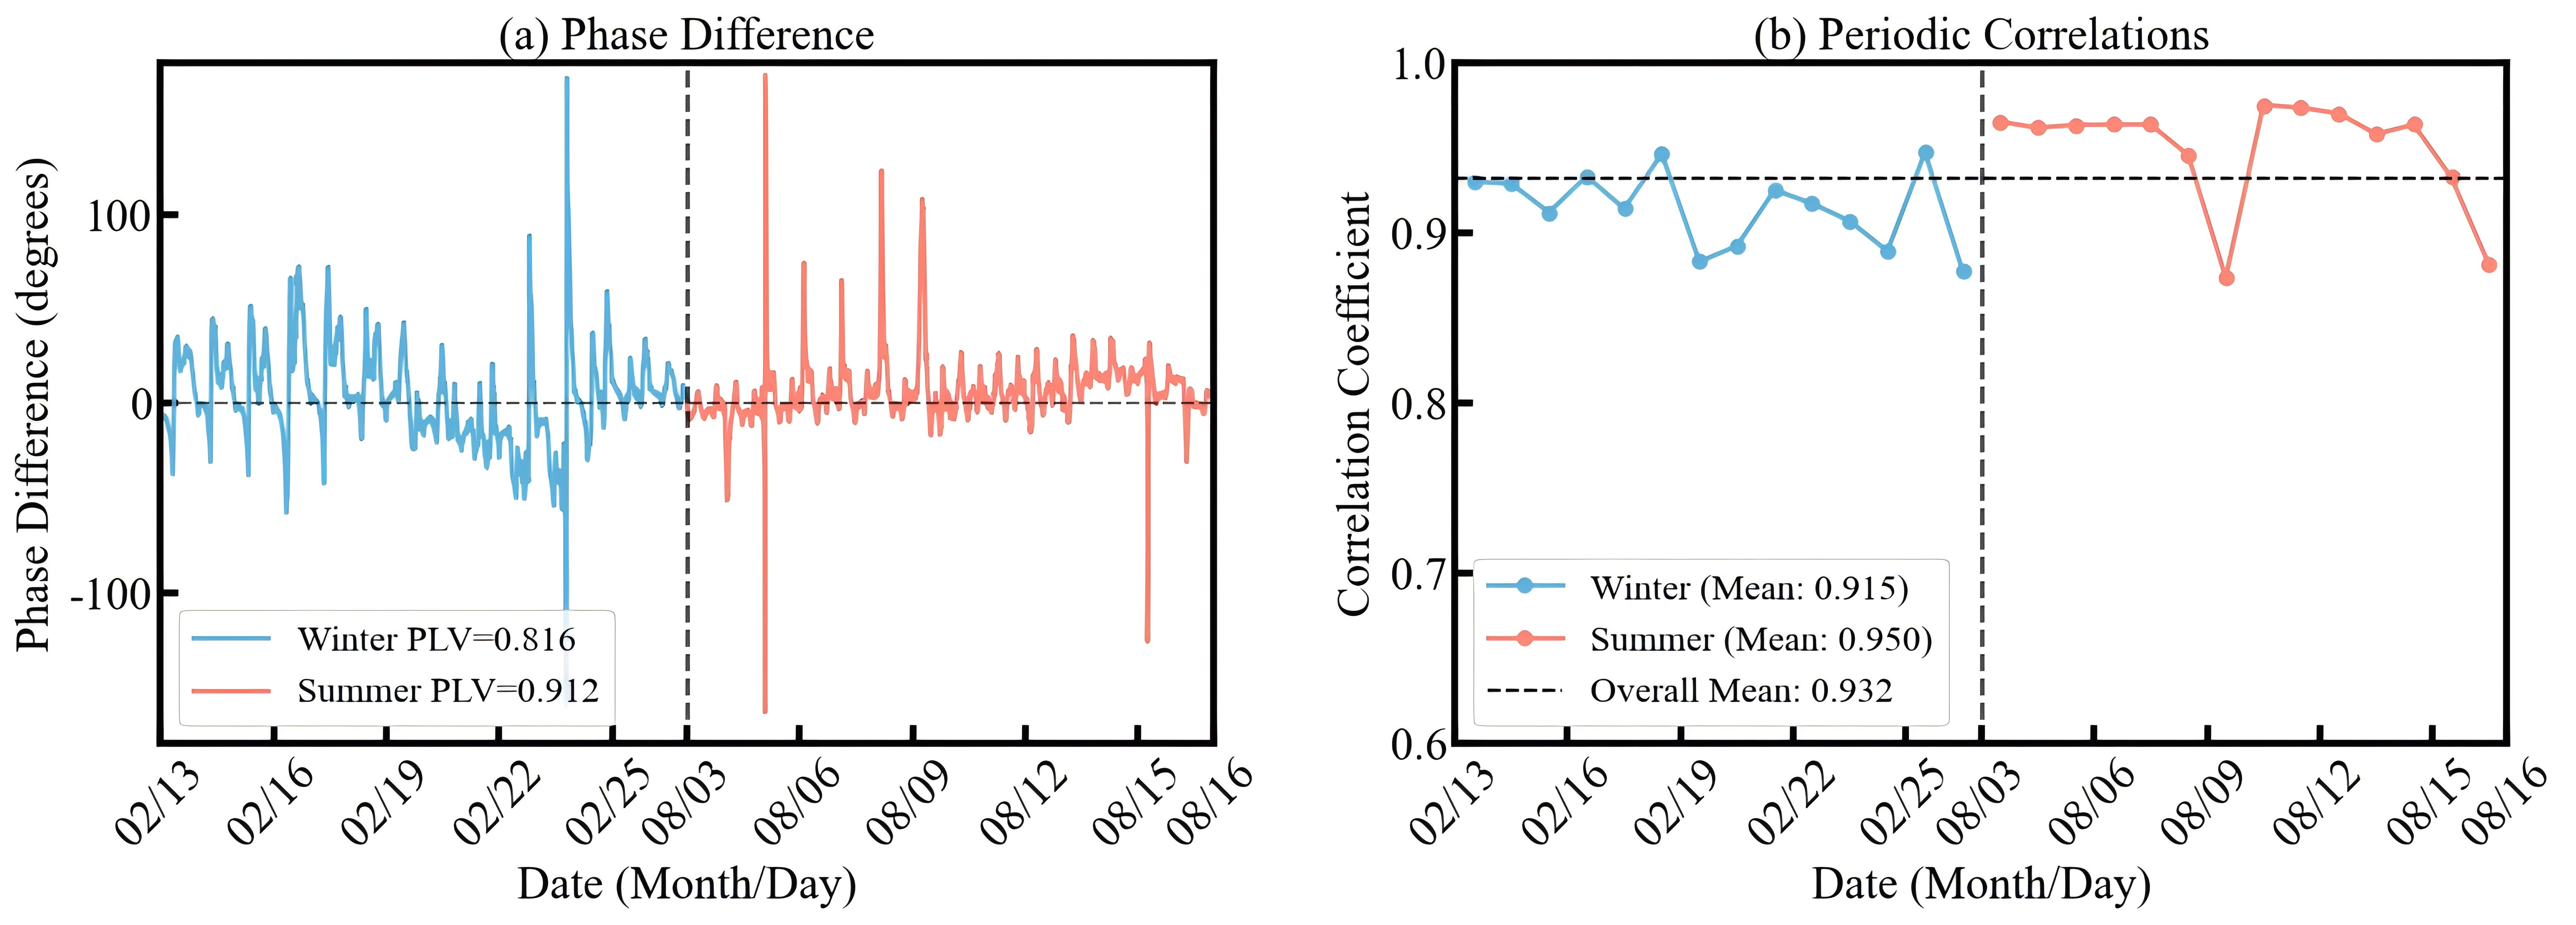
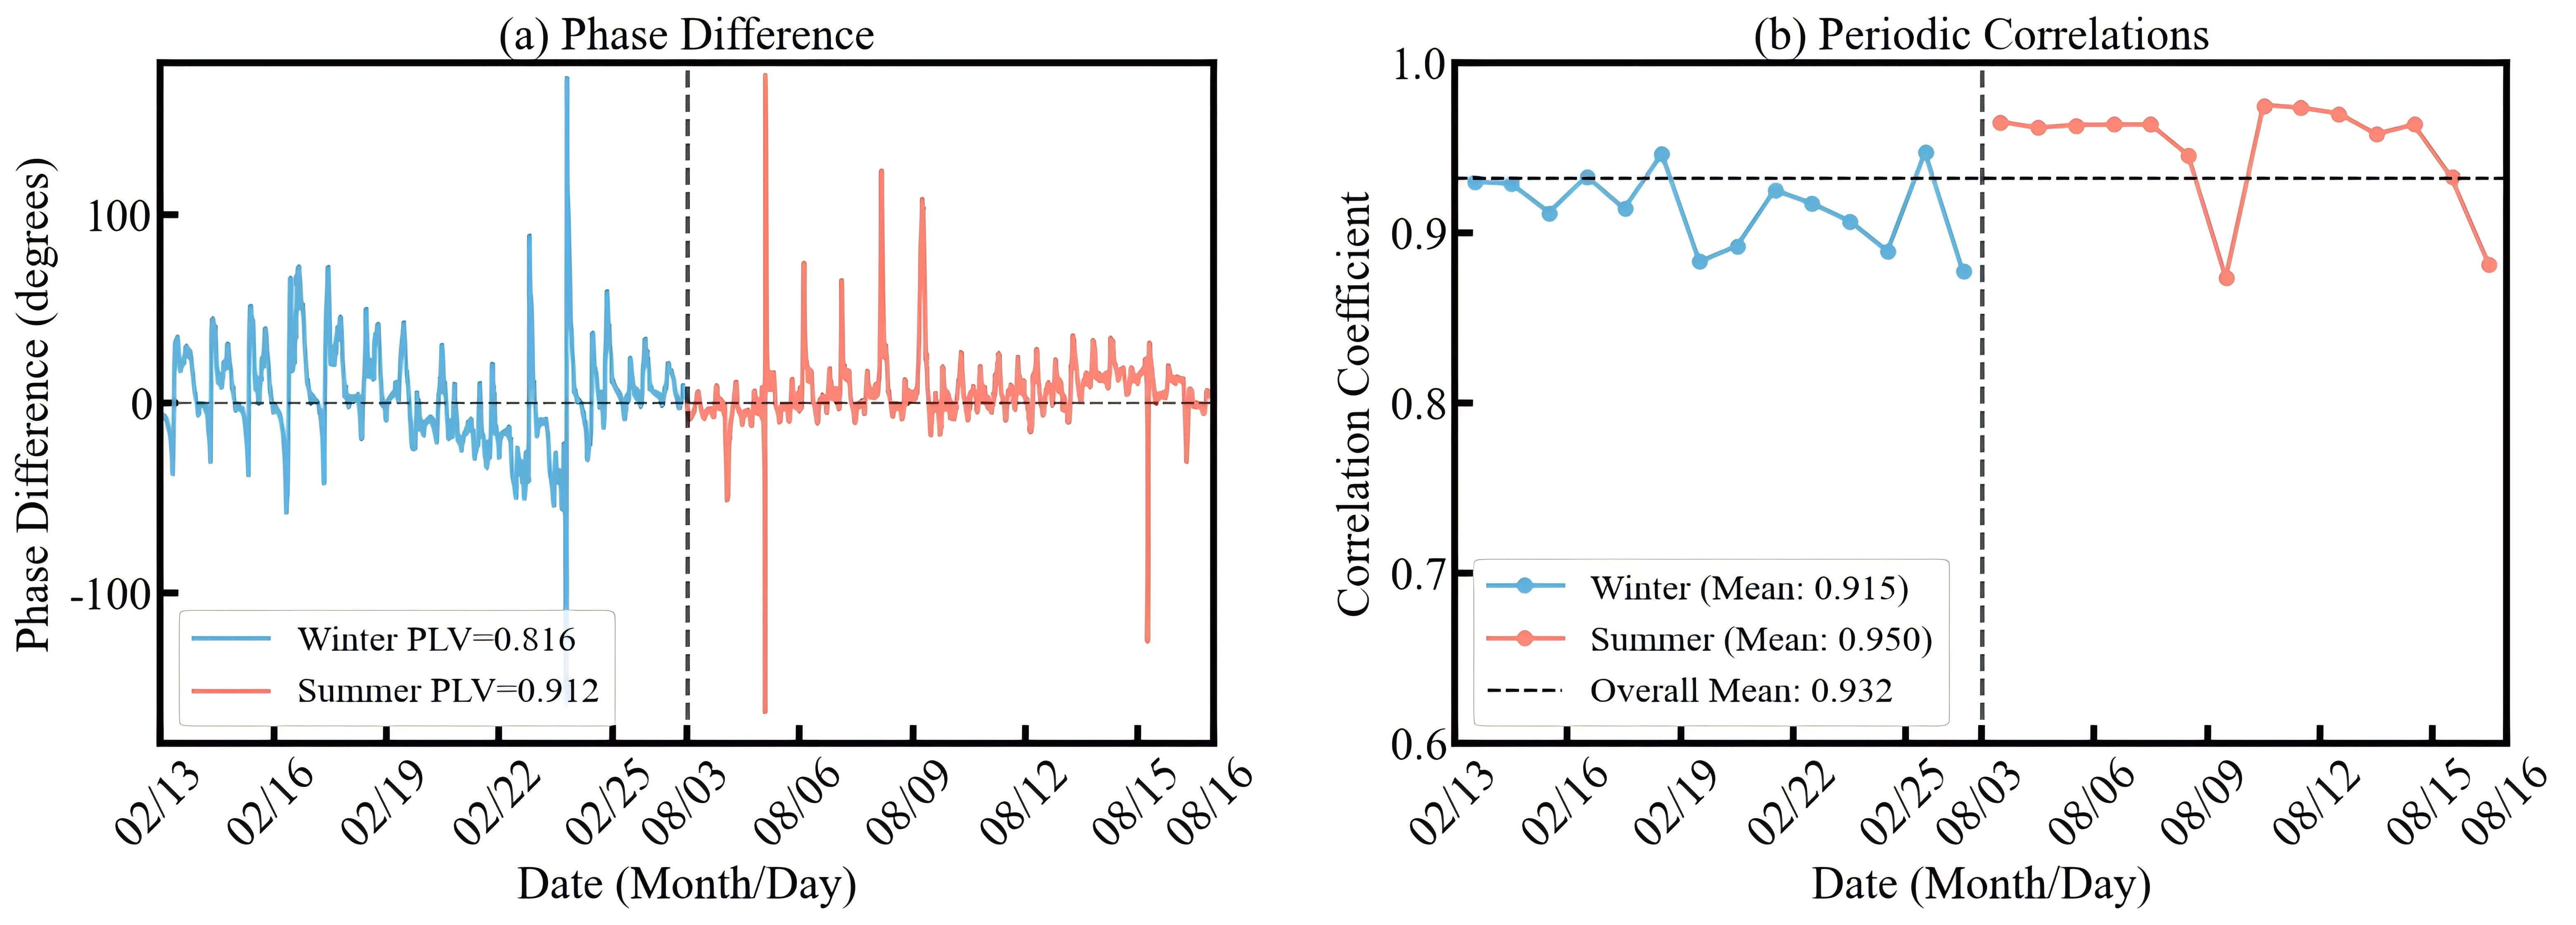
Figure 19. Phase synchronization and correlation analysis of 5G base station and grid.
4.3.2 Time-of-use tariff misalignment and demand response potential
Daily load profiles are analyzed against regional time-of-use electricity pricing to assess operational alignment with tariff structures and to evaluate the role of 5G base stations as flexible urban energy resources. Figure 20 compares base station and grid loads across different day types during summer and winter. The analysis reveals significant synchronization between base station consumption and high-price periods across both seasons. Base stations peak at approximately 140,000 kW during summer evening hours (around 20:00) and show dual peaks of approximately 115,000 kW at midday and evening (around 12:00 and 20:00) during winter, both coinciding with peak tariff windows. Valley consumption occurs during overnight hours when prices are lowest, with summer valleys of 110,000-115,000 kW and winter valleys of 95,000-100,000 kW. This temporal alignment with peak pricing periods creates economic inefficiencies for telecommunications operators, who pay premium rates for a disproportionate share of electricity consumption while underutilizing low-cost valley periods. Critically, this peak coincidence also compounds the stress on urban power infrastructure, as base station peak loads overlap with the peak demands of commercial and residential buildings, exacerbating urban grid congestion during already critical windows. However, this pattern simultaneously presents opportunities for demand response. Base stations are equipped with backup battery systems (typically 200-400 Ah at 48 V) that can be leveraged for load shifting while maintaining emergency backup capabilities. By reserving about 50% capacity for emergency functions, the remaining storage could support valley-period charging and peak-period discharging strategies. The advanced communication infrastructure of 5G networks enables real-time coordination across thousands of distributed stations, potentially shifting 15-40% of peak consumption to valley hours.
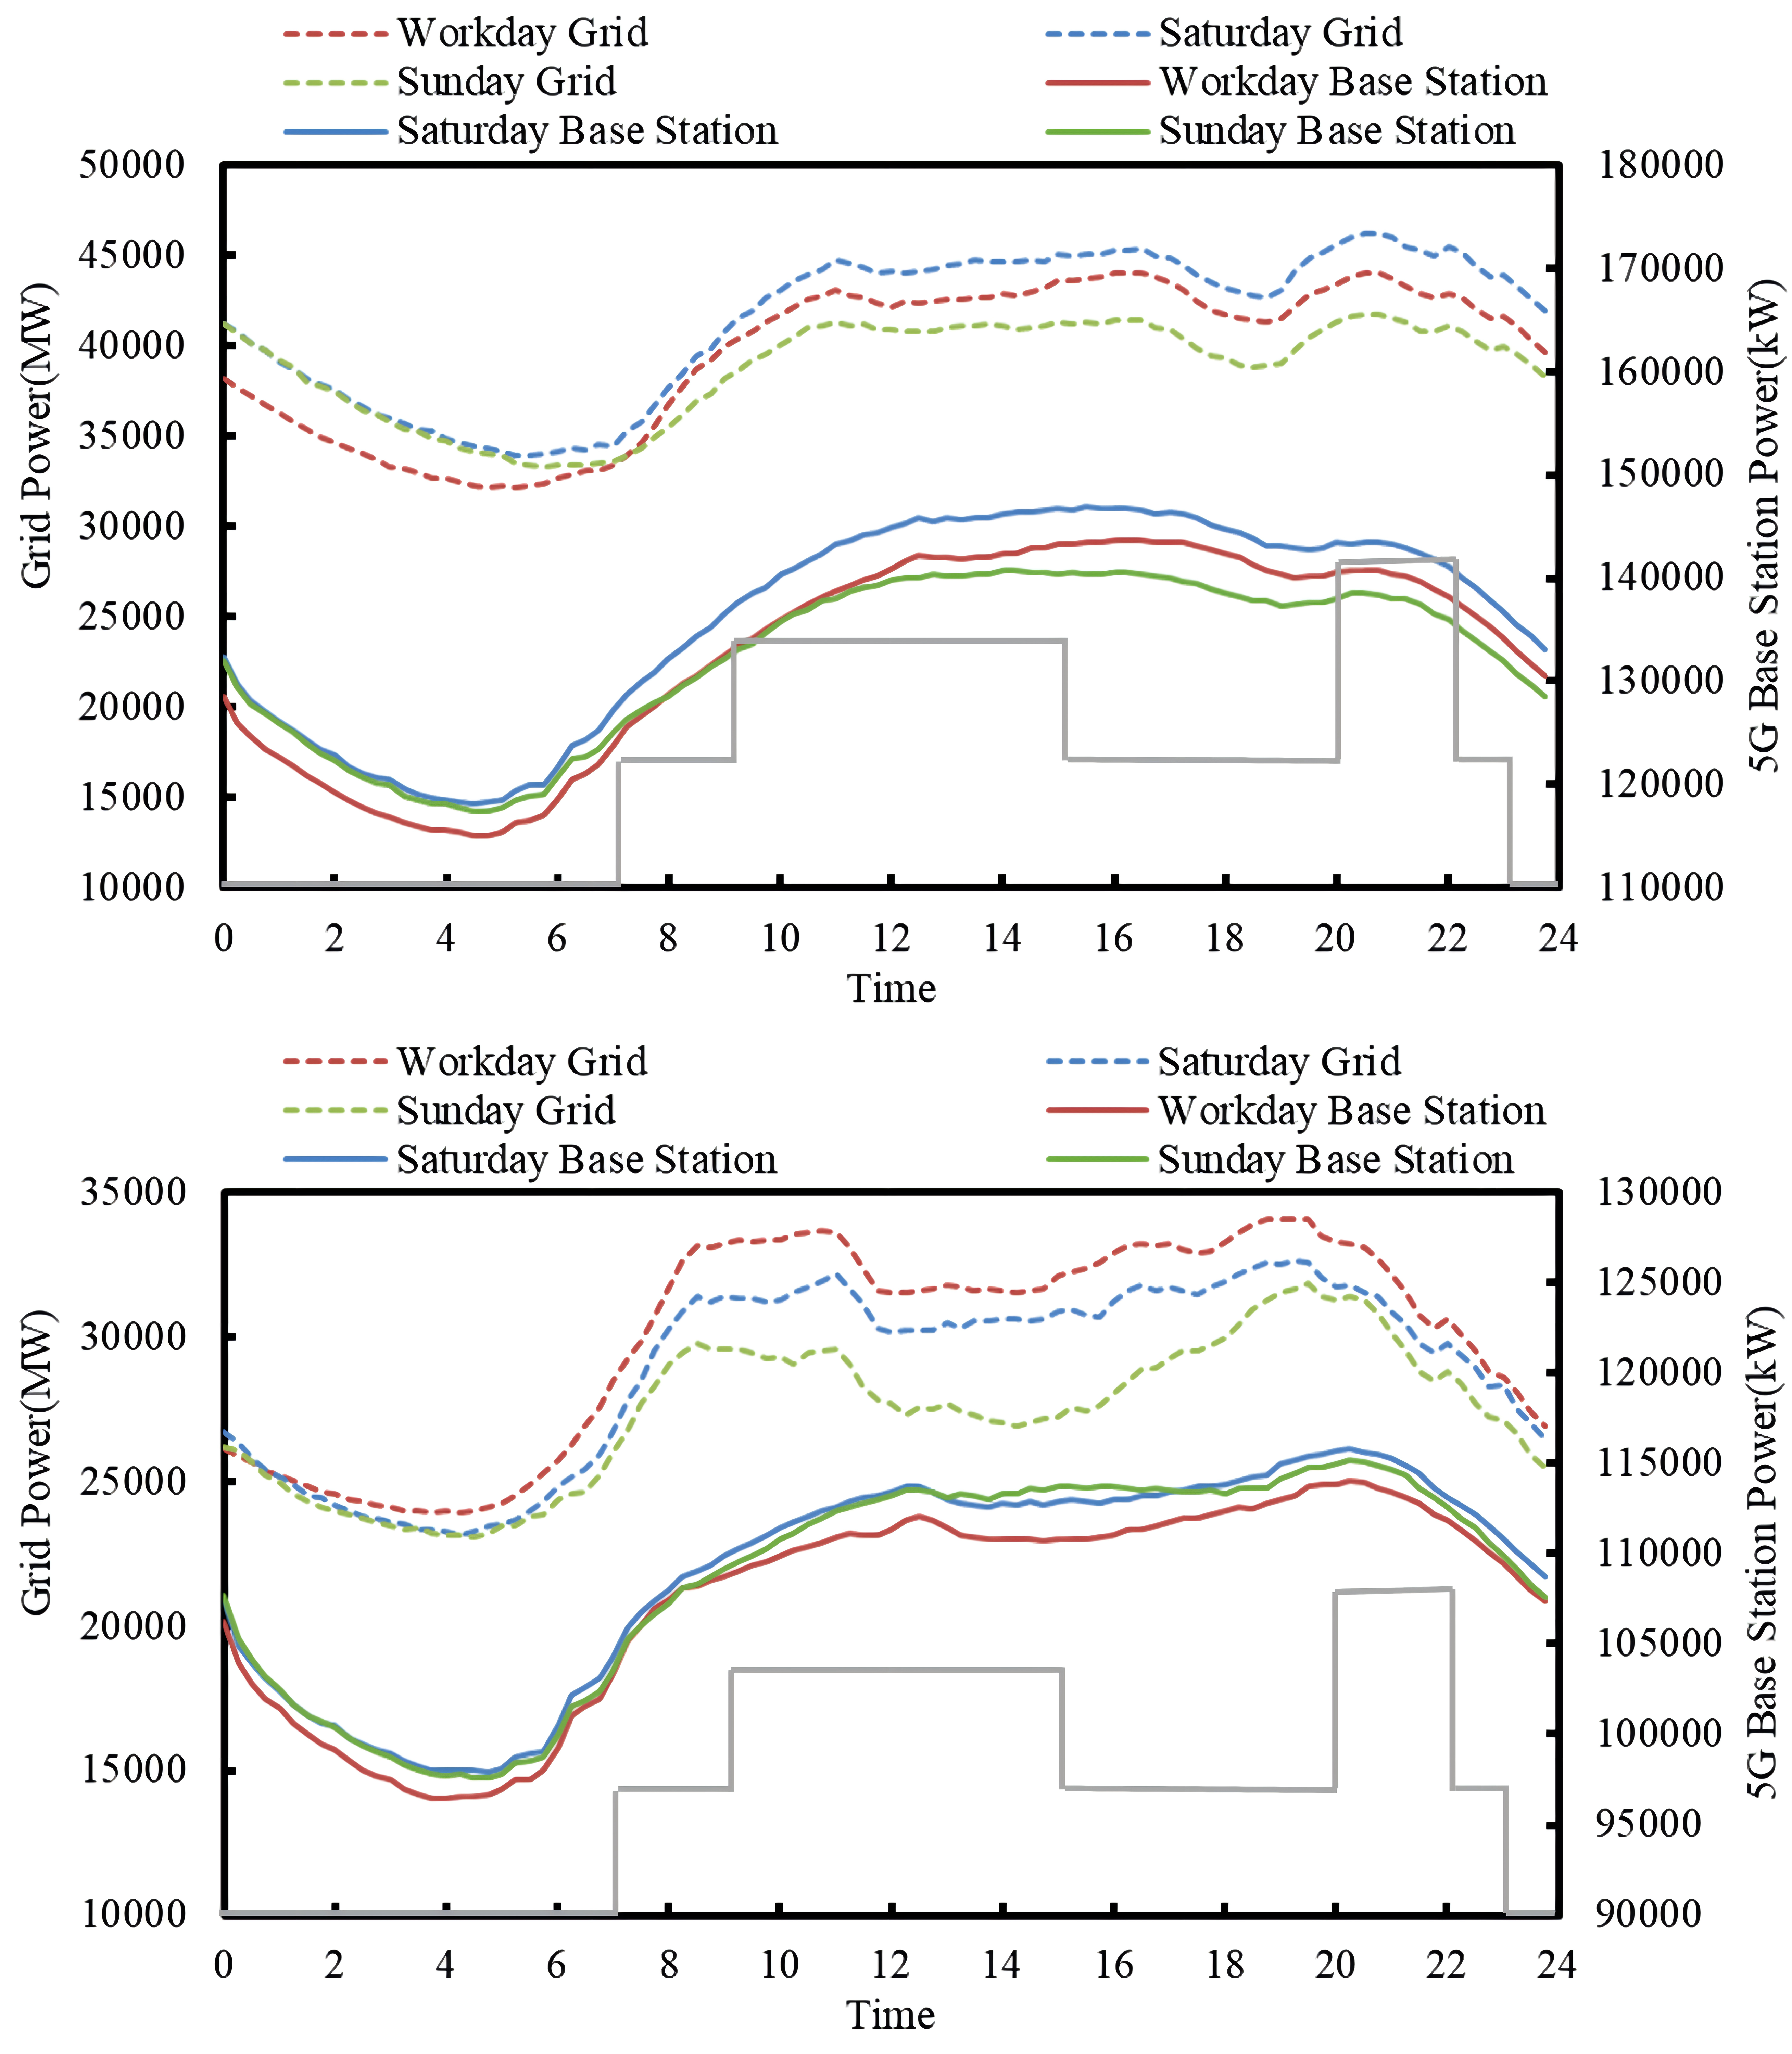
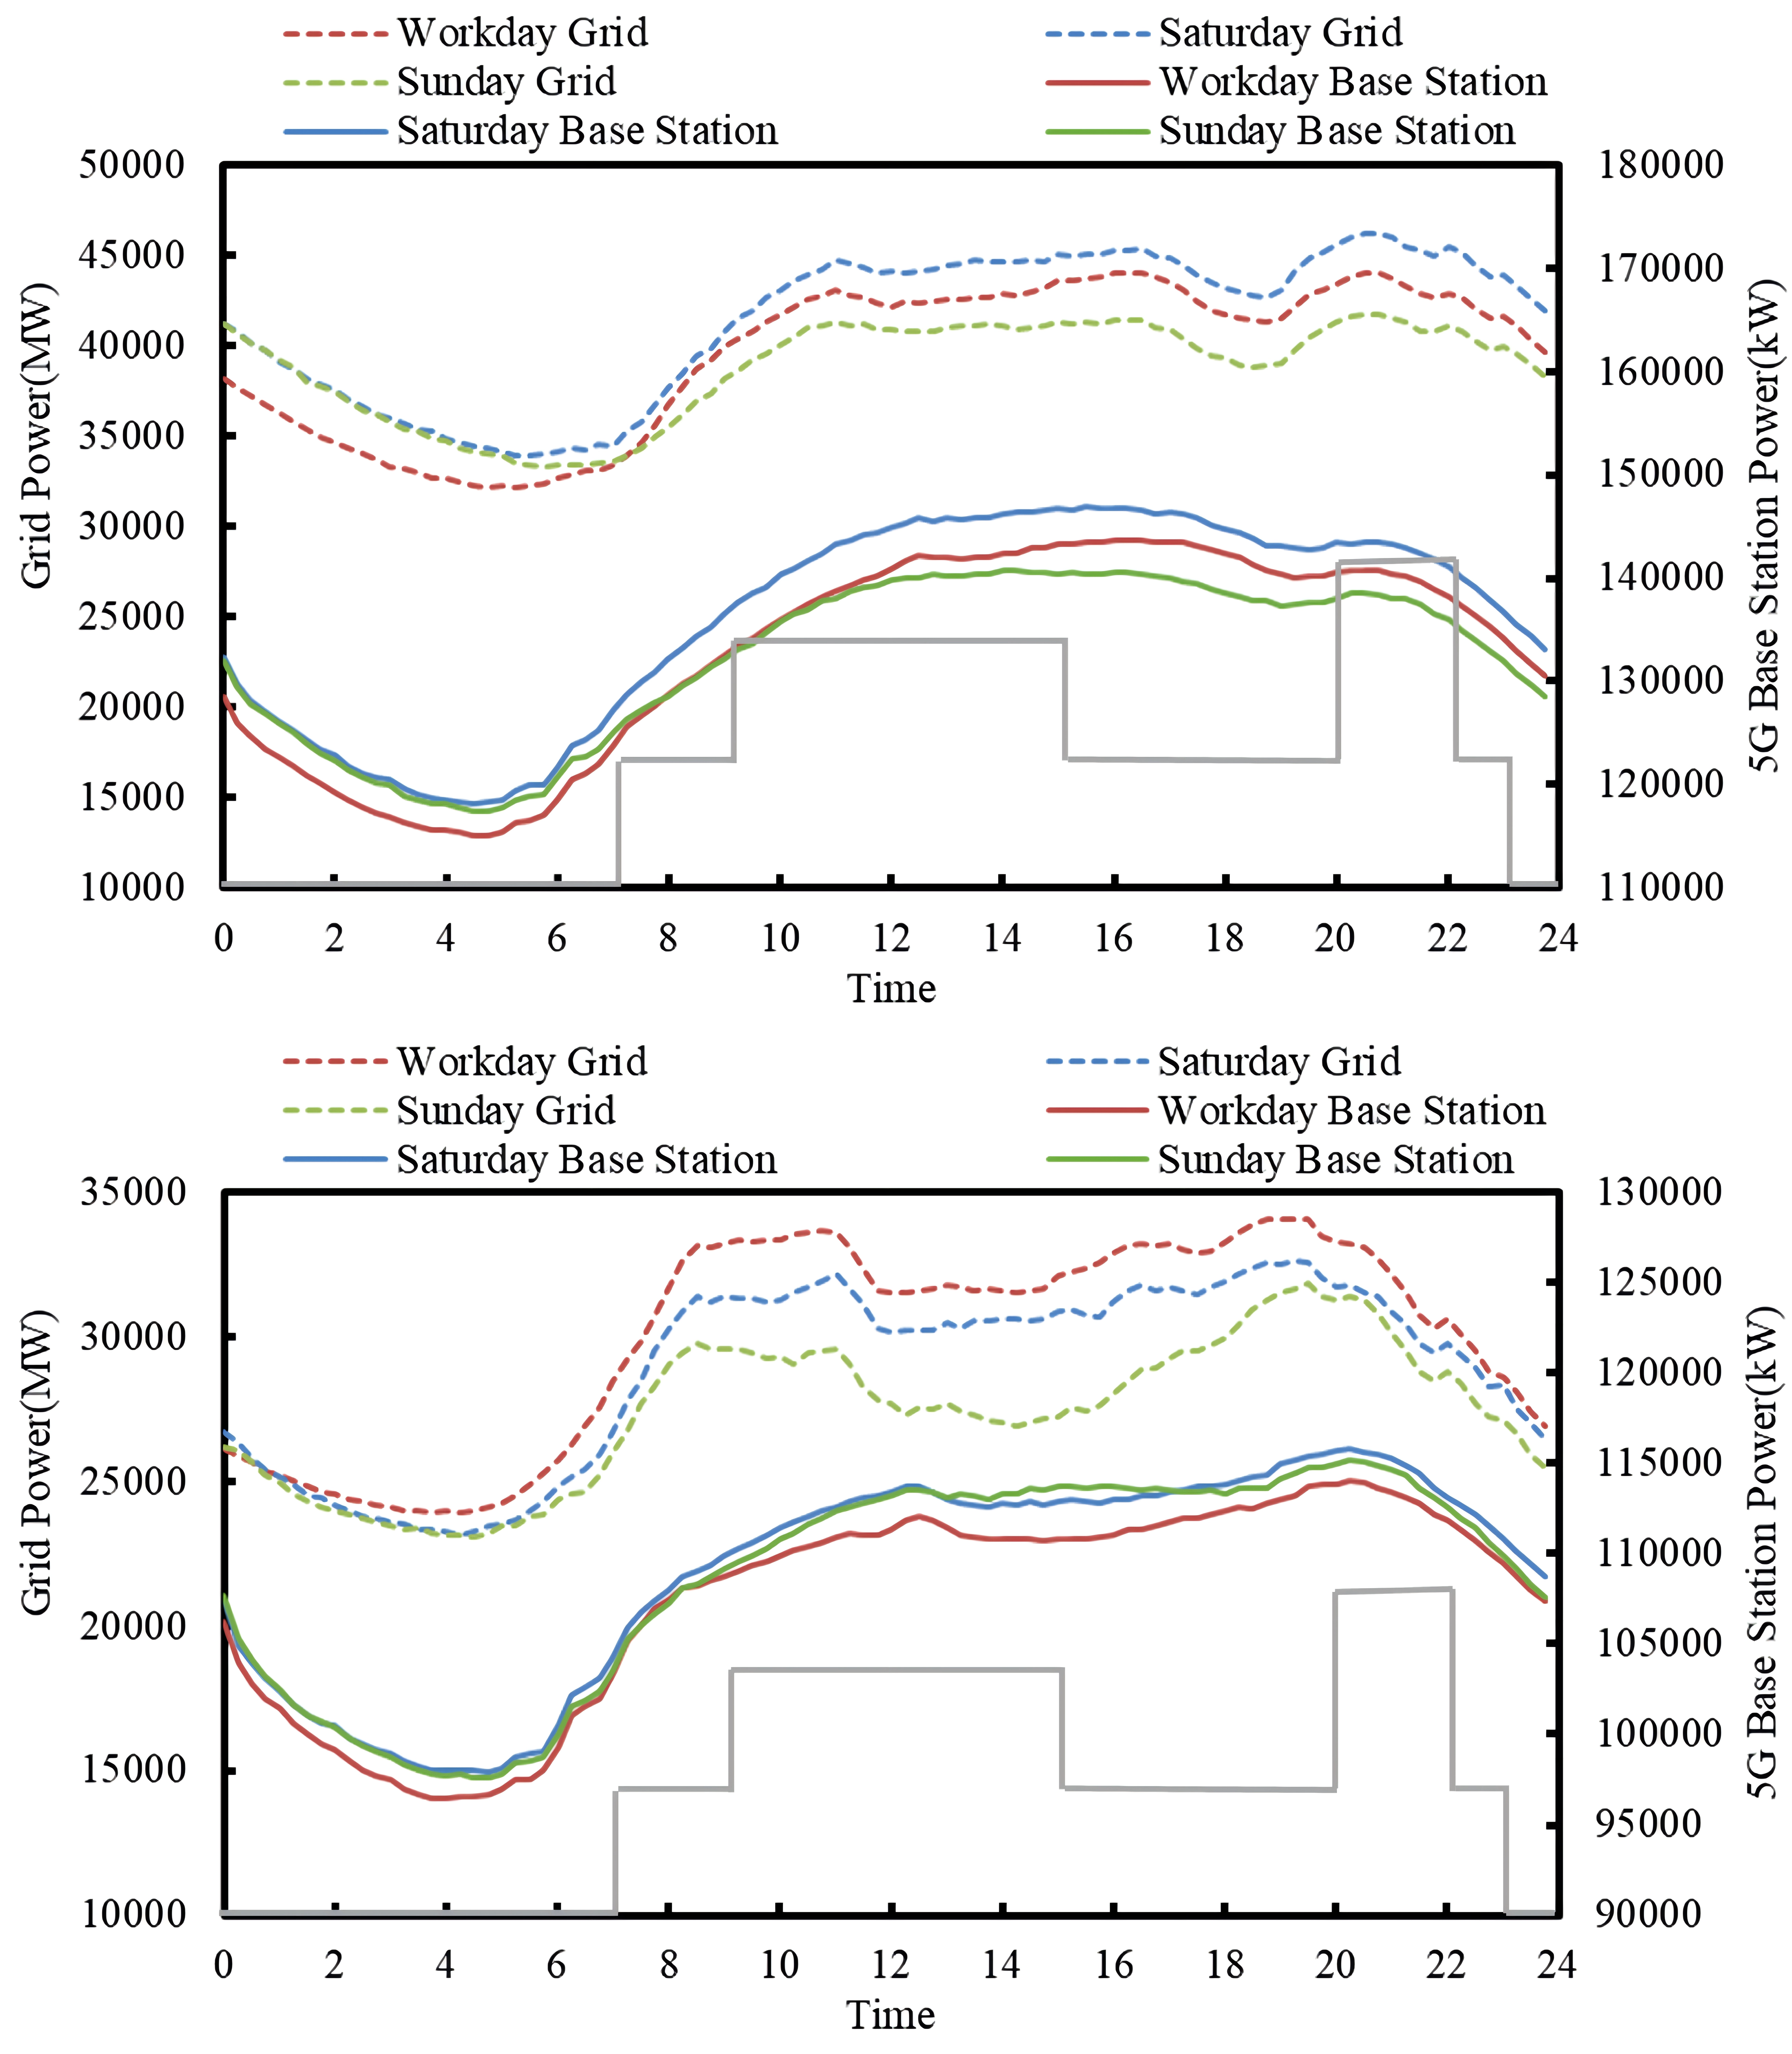
Figure 20. Daily load patterns of 5G base stations and provincial grid with time-of-use electricity pricing. (a) Summer daily load curves with tariff periods; (b) Winter daily load curves with tariff periods.
Beyond operator cost savings, coordinated load management could provide urban-grid-level benefits. Temporal synchronization between base station and grid peaks means that even modest load shifting from thousands of stations could measurably reduce peak demand during critical periods. Because 5G base stations are embedded within the urban fabric, co-located with commercial districts, residential communities, and transportation hubs, their distributed energy storage capacity forms a geographically flexible network of urban flexibility resources, enabling targeted demand response in areas with localized capacity constraints. However, realizing this potential requires addressing operational constraints: telecommunications service quality requirements limit the depth and duration of load curtailment, backup power obligations constrain battery availability, and coordination mechanisms between grid operators and telecommunications providers remain underdeveloped. The feasibility and effectiveness of large-scale base station demand response therefore warrant further investigation through pilot programs and techno-economic analysis.
4.3.3 Peak and off-peak characteristics of the 5G station loads
To characterize temporal load distribution patterns across tariff periods, load ratios during peak, flat, and valley periods (8 hours each, defined by time-of-use pricing policy) are analyzed for 37,525 base stations. The load ratio for each period is calculated as cumulative consumption during that period divided by total daily load. K-means clustering (k = 2) applied to these ratios reveals two distinct consumption patterns, as shown in Figure 21. Cluster 1 (582 stations, 1.6%) exhibits pronounced peak-valley differentiation, with a peak-load ratio of approximately 45% and a substantially lower valley-load ratio of approximately 16%. Cluster 2 (36,943 stations, 98.4%) exhibits a relatively balanced distribution across the three periods, with a peak-load ratio of approximately 35% and a valley-load ratio of approximately 30%. In the analyzed sample, the 29-percentage-point peak-valley difference in Cluster 1 suggests relatively greater load-shifting potential at individual stations. However, because this cluster contains only 1.6% of the stations, its contribution to aggregate peak reduction is limited. Cluster 2 shows a smaller peak-valley difference of about 5 percentage points, suggesting more limited load-shifting potential at individual stations; nevertheless, its 98.4% share means coordinated modest adjustments across many stations could still contribute to aggregate peak reduction. This suggests that effective demand response strategies must differentiate between intensive load shifting from the small, high-differentiation cluster and modest coordinated adjustments across the large balanced-load majority, with the latter well suited to automated aggregation within smart urban energy management systems.
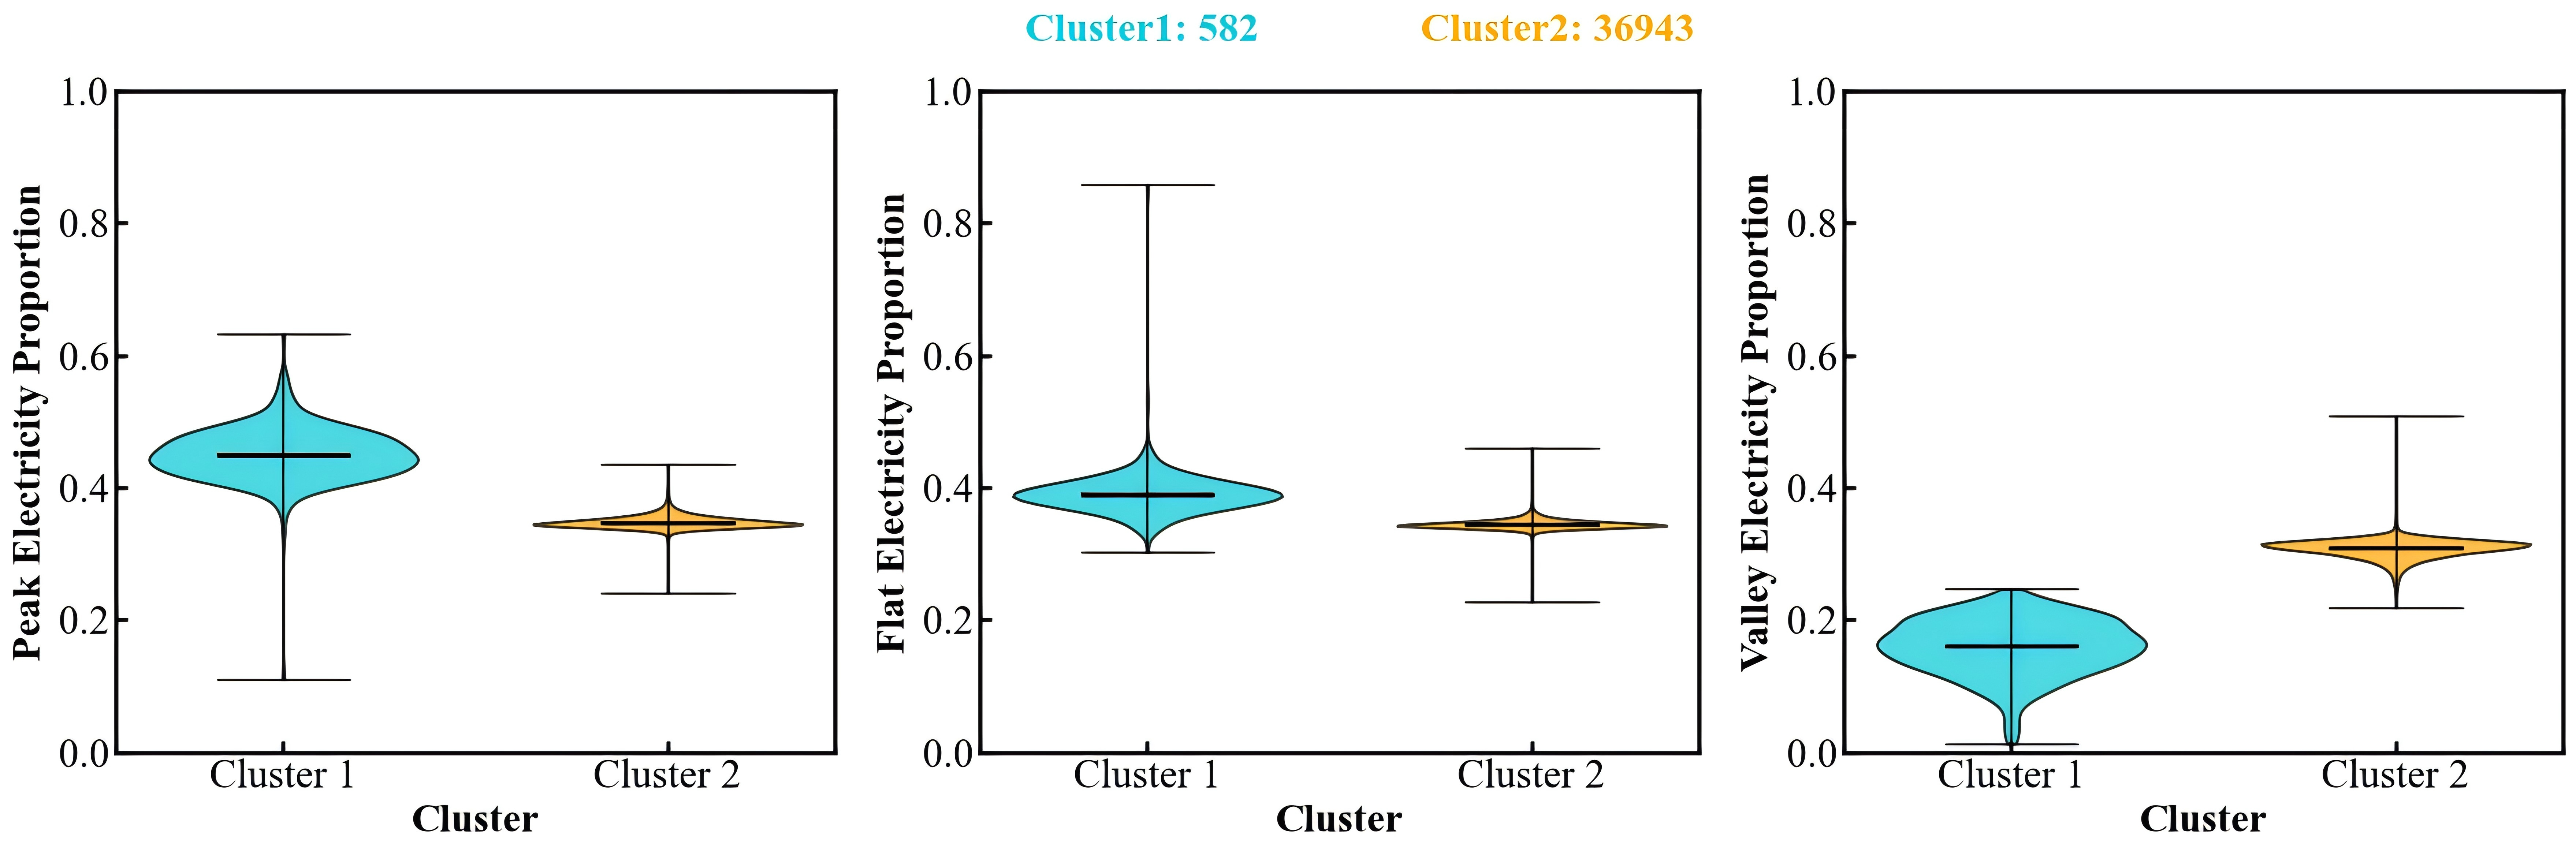
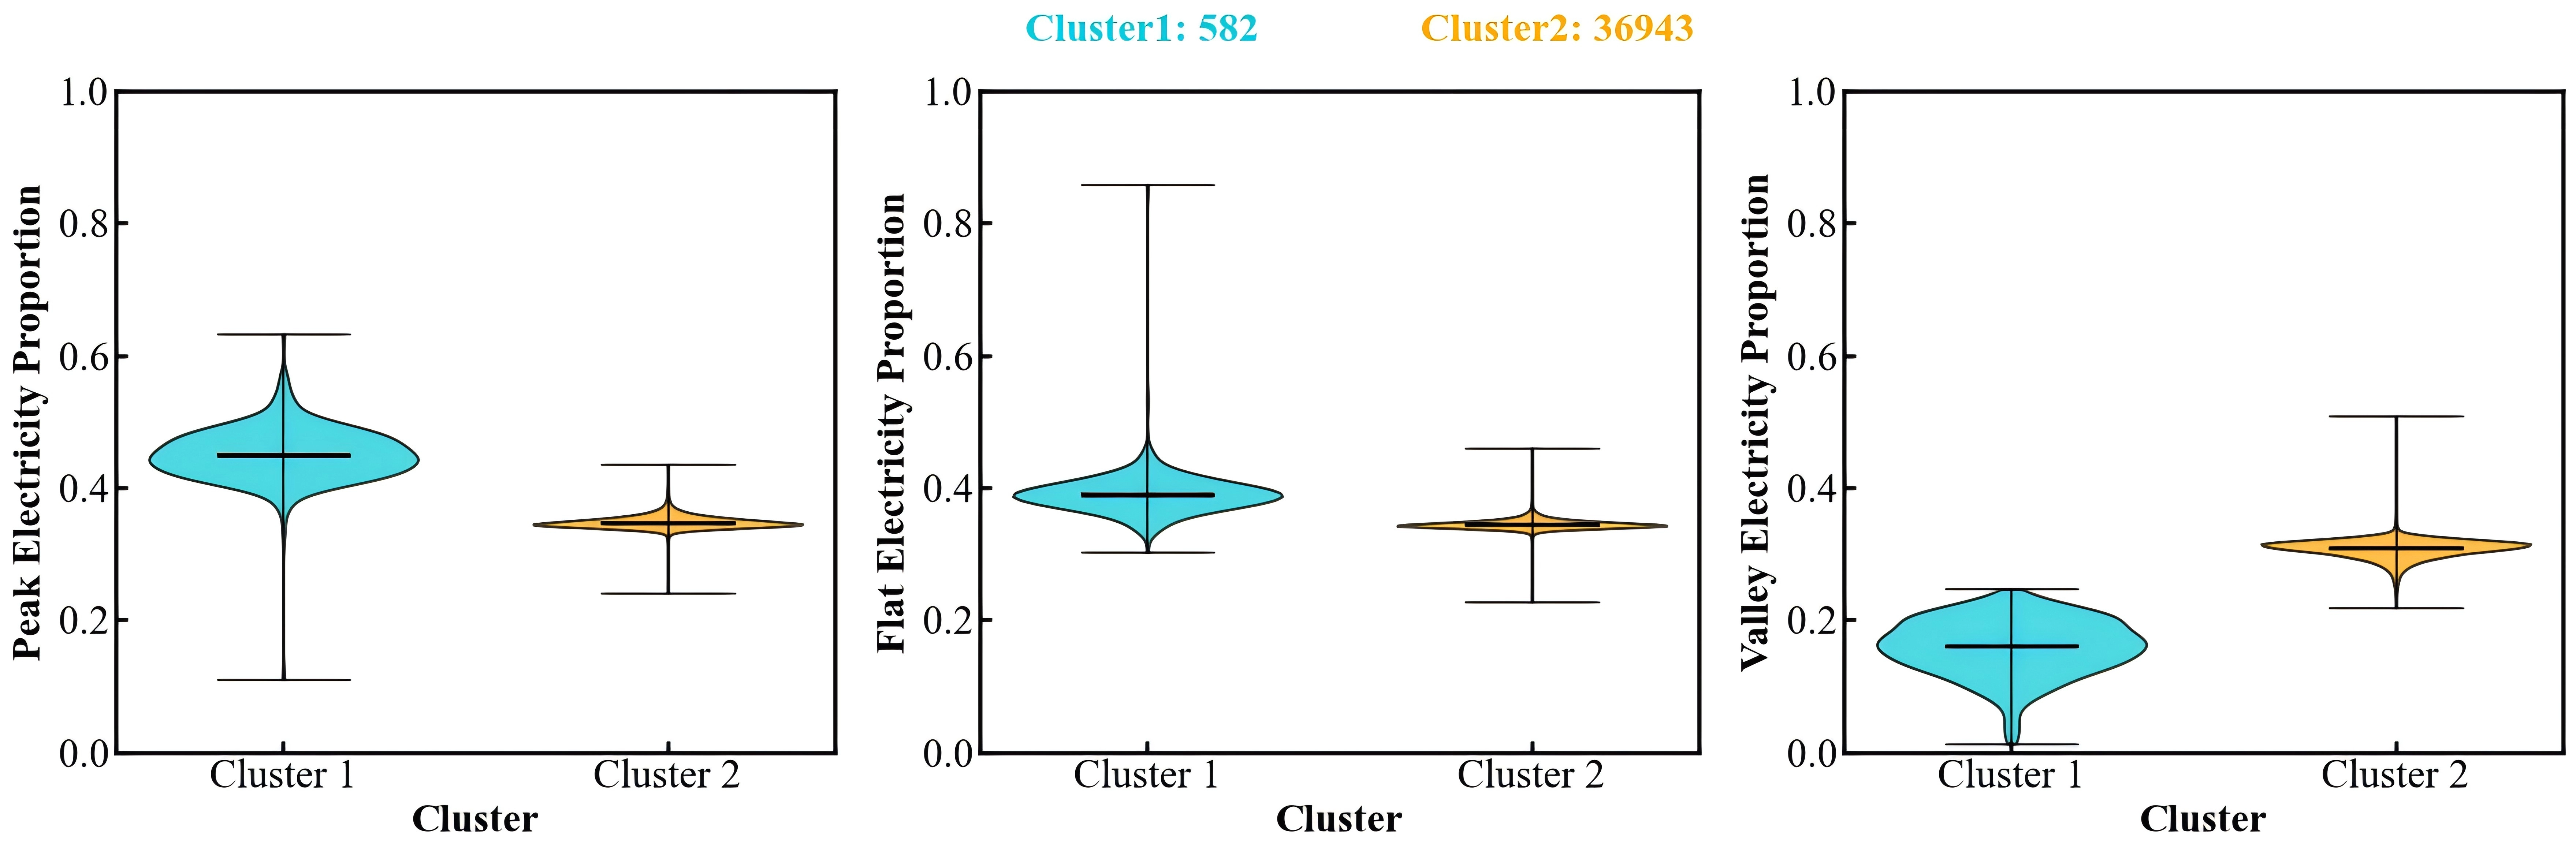
Figure 21. Clustering results of peak, flat, and valley load rates for 5G base stations.
5. Discussion
Using real-world electricity data from 37,525 5G base stations, this study provides province-scale empirical evidence on their spatial and temporal load characteristics and interactions with the regional grid. These findings provide practical insights for planning and managing the electricity demand of 5G infrastructure in different regional contexts. First, the strong spatial association between base-station deployment and population density indicates that 5G base-station loads should be explicitly incorporated into distribution-network load forecasting and planning, particularly in densely populated areas. Second, 5G base-station loads are not constant but vary with temperature and season. Temperature and seasonal variations should therefore be incorporated into base-station energy-consumption forecasts, enabling telecommunications operators to prepare seasonal energy budgets and optimize cooling operations and energy-saving measures. Third, although the analyzed base-station loads represented a relatively small share of total grid demand, their strong temporal synchronization with the grid may still intensify peak-period pressure. Coordinated use of backup batteries for load shifting could therefore reduce both grid peak demand and telecommunications operators’ electricity costs during high-tariff periods. Finally, the marked differences among base-station load patterns indicate that a uniform energy-management strategy is unlikely to be appropriate. Base stations should instead be grouped according to their observed load profiles, with energy-management measures designed for the resulting groups.
Several limitations should be considered when interpreting these findings. Although the 2 kW power threshold and missing-data criteria were applied to improve data quality, they may have excluded stations with lower power demand or incomplete records, thereby affecting the composition of the retained sample and the resulting quantitative estimates. Detailed station-level information on site type and communication traffic was unavailable, limiting further investigation of how deployment contexts and operational patterns influence the observed load characteristics. In addition, the 15-minute-resolution data covered only two representative 14-day periods. This temporal coverage may limit the assessment of load variability over longer periods. Future studies using longer-term data could further evaluate the robustness of these findings.
6. Conclusions
Using large-scale, real-world electricity data, including power measurements at 15-minute resolution, this study provides a province-scale empirical assessment of the load characteristics of 5G base stations in Hubei Province, China. The analysis identifies their spatial and temporal load patterns and interactions with the regional grid, providing empirical evidence for urban energy planning, telecommunications operations, and power-system management. The main conclusions are as follows:
• Base station deployment is strongly correlated with population density (r = 0.92), following an economically driven strategy that prioritizes high-demand urban areas over uniform geographic coverage. This results in pronounced urban-rural disparities and substantial power density variations across the province, with urban areas experiencing significantly higher deployment density and electrical load intensity.
• The loads of 5G stations exhibit strong seasonal characteristics driven by temperature-dependent cooling demands. On average, summer power is 1 kW higher than winter power due to air conditioner use. Temperature sensitivity analysis reveals substantial heterogeneity across stations (correlation coefficients ranging from -0.59 to 0.89), driven by user behavior and the location of the 5G base stations. However, the regional aggregation loads show clear seasonal patterns, with strong summer correlation (r = 0.738) and weaker winter correlation (r = 0.360). This is because air conditioners work mainly on summer days and shut down in winter. In addition, consistently low capacity utilization rates (26-41%) indicate substantial infrastructure redundancy.
• The electricity loads of 5G base stations demonstrate high temporal synchronization with the grid demand, which indicates that they would bring peak stress during peak hours. Strong phase-locking exists between base station and provincial grid loads, with stronger summer alignment (PLV 0.912) than in winter (PLV 0.816). Peak consumption periods coincide with high-price tariff windows, meaning 5G base station loads actively compound system stress during critical peak periods. However, this characteristic, combined with widespread backup battery systems, reveals significant demand response potential through coordinated load-shifting strategies.
• Operational heterogeneity across different base stations necessitates differentiated energy management strategies. Multi-scale clustering analysis reveals distinct load-pattern groups: 73.5% of stations exhibit temperature-correlated seasonal profiles, while 26.5% show relatively stable patterns; 98.4% display balanced peak-valley distributions, while 1.6% demonstrate pronounced differentiation. This heterogeneity indicates that uniform control approaches will be suboptimal, requiring adaptive strategies that account for local operational characteristics and service area features.
This study demonstrates that 5G base station loads are deeply coupled with urban spatial structure, building-driven thermal demands, and grid operational rhythms. The findings suggest significant opportunities to optimize base-station deployment, energy utilization, and grid integration strategies. The latent demand response capacity within distributed base station battery systems presents a promising avenue for enhancing urban grid resilience. Future research should focus on developing city-scale adaptive energy management frameworks and quantifying the techno-economic potential of base station flexibility within urban demand response programs.
Acknowledgements
The authors thank State Grid Hubei Electric Power Research Institute for providing the 5G base-station data used in this study.
Authors contribution
Dong S: Conceptualization, methodology, formal analysis, investigation, visualization, writing-original draft.
Liu M: Conceptualization, methodology, data curation, writing-original draft.
Ling Z: Data curation, writing-review & editing.
Chen K, Zhang Y: Formal analysis, investigation.
Hao X: Visualization.
Gang W: Conceptualization, writing-review & editing, supervision.
All authors read and approved the final manuscript.
Conflicts of interest
The authors declare no conflicts of interest.
Ethical approval
Not applicable.
Consent to participate
Not applicable.
Consent for publication
Not applicable.
Availability of data and materials
The DEM, population-density, and administrative-boundary datasets used in this study are publicly available. The DEM data were obtained from the SRTMDEM 30 m dataset provided by the Geospatial Data Cloud (https://www.gscloud.cn/); population-density data were obtained from the LandScan dataset developed by Oak Ridge National Laboratory (ORNL) (https://landscan.ornl.gov/); and administrative-boundary data were obtained from the Administrative Division Visualization dataset provided by the National Geomatics Center of China through Tianditu (https://cloudcenter.tianditu.gov.cn/dataSource). In contrast, the 5G base-station electricity-load data analyzed in this study are not publicly available because of confidentiality agreements with State Grid Hubei Electric Power Research Institute and contain proprietary information regarding 5G base-station operations. These data are available from the corresponding author upon reasonable request and with permission from the data provider.
Funding
None.
Copyright
© The Author(s) 2026.
References
-
1. Wang Y, Chen QX, Zhang N, Feng C, Teng F, Sun MY, et al. Fusion of the 5G communication and the ubiquitous electric internet of things: Application analysis and research prospects. Power Syst Technol. 2019;43(5):1575-1585. Chinese.[DOI]
-
2. Wang Q, Zhao X, Lv Z, Ma X, Zhang R, Lin Y. Optimizing the ultra-dense 5G base stations in urban outdoor areas: Coupling GIS and heuristic optimization. Sustain Cities Soc. 2020;63:102445.[DOI]
-
3. Wu Y, Rajnai Z. 5G standardisation: Case study in China. In: 2024 IEEE 22nd World Symposium on Applied Machine Intelligence and Informatics (SAMI); 2024 Jan 25-27; Stará Lesná, Slovakia. Piscataway: IEEE; 2024. p. 133-138.[DOI]
-
4. Cheng X, Hu Y, Varga L. 5G network deployment and the associated energy consumption in the UK: A complex systems’ exploration. Technol Forecast Soc Change. 2022;180:121672.[DOI]
-
5. Williams L, Sovacool BK, Foxon TJ. The energy use implications of 5G: Reviewing whole network operational energy, embodied energy, and indirect effects. Renew Sustain Energy Rev. 2022;157:112033.[DOI]
-
6. I CL, Han S, Bian S. Energy-efficient 5G for a greener future. Nat Electron. 2020;3(4):182-184.[DOI]
-
8. Buzzi S, Chih-Lin I, Klein TE, Poor HV, Yang C, Zappone A. A survey of energy-efficient techniques for 5G networks and challenges ahead. IEEE J Sel Areas Commun. 2016;34(4):697-709.[DOI]
-
9. Israr A, Yang Q, Israr A. Emission-aware sustainable energy provision for 5G and B5G mobile networks. IEEE Trans Sustain Comput. 2023;8(4):670-681.[DOI]
-
10. Ding Y, Duan H, Xie M, Mao R, Wang J, Zhang W. Carbon emissions and mitigation potentials of 5G base station in China. Resour Conserv Recycl. 2022;182:106339.[DOI]
-
11. Israr A, Yang Q, Israr A. Renewable energy provision and energy-efficient operational management for sustainable 5G infrastructures. IEEE Trans Netw Serv Manag. 2023;20(3):2698-2710.[DOI]
-
12. Wang Y, Han J, Liu Z, Wang Y, Feng X. Impact of 5G base station participating in grid interaction. In: 2022 7th Asia Conference on Power and Electrical Engineering (ACPEE); 2022 Apr 15-17; Hangzhou, China. Piscataway: IEEE; 2022. p. 586-590.[DOI]
-
13. Yao X, Zhang Y, Zhang F, Qiu Y, Liu A, Mo J, et al. Research on power load characteristics and cluster analysis of 5G communication base stations. In: 2023 3rd International Conference on Energy Engineering and Power Systems (EEPS); 2023 Jul 28-30; Dali, China. Piscataway: IEEE; 2023. p. 864-867.[DOI]
-
14. Ahmed A, Coupechoux M. The long road to sobriety: Estimating the operational power consumption of cellular base stations in France. In: 2023 International Conference on ICT for Sustainability (ICT4S); 2023 Jun 5-9; Rennes, France. Piscataway: IEEE; 2023. p. 188-196.[DOI]
-
15. Meng F, Zhang Q, Lin Y, Zou S, Fu J, Liu B, et al. Field study on the performance of a thermosyphon and mechanical refrigeration hybrid cooling system in a 5G telecommunication base station. Energy. 2022;252:123744.[DOI]
-
16. Zhang Y, Zhao Y, Dai S, Nie B, Ma H, Li J, et al. Cooling technologies for data centres and telecommunication base stations—A comprehensive review. J Clean Prod. 2022;334:130280.[DOI]
-
17. Song M, Bai W, Lu S, Wen J, Sun W, Hu Q, et al. Sequential load restoration with decision-dependent 5G base station backup batteries for resilient distribution systems. Appl Energy. 2025;396:126268.[DOI]
-
18. Raham MBB, Esha M. A data-driven multi-state sleep mode strategy for energy-efficient 5G base stations. In: 2026 IEEE 2nd International Conference on Quantum Photonics, Artificial Intelligence & Networking (QPAIN); 2026 Apr 16-18; Chittagong, Bangladesh. Piscataway: IEEE; 2026. p. 1-6.[DOI]
-
19. Li X, Ren D, Xu B, Wang P, Liu C, Sun Y, et al. Performance evaluation of hybrid refrigeration system used in telecommunication base station. Appl Therm Eng. 2026;303:132176.[DOI]
-
20. Kalmar I, Barb G, Alexa F, Badra Y, Stanica R. Measurements on the energy consumption of a 5G NSA cellular radio infrastructure. In: 2026 Advanced Topics on Measurement and Simulation (ATOMS); 2026 May 13-15; Cluj-Napoca, Romania. Piscataway: IEEE; 2026. p. 1-4.[DOI]
-
21. Yu L, Wang H, Gao H, Li Y. A data-driven energy consumption prediction model for 5G base stations: Addressing static and dynamic power components. In: 2025 7th International Conference on Frontier Technologies of Information and Computer (ICFTIC); 2025 Dec 5-7; Qingdao, China. Piscataway: IEEE; 2025. p. 1013-1017.[DOI]
-
22. Ghali M, Busson A, Coupechoux M. 5G-EcoSim: A simulation framework for estimating 5G energy consumption using real-world data and analytical models. In: 2026 21st Wireless On-Demand Network Systems and Services Conference (WONS); 2026 Mar 2-4; Crans-Montana, Switzerland. Piscataway: IEEE; 2026. p. 1-8.[DOI]
-
23. Oughton EJ, Frias Z. The cost, coverage and rollout implications of 5G infrastructure in Britain. Telecommun Policy. 2018;42(8):636-652.[DOI]
-
24. Guo J, Wang L, Zhou W, Wei C. Powering green digitalization: Evidence from 5G network infrastructure in China. Resour Conserv Recycl. 2022;182:106286.[DOI]
Copyright
© The Author(s) 2026. This is an Open Access article licensed under a Creative Commons Attribution 4.0 International License (https://creativecommons.org/licenses/by/4.0/), which permits unrestricted use, sharing, adaptation, distribution and reproduction in any medium or format, for any purpose, even commercially, as long as you give appropriate credit to the original author(s) and the source, provide a link to the Creative Commons license, and indicate if changes were made.
Publisher’s Note
Science Exploration remains a neutral stance on jurisdictional claims in published
maps
and institutional affiliations. The views expressed in this article are solely those
of
the author(s) and do not reflect the opinions of the Editors or the publisher.
Share And Cite


Science Exploration Style
Dong S, Liu M, Ling Z, Chen K, Zhang Y, Hao X, et al. Temporal and spatial load characteristics of 5G base stations based on historical electricity data considering impacts on urban energy system. J Build Des Environ. 2026;4:202624. https://doi.org/10.70401/jbde.2026.0045
Tips
Copy completed.
Submit a Manuscript
Author Instructions
Cite this Article
Article Metrics
0
View
0
Download
Cited
Article Updates

- Abstract
- Keywords
- 1. Introduction
- 2. Load Characteristics Analysis Method
- 3. Information on 5G Base Stations at the Regional Level
- 4. Results and Analysis
- 5. Discussion
- 6. Conclusions
- Acknowledgements
- Authors contribution
- Conflicts of interest
- Ethical approval
- Consent to participate
- Consent for publication
- Availability of data and materials
- Funding
- References
- Copyright
 Get citation
Science Exploration Style

Dong S, Liu M, Ling Z, Chen K, Zhang Y, Hao X, et al. Temporal and spatial load characteristics of 5G base stations based on historical electricity data considering impacts on urban energy system. J Build Des Environ. 2026;4:202624. https://doi.org/10.70401/jbde.2026.0045
copy
Share Link
copy