Defects of ferroptosis in tumor-associated M2-macrophages during adverse and recurrent glioblastoma
Christophe Desterke
1,*

,
Rima Elhage
2,3
,
Yuanji Fu
2
,
Clémence Duruel
2,3
,
Rose Cresseaux
2,3
,
Vincent Goffin
2
,
Yunhua Chang-Marchand
2
,
Ahmed Hamaï
2,3,*
*Correspondence to:
Christophe Desterke, UFR Médecine-INSERM UMRS1310, Université Paris-Saclay, Villejuif 94800, France.
E-mail: christophe.desterke@inserm.fr
Ahmed Hamaï, Université Paris Cité, INSERM U1151, CNRS UMR8253, Institut Necker Enfants Malades, Paris 75015, France. E-mail: ahmed.hamai@inserm.fr
Ahmed Hamaï, Université Paris Cité, INSERM U1151, CNRS UMR8253, Institut Necker Enfants Malades, Paris 75015, France. E-mail: ahmed.hamai@inserm.fr
Ferroptosis Oxid Stress. 2026;2:202604. 10.70401/fos.2026.0025
Received: January 30, 2026Accepted: April 15, 2026Published: April 16, 2026
Abstract
Background: Glioblastoma multiforme (GBM) progression relies on active dialog between tumor cells and infiltrating immune cells, mainly including macrophages. Macrophages are closely linked to iron handling and reactive oxygen species (ROS) regulation, suggesting that ferroptosis may play a pivotal role in macrophage behavior.
Methods: Bulk RNA-seq GBM datasets, The Cancer Genome Atlas (TCGA)-GBM and gene set enrichment 4412 (GSE4412) were used to quantify immune infiltration (xCell), identify differentially expressed genes (limma), and extract ferroptosis-related markers (FerrDb V2). Ferroptosis-associated transcriptional programs were visualized using the ferroviz R package. Single-cell RNA-sequencing GBM datasets (GSE189650) were processed to characterize ferroptosis-related signatures and explore the dynamic regulation of ferroptosis-related genes in M2 tumor-associated macrophages (M2-TAMs). Deep learning neural networks were trained to predict recurrence based on ferroptosis hallmarks.
Results: High M2-TAM infiltration in poor-prognosis tumors was associated with a deregulated ferroptosis program defined by nine markers, tumor necrosis factor alpha-induced protein 3 (TNFAIP3), arachidonate lipoxygenase 5 (ALOX5), perilipin 2 (PLIN2), spermidine/spermine-N1-acetyltransferase 1(SAT1), ferritin light chain (FTL), cathepsin B (CTSB), poly (ADP-ribose) polymerase 8 (PARP8), heme oxygenase-1 (HMOX1), autophagy-related 7 (ATG7), validated at single-cell resolution and enriched in CD16+/CD163+ myeloid cells. A ferroptosis score independently predicted M2 infiltration in a clinicobiological multivariable model. Deep learning analyses revealed opposite regulation of TNFAIP3 (repressed ferroptosis driver) and FTL (upregulated ferroptosis suppressor) during recurrence, indicating impaired ferroptosis in M2-TAMs during disease progression. TNFAIP3 expression in primary tumors aligned with a pro-inflammatory signature, whereas FTL expression in recurrent tumors correlated with an invasive program involving apolipoprotein E (APO-E), serpin family E member 1 (SERPINE1), thioredoxin-interacting protein (TXNIP), glycoprotein non‑metastatic melanoma protein B (GPNMB), cystatin C (CST3), dihydrofolate reductase (DHFR), β2-microglobulin (B2M), and nuclear protein-1 (NUPR1).
Conclusion: Glioblastoma-associated macrophages display defective ferroptosis program in aggressive and recurrent tumors, linking reduced inflammatory activity to enhanced invasiveness. Restoring ferroptosis activity in these immune cells may represent a promising therapeutic strategy.
Keywords
Ferroptosis, ferroviz, glioblastoma, invasion, M2-TAM, macrophage, TNFAIP3, FTL, multi-omics
1. Introduction
Glioblastoma multiforme (GBM) is the most common malignant brain tumor in adults and remains one of the deadliest cancers, with a median survival of approximately one year[1,2]. Conventional therapies, including surgery, temozolomide, and radiotherapy, often fail due to intrinsic resistance mechanisms, frequently associated with tumor protein p53 (TP53) and phosphatase and tensin homolog (PTEN) mutations and redundant pro-survival signaling pathways. The GBM tumor microenvironment (TME) is highly heterogeneous and profoundly immunosuppressive, comprising resident brain cells (neurons, astrocytes, oligodendrocytes, microglia), infiltrating immune cells (predominantly monocytes/macrophages), as well as endothelial and mesenchymal stromal cells. Glioma-associated microglia and macrophages are the most abundant population of immune cells, constituting up to thirty percent of the tumor mass[3,4], underscoring their central role in disease biology[5].
Macrophages are broadly classified into two phenotypes: proinflammatory M1 macrophages and anti-inflammatory M2 macrophages, which can switch between states under the influence of microenvironmental factors. This polarization mirrors the T-helper cell classification (Th1/Th2). In gliomas, a high density of CD163+ M2 tumor-associated macrophages (M2-TAMs) correlates with poor prognosis, whereas CD68+ pan-macrophages do not. M2-TAMs promote tumor progression by secreting IL-10, IL-13, and transforming growth factor beta (TGF-β), driving angiogenesis, stimulating stromal cells to produce extracellular matrix proteins, and sustaining cancer stem cell niches[6,7]. Their abundance increases with glioma malignancy, making them a hallmark of aggressive disease.
Ferroptosis, first described as an iron-dependent form of regulated cell death characterized by lipid peroxidation and reactive oxygen species (ROS) accumulation[8], has emerged as a central determinant of therapeutic response. Morphologically, ferroptotic cells exhibit shrunken mitochondria with reduced cristae, ruptured outer membranes, and condensed membranes[8,9]. Beyond its biochemical and morphological definition, ferroptosis has been mechanistically linked to therapy resistance: cancer cells that survive chemotherapy or targeted therapy frequently enter a drug-tolerant persister state characterized by metabolic rewiring and increased reliance on lipid peroxidation pathways. Landmark studies demonstrated that these persister cells develop a strong dependency on glutathione peroxidase 4 (GPX4) to prevent lethal lipid peroxidation, making them highly vulnerable to ferroptosis induction[10,11]. Inhibiting GPX4 selectively eliminates persister cells and prevents tumor regrowth, establishing ferroptosis as a key vulnerability in chemoresistant tumor subpopulations. Consequently, pharmacological activation of ferroptosis or inhibition of its suppressors has been shown to enhance responses to chemotherapy, radiotherapy, and immunotherapy. Notably, compared to M1 macrophages, M2-macrophages have lower levels of ROS and hydrogen peroxide, which implies M1 types proinflammatory and M2 types anti-inflammatory functions[12]. Distinct lipid redox reprogramming has been shown to influence macrophages and microglia sensitivity to ferroptosis according to their polarization stages[13]. However, these findings were obtained outside the context of glioblastoma and did not fully capture the metabolic constraints of the GBM microenvironment.
In the present work, we aimed to investigate the relationship between M2-TAMs and ferroptosis regulation in glioblastoma. By integrating bulk and single-cell transcriptomic analyses with deep learning approaches, our study sought to identify ferroptosis-related markers within the TME and to evaluate their potential role as predictors of disease progression and recurrence.
2. Material and Methods
2.1 Public datasets
2.1.1 Training transcriptome cohort of The Cancer Genome Atlas (TCGA) glioblastoma-multiforme
RNA-sequencing RNA-Seq by Expectation-Maximization (RSEM)[14] counts and clinical data from TCGA Glioblastoma multiforme cohort[15] were downloaded via the Cbioportal website.
2.1.2 Validation transcriptome cohort of glioma with histological grade IV (GSE4412)
Normalized transcriptome matrix of transcriptome dataset Affymetrix Human Genome U133A Array was downloaded and annotated from Gene Expression Omnibus database website[16]. The GSE4412 processed dataset was filtrated to keep samples of patients characterized as histological grade IV of glioma disorder corresponding to glioblastoma diagnosis[17].
2.1.3 Single cell transcriptome of primary and recurrent glioblastoma tumors (GSE189650)
Primary and recurrent human tumor samples single cell transcriptome counts were downloaded from GSE189650 dataset[18] on Gene Expression Omnibus (GEO) database[16]. Single-cell RNA-sequencing of primary GBM tumor and recurrent GBM tumor was processed using the 10X Chromium v2 system (10x Genomics). Reads were sequenced on Illumina NovaSeq 6000 (Homo sapiens) platform technology (Illumina). Bioinformatics pipeline aligned reads to the human genome GRCh38 and demultiplexing were performed with Seurat version 3[19].
2.2 Analysis methods
2.2.1 Transcriptome analyses
Bioinformatics analyses were performed in the R software environment version 4.2.1. Supervised differential expression gene (DEG) analyses were done using the limma R-package version 3.54.2[20]. Bulk transcriptome immune cell deconvolution was performed on whole transcriptome data with the xCell R-package version 1.1.0[21]. M2 macrophage infiltration in bulk transcriptome glioblastoma tumor was tested against overall survival of the patient with survival R-package version 3.5-7[22]. Survival models were plotted in Kaplan Meier representation with survminer R-package version 0.4.9.
2.2.2 Ferroptosis visualization in glioblastoma bulk transcriptome
On TCGA glioblastoma or GSE4412 glioblastoma cohorts, M2 macrophage infiltration was used to stratify the cohort in two groups (M2-low and M2-high) according to overall survival of the patients. Differential expression gene analysis between M2-low and M2-high patient samples was conducted with LIMMA R-package version 3.52.4[20]. Based on ferrDb V2 database[23], a “ferroviz” R-package was built to improve visualization of ferroptosis-related genes among differential expressed genes and is accessible at the address: https://github.com/cdesterke/ferroviz and already benchmarked on breast cancer data[24].
2.2.3 Ferroptosis score determination according to M2 macrophage infiltration
Loops of univariate logistic regression analyses (binary outcome: M2 macrophage infiltration) against expression of ferroptosis markers were computed with “logitloop” R-package (version 1.0.0) available at the following web address:
Optimal ferroptosis score threshold stratification according M2-macrophage infiltration in tumors was obtained with cutpointr R-package version 1.1.2[25]. Transcriptome expression heatmap and associated unsupervised clustering (Euclidean distances) were drawn with pheatmap R-package version 1.0.12. Multivariable “logit” model was constructed with “glm” function in R base by including ferroptosis score categories with age at diagnosis, gender and significant biological parameters such as O6-methylguanine-DNA methyltransferase (MGMT)-promoter methylation, genomic instability, and subtypes of glioblastoma. Univariate binomial analyses on clinical data were performed with Publish R-package version 2023.01.17. Graphical representations (boxplots and scatterplots) were drawn with ggplot2 R-package version 3.4.4[26].
2.2.4 Single cell transcriptome cluster analysis
Raw counts of single cell transcriptome were used as input files to create individual Seurat object with Seurat R-package version 4.2.1[27]. Single cell quality preprocessing was carried out via filtration of cells expressing less than 300 features and via filtration of features expressed in less than 100 cells by experimental condition. Individual Seurat objects were integrated by canonical correlation and normalized on their common anchors. Data of the integrated object were scaled. A first-dimension reduction in the data was performed by principal component analysis (PCA) on thirty dimensions and a second one by uniform manifold approximation and projection (UMAP) on the twenty first dimensions of the PCA. Cells were clustered with a graph-based algorithm[28] and visualized by heatmap, dotplot, ridgeplot, featuresplot and violinplot graphical representations.
2.2.5 Ferroptosis deep-learning model to predict recurrence of glioblastoma in M2-macrophages
Single cell expression (M2-macrophage) of ferroptosis markers ATG7, PARP8, TNFAIP3, SAT1, CTSB, PLIN2, ALOX5, FTL and HMOX1 were used as input parameters of a neural network with binary outcome: recurrence status of the glioblastoma tumors. The neural network was built on one layer of perceptrons with the «nnet» method and trained with caret R-package version 6.0-94[29]. Garson importance of each feature to predict recurrency was determined on the model with NeuralNetTools R-package version 1.5.3[30]. Accuracy and Cohen Kappa coefficient were computed for each grid condition on decay and size grids. The black box of the neural network was opened with the lime R-package version 0.5.3 by evaluation of the weight of each input feature in each cell analyzed during the prediction of recurrence.
2.2.6 Single cell M2 macrophage cell trajectory
After exporting count data and metadata of «C2» Seurat Cluster (M2 macrophages) from human glioblastoma samples (primary and recurrent tumors) from single cell transcriptome dataset GSE189650 a monocle single cell object was built with monocle 2 R-package under negative binomial distribution family[31]. Cell hierarchy was defined on alternative expression between TNFAIP3 and FTL. DEGs were determined on cell type hierarchy. Pseudotime transformation was performed with “DDRTree” algorithm version 0.1.5[32] and Pseudotime expression heatmap was drawn on the best 75 most significant genes identified on cell trajectory. Functional enrichment performed on Gene Ontology database was done with cluster profile version 4.6.2[33]. Literature based gene text mining was performed with standalone application GeneValorization version 1.3.9 on NCBI “Pubmed” database.
3. Results
3.1 Regulation of ferroptosis is associated with the M2 macrophage infiltration in the transcriptome of adverse glioblastoma tumors
Bulk RNA-sequencing data from the TCGA-GBM multiforme cohort[15] were used to quantify immune infiltration through transcriptome deconvolution with the xCell algorithm. M2 macrophages have previously been reported to increase in proportion to glioma malignancy, and their infiltration has been identified as an indicator of disease severity. Immune quantification of M2 macrophage infiltration in the TCGA-GBM cohort was stratified according to overall survival. Based on log-rank survival statistics, the cohort was divided into two groups: patients with high M2 macrophage infiltration scores (red) and patients with low scores (blue) (Figure 1A). Kaplan–Meier analysis and overall survival log-rank testing revealed a significant difference in prognosis between the two groups (log rank test p-value = 0.029, Figure 1B), with shorter survival observed in patients with higher M2 macrophage infiltration (means: 13.1 months versus 16.2 months, Table 1). Unsupervised transcriptome analysis further identified four clusters, classical (CL), mesenchymal (MES), neural (NE), and pro-neural (PN), that were tightly associated with genomic abnormalities[34]. Stratification of the TCGA-GBM cohort by M2 macrophage score revealed significant differences in glioblastoma subtypes between the two groups (p-value < 1.10-4, Table 1): patients with high scores of M2-macrophage infiltration were more frequently classified as MES and NE, and less frequently as PN, classical, or glioma CpG island methylator phenotype (G-CIMP)[35]. Patients with high M2 scores also showed a lower proportion of MGMT promoter methylation (p-value = 0.05, Table 1) and a trend toward higher dual genomic instability of chromosomes 7 and 10 (p-value = 0.07, Table 1). The ESTIMATE immune algorithm confirmed significantly higher immune (p-value < 1.10-4), stromal (p-value < 1.10-4), and combined (p-value < 1.10-4) scores in patients with high M2 infiltration (Table 1). No significant differences were observed between the two groups in terms of telomerase reverse transcriptase (TERT) expression, co-alteration of chromosomes 19-20, aneuploidy percentage, gender, age at diagnosis, isocitrate dehydrogenase (IDH) mutation status, or non-synonymous tumor mutation burden (Table 1). Supervised differential gene expression analysis using the limma algorithm was performed between patients with low and high M2 infiltration. Intersecting these results with the FerrDbV2 ferroptosis database revealed major upregulation of ferroptosis-related genes in tumors from patients with high M2 infiltration compared to those with low infiltration (Figure 1C). Iterative logistic regression with “logitloop” software was performed for testing ferroptosis actor expression (FerrdbV2) against M2-macrophage infiltration categories (low versus high): 198 ferroptosis-related genes were found to be associated with M2-infiltration (beta coefficients for best thirty ones, Figure S1A). Unsupervised PCA of these 198 genes demonstrated clear stratification of M2 macrophage infiltration along the first principal axis (Figure 2A). This ferroptosis-related signature also confirmed the stratification of MGMT-promoter methylation status, with methylated promoter samples positioned on the left side of the principal map, corresponding to patients exhibiting low M2 infiltration (Figure 2B), and IDH mutation status stratification with mutated samples on left corresponding to patients with low M2-infiltration (Figure 2C). No stratification was observed by gender (Figure 2D). By unsupervised classification (Euclidean distance) expression of ferroptosis genes in glioblastoma tumors confirmed M2-macrophage infiltration stratification, IDH mutation status and MGMT-promoter status with gender independence on heatmap representation (Figure 2E). To confirm these findings, Affymetrix transcriptomes from a glioma cohort (GSE4412)[17] were used to isolate samples with histological grade IV corresponding to glioblastoma diagnosis. This cohort restricted to glioblastoma diagnosis comprised 59 samples with heterogeneity of overall survival according to hierarchical (Figure S2A) and survival clusters (Figure S2B) from the original publication[17]. On these samples, in relation with overall survival, age of diagnosis with a threshold of 48 years old (Figure S2C) could be determined to significantly discriminate the prognosis of the patients (log rank test p-value = 0.041, Figure S2D) with shorter survival in older patients. Immune infiltration in samples of grade IV in this validation cohort (GSE4412) was scored with the “xCell” algorithm. M2-macrophage infiltration scores were also stratified in low and high score categories according to overall survival of the patients (Figure 3A). In this validation cohort, patients with higher score of M2-macrophage infiltration exhibited significantly shorter survival compared to those with low M2-macrophage infiltration (log rank test p-value = 0.0042, Figure 3B), with mean survival times of 196 vs. 414 days (p = 0.028, Table 2). No significant differences were observed between the two groups in terms of gender, age at diagnosis, or the hierarchical and survival clusters defined in the original publication[17] (Table 2).

Figure 1. Ferroptosis regulation according to macrophage immune infiltration in TCGA-glioblastoma multiforme. (A) Optimal threshold for M2 macrophage score according to overall survival of the patients; (B) Kaplan Meier and log rank test for overall survival stratified on M2 macrophage infiltration score; (C) Volcano plot of ferroptosis-related genes differentially expressed between tumors stratified on M2-infiltration scores: low and high (blue genes: suppressor of ferroptosis, orange genes: driver of ferroptosis). TCGA: The Cancer Genome Atlas; GBM: glioblastoma multiforme.
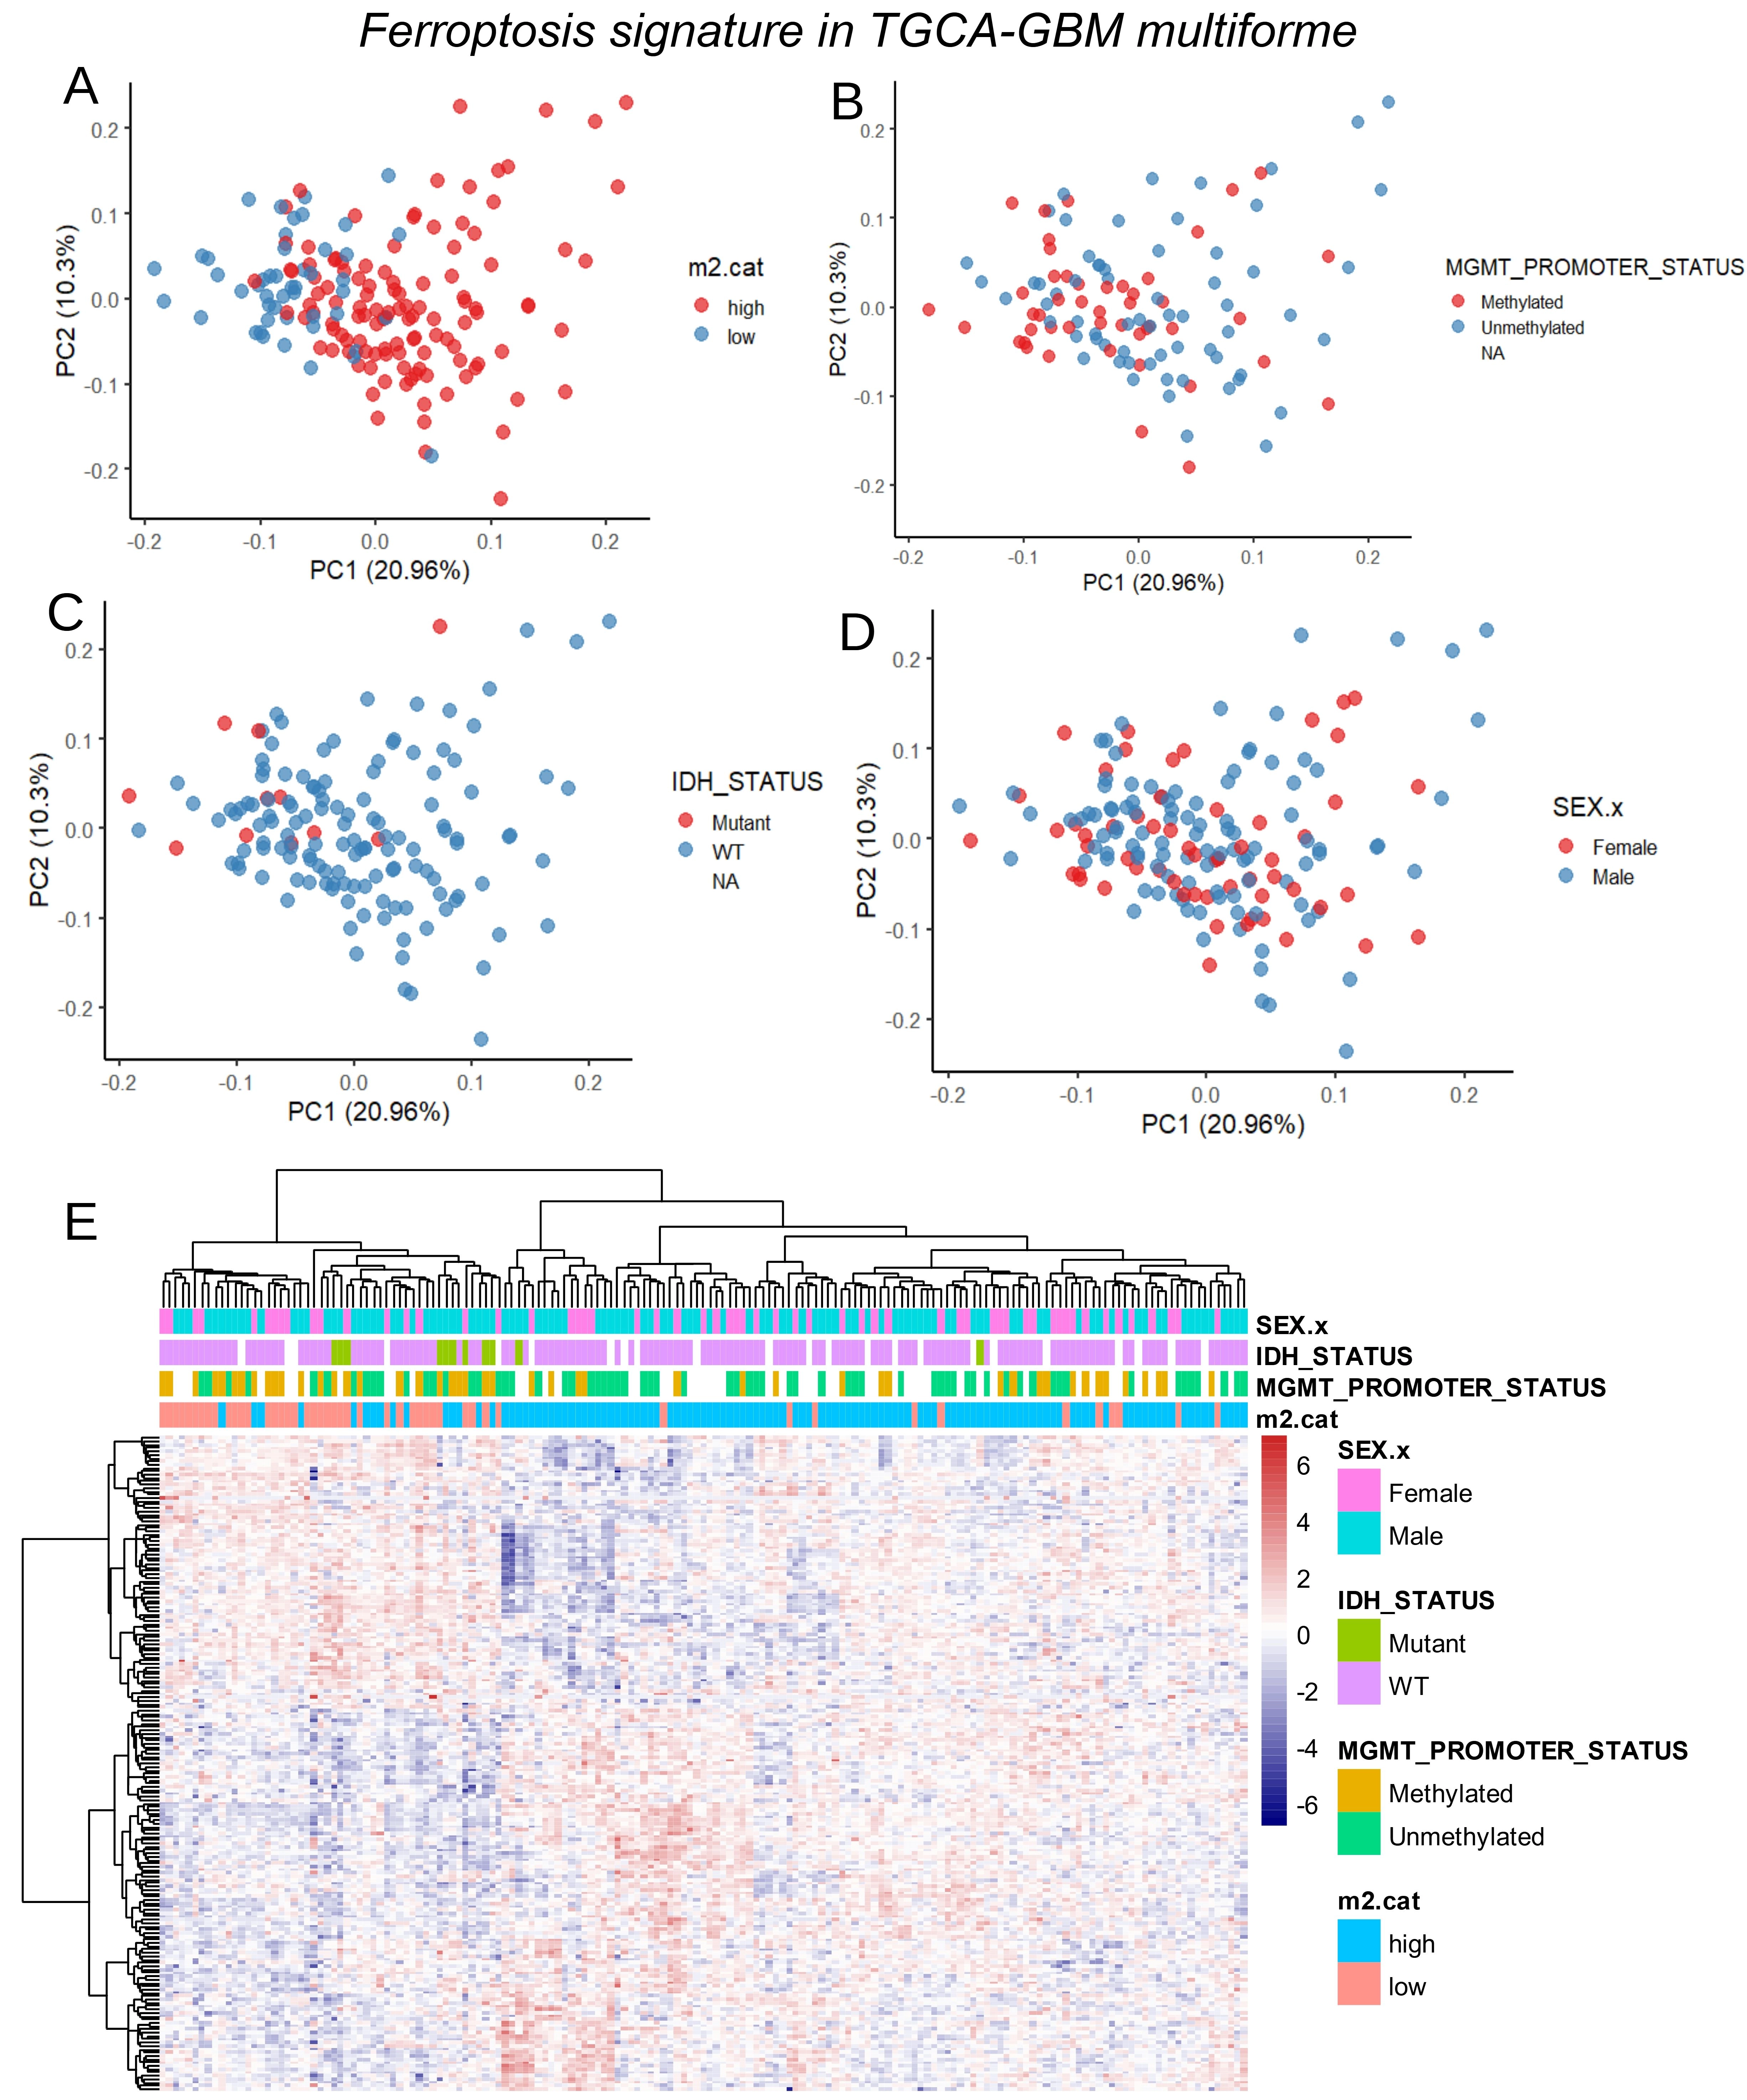
Figure 2. Clinical associations of ferroptosis signature in TCGA-Glioblastoma multiforme tumors. (A) PCA of ferroptosis transcriptional program stratified on M2 infiltration score; (B) PCA of ferroptosis transcriptional program stratified on MGMT promoter methylation status; (C) PCA of ferroptosis transcriptional program stratified on IDH mutation status; (D) PCA of ferroptosis transcriptional program stratified on gender of patients; (E) Expression heatmap with unsupervised clustering (Euclidean distances) for ferroptosis transcriptional program in glioblastoma tumors. TCGA: The Cancer Genome Atlas; GBM: glioblastoma multiforme; PCA: principal component analysis; MGMT: O6-methylguanine-DNA methyltransferase; IDH: isocitrate dehydrogenase.
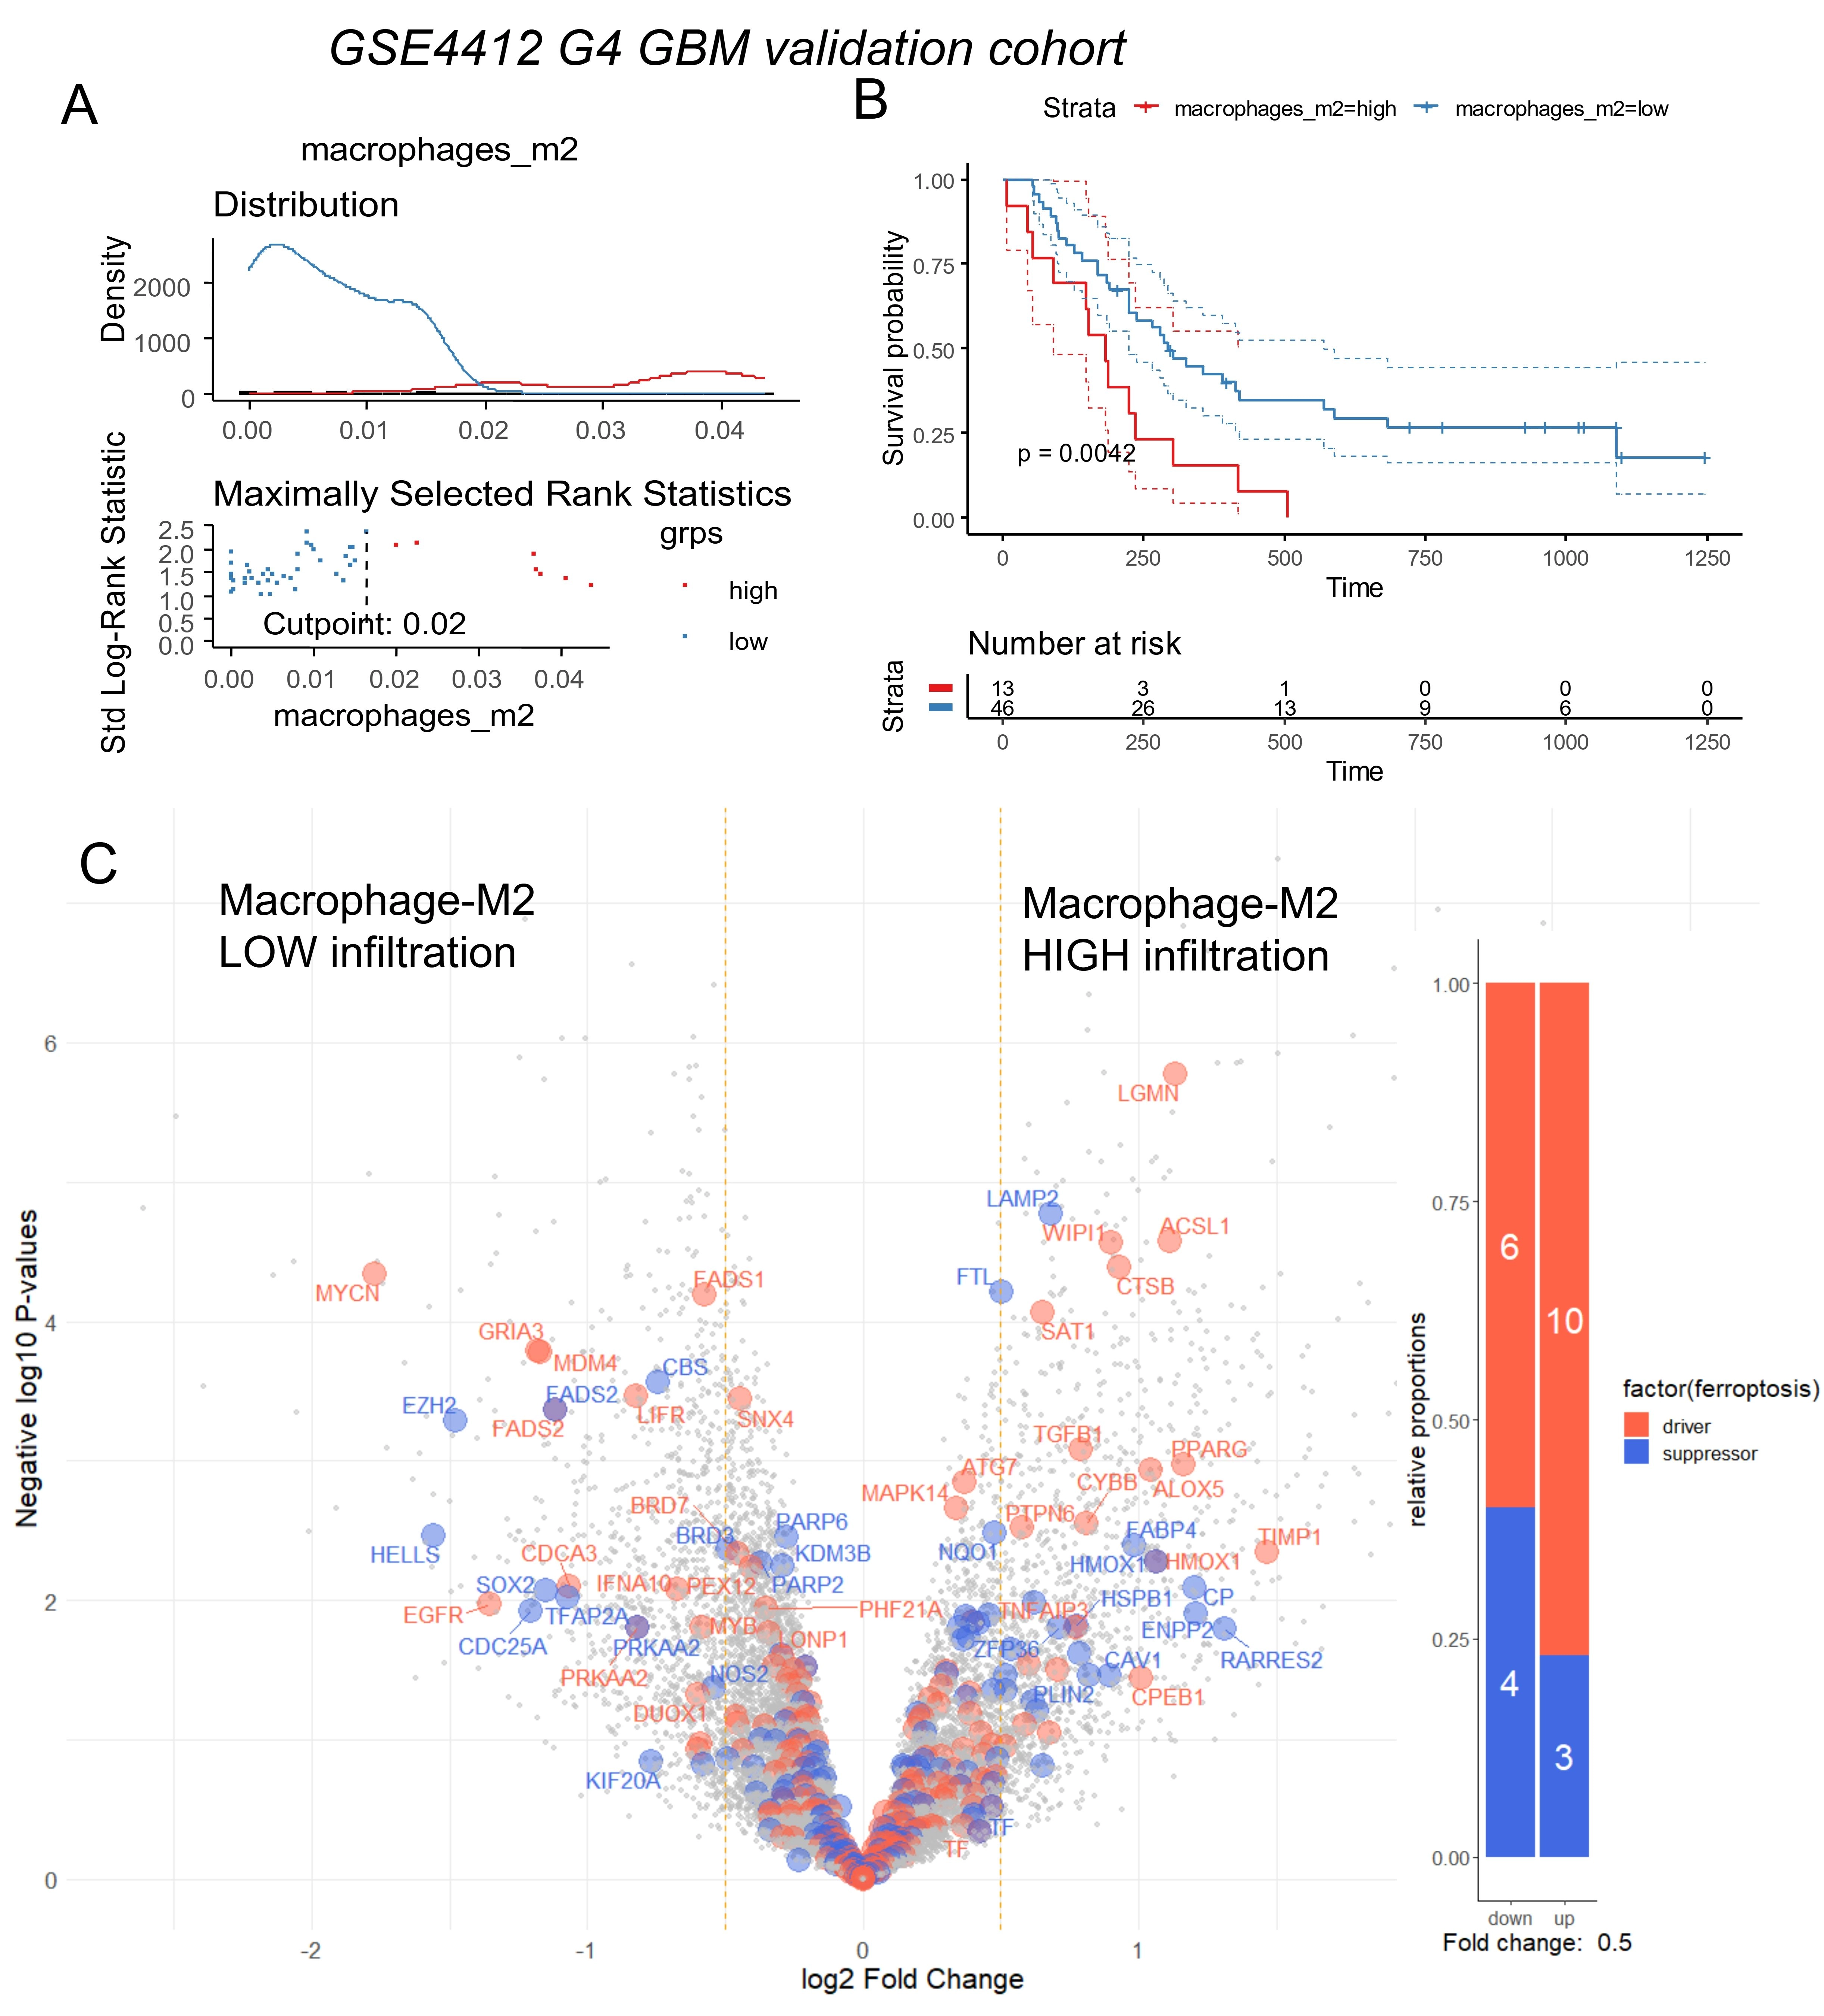
Figure 3. Ferroptosis regulation according to macrophage immune infiltration in glioma stage IV from validation cohort (GSE4412). (A) Optimal threshold for M2 macrophage score according overall survival of the patients; (B) Kaplan Meier and log rank test for overall survival stratified on M2 macrophage infiltration score; (C) Volcano plot of ferroptosis related genes differentially expressed between tumors stratified on M2-infiltration scores: low and high (blue genes: suppressor of ferroptosis, orange genes: drivers of ferroptosis). GBM: glioblastoma multiforme.
Table 1. Clinic-biological characteristics of patients from TCGA-glioblastoma multiforme cohort according to M2-macrophage score stratification.
| Variable | Level | high (n = 117) | low (n = 48) | Total (n = 165) | p-value |
| Overall survival time (months) | mean (sd) | 13.1 (12.9) | 16.2 (11.9) | 14 (12.7) | 0.16085 |
| Overall survival status | Alive | 18 (15.5) | 14 (29.2) | 32 (19.5) | |
| Dead | 98 (84.5) | 34 (70.8) | 132 (80.5) | 0.07340 | |
| Original subtypes | Proneural | 15 (14.9) | 10 (22.7) | 25 (17.2) | |
| Mesenchymal | 43 (42.6) | 6 (13.6) | 49 (33.8) | ||
| Neural | 23 (22.8) | 2 (4.5) | 25 (17.2) | ||
| Classical | 18 (17.8) | 20 (45.5) | 38 (26.2) | ||
| G-CIMP | 2 (2.0) | 6 (13.6) | 8 (5.5) | < 1e-04 | |
| Tumor mutation burden | mean (sd) | 1.8 (0.7) | 1.9 (0.5) | 1.8 (0.7) | 0.28275 |
| Gender | Male | 79 (67.5) | 28 (58.3) | 107 (64.8) | |
| Female | 38 (32.5) | 20 (41.7) | 58 (35.2) | 0.34557 | |
| Age at diagnosis | mean (sd) | 60.2 (12.5) | 57.2 (15.6) | 59.3 (13.5) | 0.18799 |
| IDH mutation status | WT | 95 (95.0) | 36 (85.7) | 131 (92.3) | |
| Mutant | 5 (5.0) | 6 (14.3) | 11 (7.7) | 0.12230 | |
| MGMT promoter methylation | Unmethylated | 51 (64.6) | 14 (42.4) | 65 (58.0) | |
| Methylated | 28 (35.4) | 19 (57.6) | 47 (42.0) | 0.05073 | |
| Chromosomes 19/20 co-gain | No chr 19/20 gain | 89 (87.3) | 36 (83.7) | 125 (86.2) | |
| Gain chr 19/20 | 13 (12.7) | 7 (16.3) | 20 (13.8) | 0.76417 | |
| Chromosomes 7-gain and 10-loss | No combined CNA | 30 (29.4) | 20 (46.5) | 50 (34.5) | |
| Gain chr 7 & loss chr 10 | 72 (70.6) | 23 (53.5) | 95 (65.5) | 0.07388 | |
| TERT expression | Expressed | 83 (84.7) | 34 (82.9) | 117 (84.2) | |
| Not expressed | 15 (15.3) | 7 (17.1) | 22 (15.8) | 0.99561 | |
| Percent aneuploidy | mean (sd) | 0.3 (0.2) | 0.3 (0.2) | 0.3 (0.2) | 0.90007 |
| ESTIMATE stromal score | mean (sd) | 1,571.3 (688.2) | 867 (566.9) | 1,363.6 (728) | < 1e-04 |
| ESTIMATE immune score | mean (sd) | 2,345.4 (737.8) | 1,277.9 (699.9) | 2,030.5 (873.7) | < 1e-04 |
| ESTIMATE combined score | mean (sd) | 3,916.7 (1,336.5) | 2,144.8 (1,145.1) | 3,394.1 (1,514.3) | < 1e-04 |
G-CIMP: glioma CpG island methylator phenotype; IDH: isocitrate dehydrogenase; MGMT: O6-methylguanine-DNA methyltransferase; TERT: telomerase reverse transcriptase; CNA: copy number alteration; WT: wild-type; TCGA: The Cancer Genome Atlas.
Table 2. Clinic-biological characteristics of Grade IV patients from glioma cohort GSE4412 according to M2-macrophage score stratification.
| Variable | Level | low (n = 46) | high (n = 13) | Total (n = 59) | p-value |
| Gender | male | 19 (41.3) | 7 (53.8) | 26 (44.1) | |
| female | 27 (58.7) | 6 (46.2) | 33 (55.9) | 0.62561 | |
| Age at diagnosis | mean (sd) | 48.8 (17.6) | 47.4 (10.4) | 48.5 (16.2) | 0.77891 |
| Age categories | high | 20 (43.5) | 8 (61.5) | 28 (47.5) | |
| low | 26 (56.5) | 5 (38.5) | 31 (52.5) | 0.40264 | |
| Overall survival status | Dead | 33 (71.7) | 13 (100.0) | 46 (78.0) | |
| Alive | 13 (28.3) | 0 (0.0) | 13 (22.0) | 0.07316 | |
| Overall survival time days | mean (sd) | 413.9 (347) | 196 (145.6) | 365.9 (325.7) | 0.02788 |
| Survival clusters | SC2 | 37 (80.4) | 12 (92.3) | 49 (83.1) | |
| SC1 | 9 (19.6) | 1 (7.7) | 10 (16.9) | 0.55594 | |
| Sample expression hierarchy clusters | HC2B | 17 (37.0) | 8 (61.5) | 25 (42.4) | |
| HC2A | 14 (30.4) | 1 (7.7) | 15 (25.4) | ||
| HC1B | 9 (19.6) | 4 (30.8) | 13 (22.0) | ||
| HC1A | 6 (13.0) | 0 (0.0) | 6 (10.2) | 0.12279 |
GSE: Gene Expression Omnibus Series; SC: survival cluster; HC: hierarchical clustering subgroup.
Differential gene expression analysis between low and high M2 infiltration groups in the GSE4412 validation cohort confirmed major upregulation of ferroptosis-related genes in the high-infiltration group (Figure 3C). Iterative logistic regression with “logitloop” software was performed for testing ferroptosis actor expression (FerrdbV2) against M2-macrophage infiltration categories (low versus high): 80 ferroptosis-related genes were found associated with M2-infiltration (beta coefficients for best thirty ones, Figure S1B). Unsupervised clustering (Euclidean distance) of these 80 genes stratified M2 infiltration categories independently of gender and age (Figure 4A). PCA further confirmed these results (Figure 4B,C,D). In terms of M2-macrophage infiltration association, a clear concordance of regulation for the ferroptosis genes was found between the training and validation cohorts of glioblastoma transcriptome (Figure 4E).
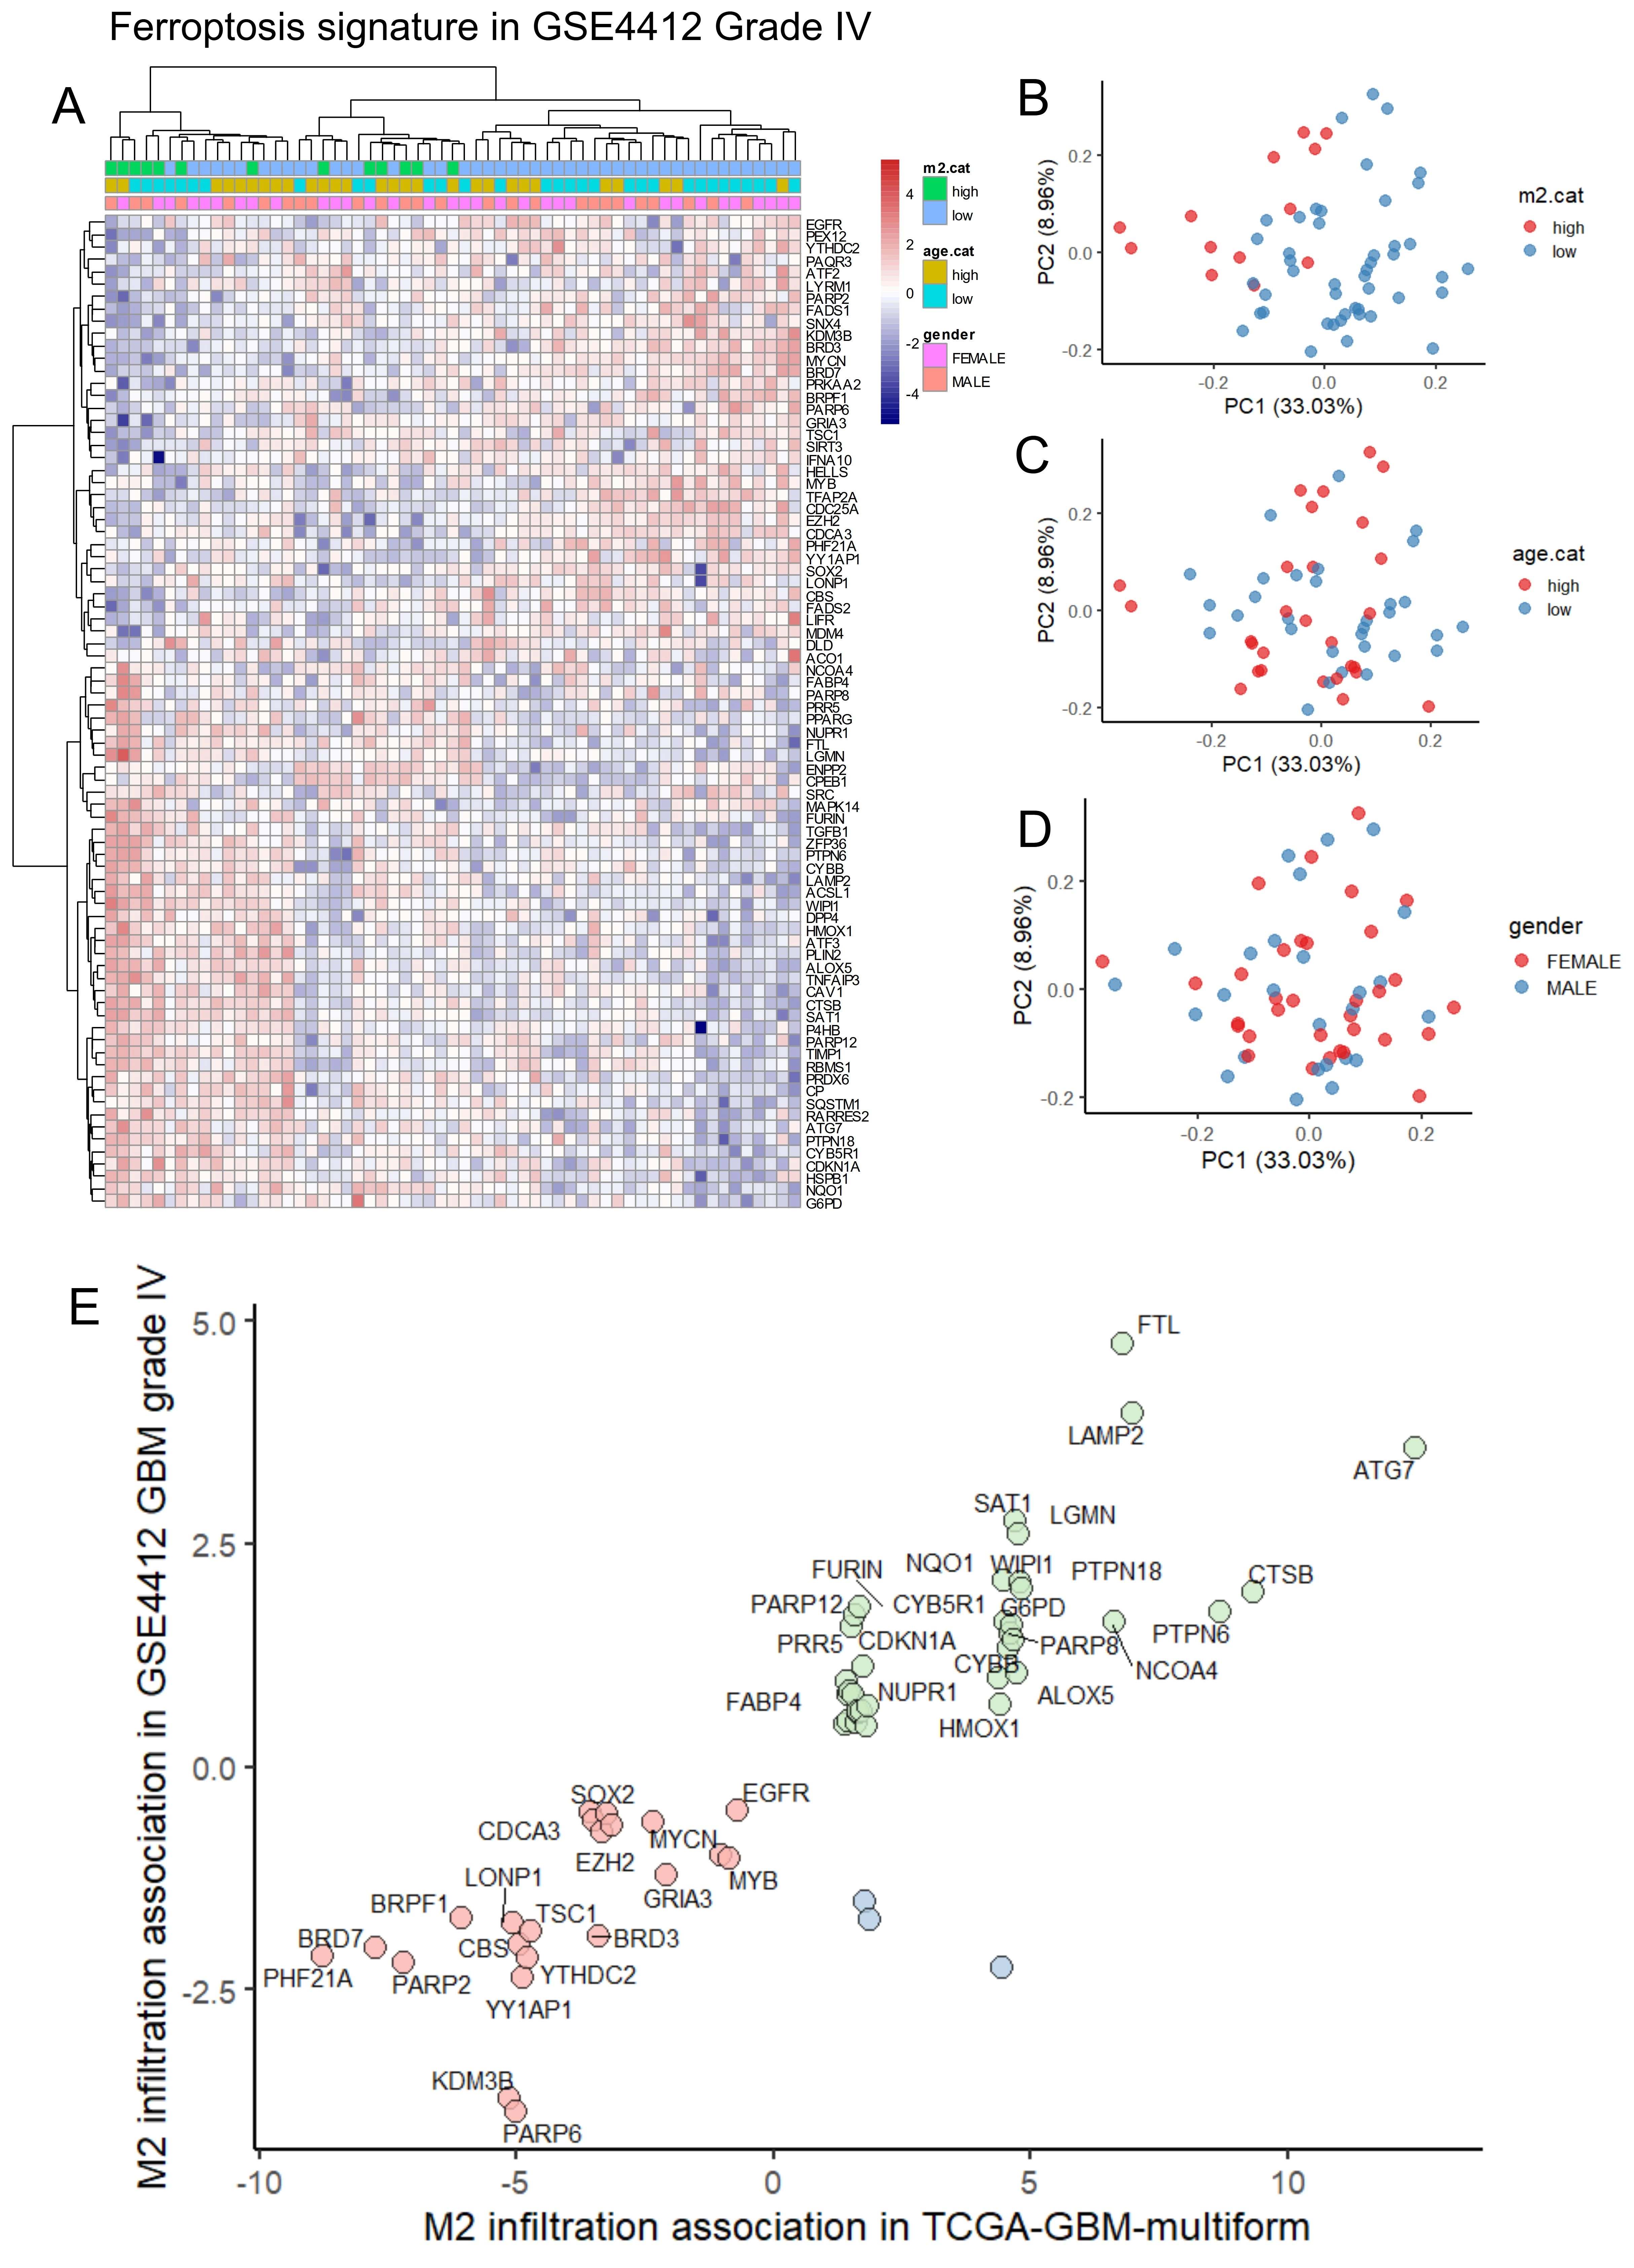
Figure 4. Concordance of ferroptosis regulation according to M2 macrophage infiltration between training and validation cohorts of glioblastoma. (A) Expression heatmap with unsupervised clustering (Euclidean distances) for ferroptosis transcriptional program in glioma stage IV from GSE4412 cohort; (B) PCA of ferroptosis transcriptional program stratified on M2 macrophage infiltration in the validation cohort GSE4412; (C) PCA of ferroptosis transcriptional program stratified on age categories (threshold 48 yo) in the validation cohort GSE4412; (D) PCA of ferroptosis transcriptional program stratified on gender of patients in the validation cohort GSE4412; (E) Scatterplot of common ferroptosis program between the training and validation cohorts according to M2 macrophage association scores. GBM: glioblastoma multiforme; PCA: principal component analysis.
3.2 High ferroptosis expression score in CD16+/CD163+ tumor-associated macrophage of glioblastoma tumors
To further confirm the association between ferroptosis and M2 macrophages, single-cell transcriptome data from glioblastoma tumors were analyzed using dataset GSE189650[18]. This dataset included human samples from both primary and recurrent glioblastomas. Single-cell transcriptomes from primary and recurrent tumors were integrated by canonical correlation analysis (Figure 5A). Nine distinct cell clusters were identified within the glioblastoma tumor microenvironment (Figure 5B), each defined by specific molecular markers (Figure S3A). Based on marker expression, these clusters were grouped into six major cell types: tumor cells with high Sex-determining region Y (SRY)-box 2 (SOX2) expression (clusters 0, 1, and 4), endothelial cells with high cadherin 5 (CDH5) expression (cluster 6), oligodendrocytes with high myelin basic protein (MBP) expression (cluster 3), excitatory neurons with high glutamate receptor–interacting protein1 (GRIP1) expression (cluster 7), inhibitory neurons with high gamma-aminobutyric acid type B receptor subunit 2 (GABBR2) expression (cluster 5), and CD16+/CD163+ M2 macrophages (cluster 2) (Figure S3B and Figure 5C). Genes highly expressed in the M2 macrophage cluster (cluster 2) were intersected with ferroptosis-related genes previously identified as positively associated with M2 infiltration in the bulk transcriptome cohorts (Figure 4E). Nine ferroptosis-related genes with area under the curve (AUC) > 0.5 for cluster 2 identification were selected to compute a ferroptosis expression score using the “AddModuleScore” function in Seurat[27] (Figure 5D). These nine ferroptosis-related genes: PARP8, FTL, HMOX1, PLIN2, ATG7, TNFAIP3, ALOX5, SAT1, and CTSB were confirmed to be highly expressed in the M2-macrophage cell cluster number 2 (Figure 5E). The ferroptosis score derived from these markers was significantly higher in cluster 2, as shown by UMAP projection (Figure 5F) and violin plot representation (Figure 5G). Focusing on the M2-TAM cluster 2, ferroptosis score was found to be higher in M2 macrophages from recurrent glioblastomas compared to those from primary tumors (Figure 6A). Individual ROC curve analyses predicting glioblastoma recurrence based on expression of the nine markers in M2 macrophages demonstrated that seven genes showed positive predictive value: SAT1 (AUC:0.82), TNFAIP3 (AUC:0.77), FTL (AUC:0.76), CTSB (AUC: 0.71), ALOX5 (AUC: 0.65), ATG7 (AUC: 0.61), and PARP8 (AUC: 0.55) (Figure 6B). Among ferroptosis suppressors, only FTL was found to be increased in recurrent glioblastomas. Conversely, several ferroptosis drivers, including SAT1, CTSB, ALOX5, TNFAIP3, and ATG7, were repressed in recurrent tumors (Figure 6C). Notably, TNFAIP3, a key ferroptosis driver, was completely downregulated in M2 macrophages from recurrent glioblastomas (Figure 6C).
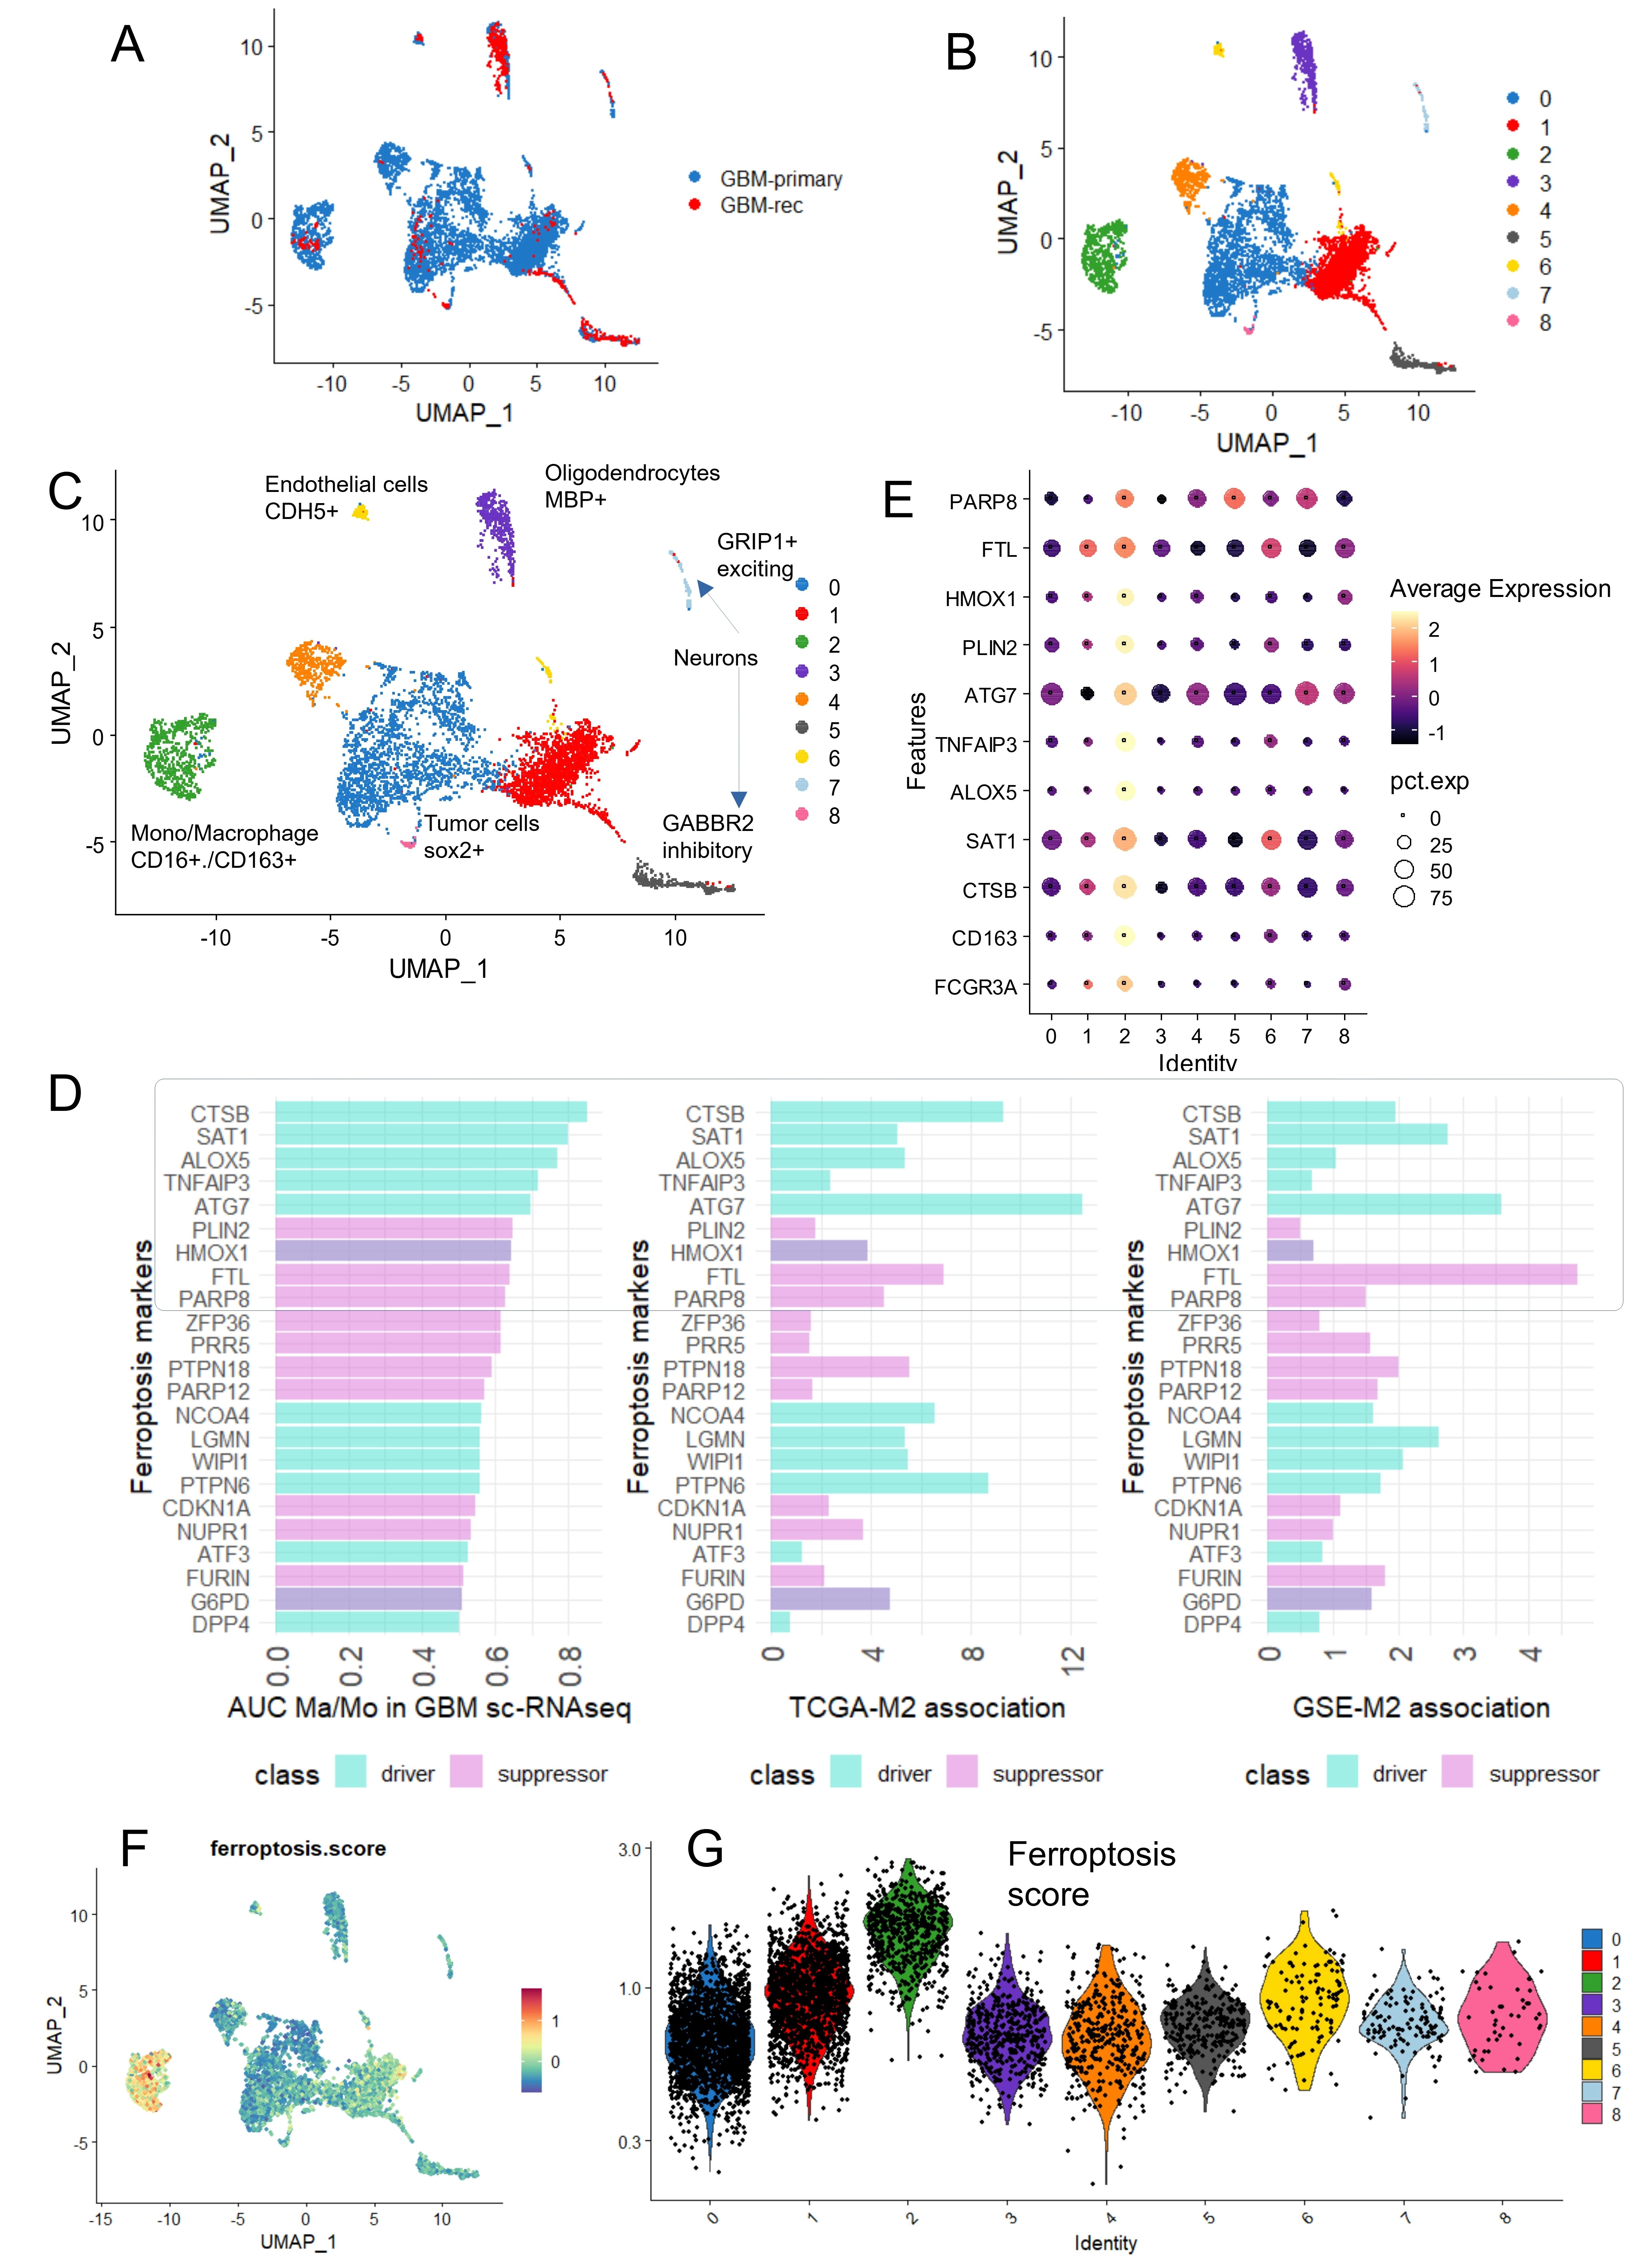
Figure 5. High level of ferroptosis score in monocytes/macrophages infiltrating glioblastoma tumors. (A) UMAP single cell transcriptome dimension reduction for human glioblastoma tumors stratified on tumor samples; (B) UMAP dimension reduction for human glioblastoma tumors stratified on cell clusters; (C) UMAP dimension reduction for human glioblastoma tumors stratified on cell type identification; (D) Bar plot of best ferroptosis markers identified expressed at single cell level in monocyte/macrophage cell cluster number 2, AUC; (E) Expression dot plot or monocyte/macrophage and ferroptosis markers according to cell cluster identification in glioblastoma tumors; (F) UMAP dimension reduction with single cell-ferroptosis score quantification; (G) Violin plot of ferroptosis score quantification stratified on cell cluster identification. UMAP: uniform manifold approximation and projection; GBM: glioblastoma multiforme; AUC: area under curve.
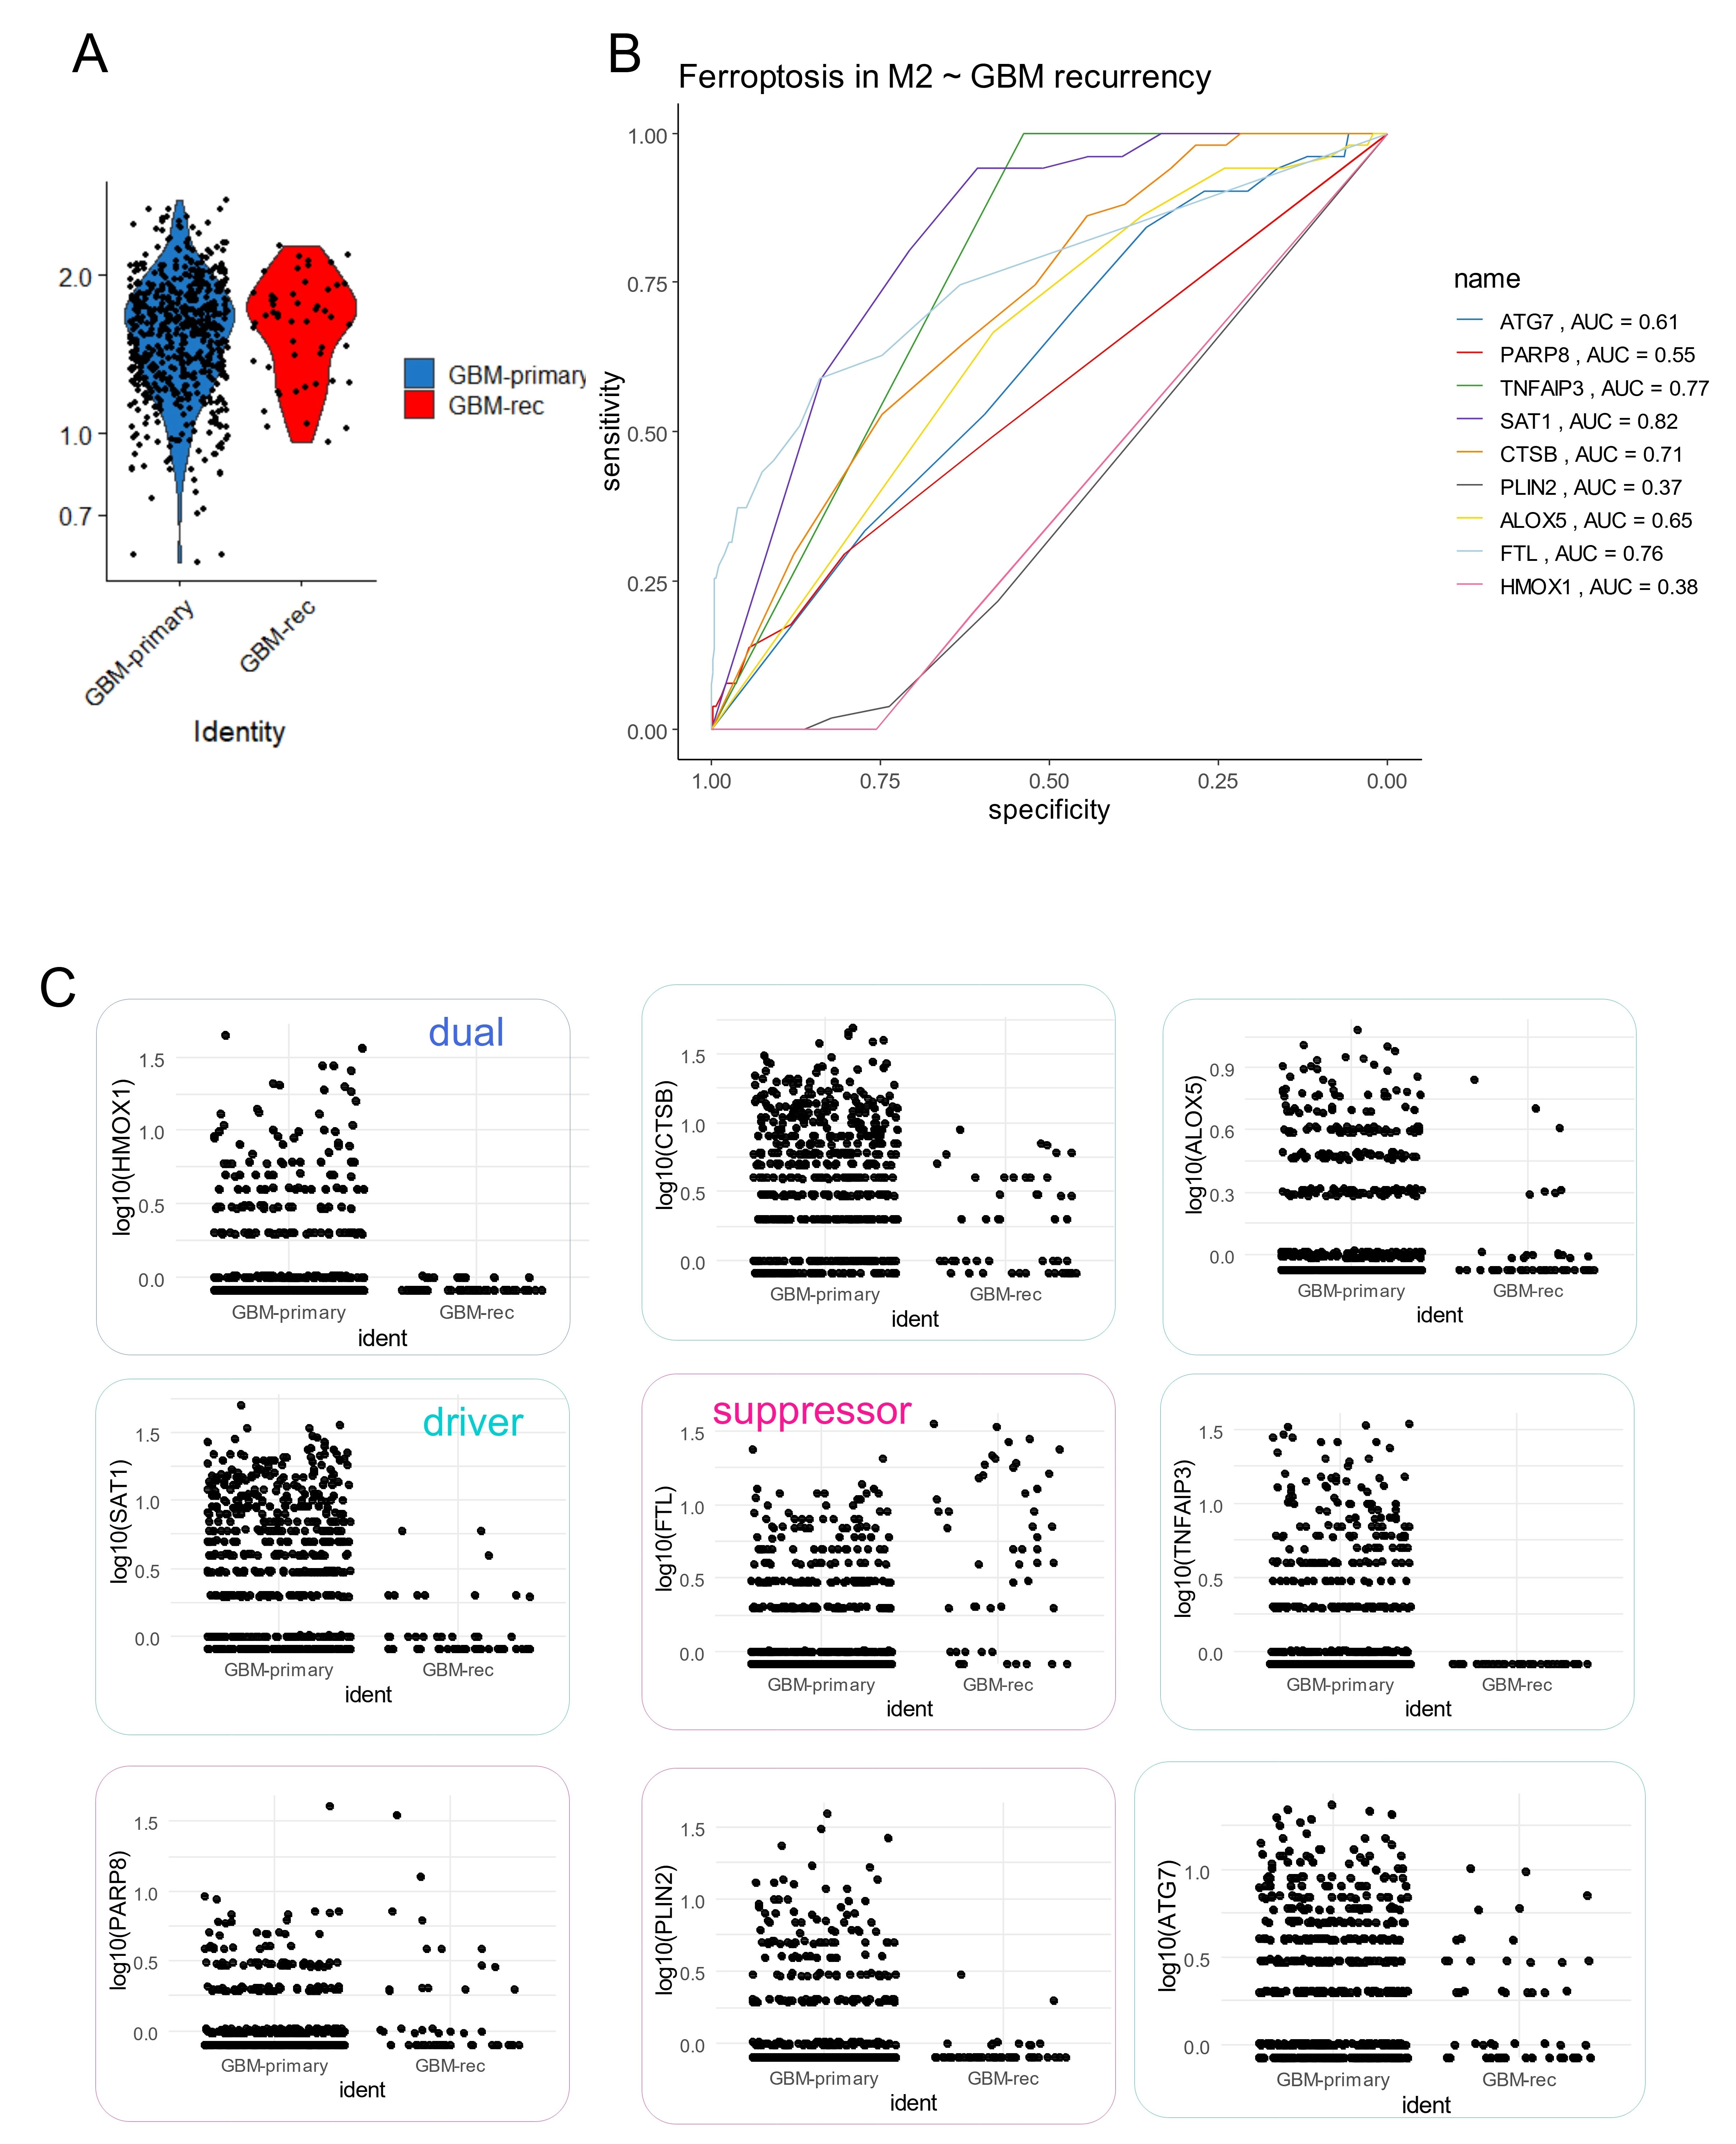
Figure 6. Single cell expression ferroptosis score in M2-macrophages from glioblastoma. (A) Violin plot of ferroptosis score computed in M2-macrophage cell cluster 2 according time of tumor sampling: primary versus recurrent; (B) ROC curve analysis according Recurrency status of glioblastoma for expression of ferroptosis markers in included in ferroptosis score of M2-macrophages; (C) Single cell expression of the nine ferroptosis markers included in ferroptosis score for glioblastoma M2-macrophage according time of tumor sampling: primary versus recurrent. ROC: receiver operating characteristic; AUC: area under curve; GBM: glioblastoma multiforme.
3.3 Ferroptosis score is an independent marker of M2-macrophage infiltration in glioblastoma tumors
Iterative logistic regression against M2 macrophage infiltration was performed in the TCGA-GBM transcriptome for the nine ferroptosis-related markers used to compute the ferroptosis score: PARP8, FTL, HMOX1, PLIN2, ATG7, TNFAIP3, ALOX5, SAT1 and CTSB. All nine markers harbored positive beta coefficients to estimate a high score of M2-macrophage infiltration in the TCGA-GBM cohort (Figure 7A). Based on expression level and beta coefficient of these nine markers, a ferroptosis score was computed for tumor samples. At univariate level, a significant higher ferroptosis score (2-sided t-test p-value < 2.2E-16) was found in samples with high M2-macrophage infiltration, represented with less proportion of patients with IDH mutations (Figure 7B) and with less proportion of patients with methylated MGMT-promoter (Figure 7C). In this cohort, age at diagnosis could be stratified on disease free survival with an optimal threshold at 43 years old (Figure S4A), and older patients harbored significantly shorter disease-free survival (log rank test p-value = 0.0096, Figure S4B). The optimal cutpoint of the ferroptosis score for predicting M2-macrophage infiltration was determined by receiver operating characteristic (ROC)-curve analysis (Figure 7D), allowing the cohort to be divided into two categories based on ferroptosis score. In a multivariable logistic model predicting M2-macrophage infiltration, ferroptosis score categories (score.cat) were included alongside significant clinic-biological parameters (Table 1) such as glioblastoma subtypes, MGMT-promoter methylation, genomic instability on chromosomes 7 and 10, as well as demographic parameters including: age at diagnosis and gender (Figure 7E). In this multivariable model, ferroptosis score emerged as an independent and highly significant predictor of M2 infiltration (odds ratio: 32 (8-183), p-value = 8.1E-6, Table 3 and Figure 7E). Notably, this parameter (score.cat) contributed to a large scale of points in the nomogram of the clinic-biological multivariable model (Figure 7F).
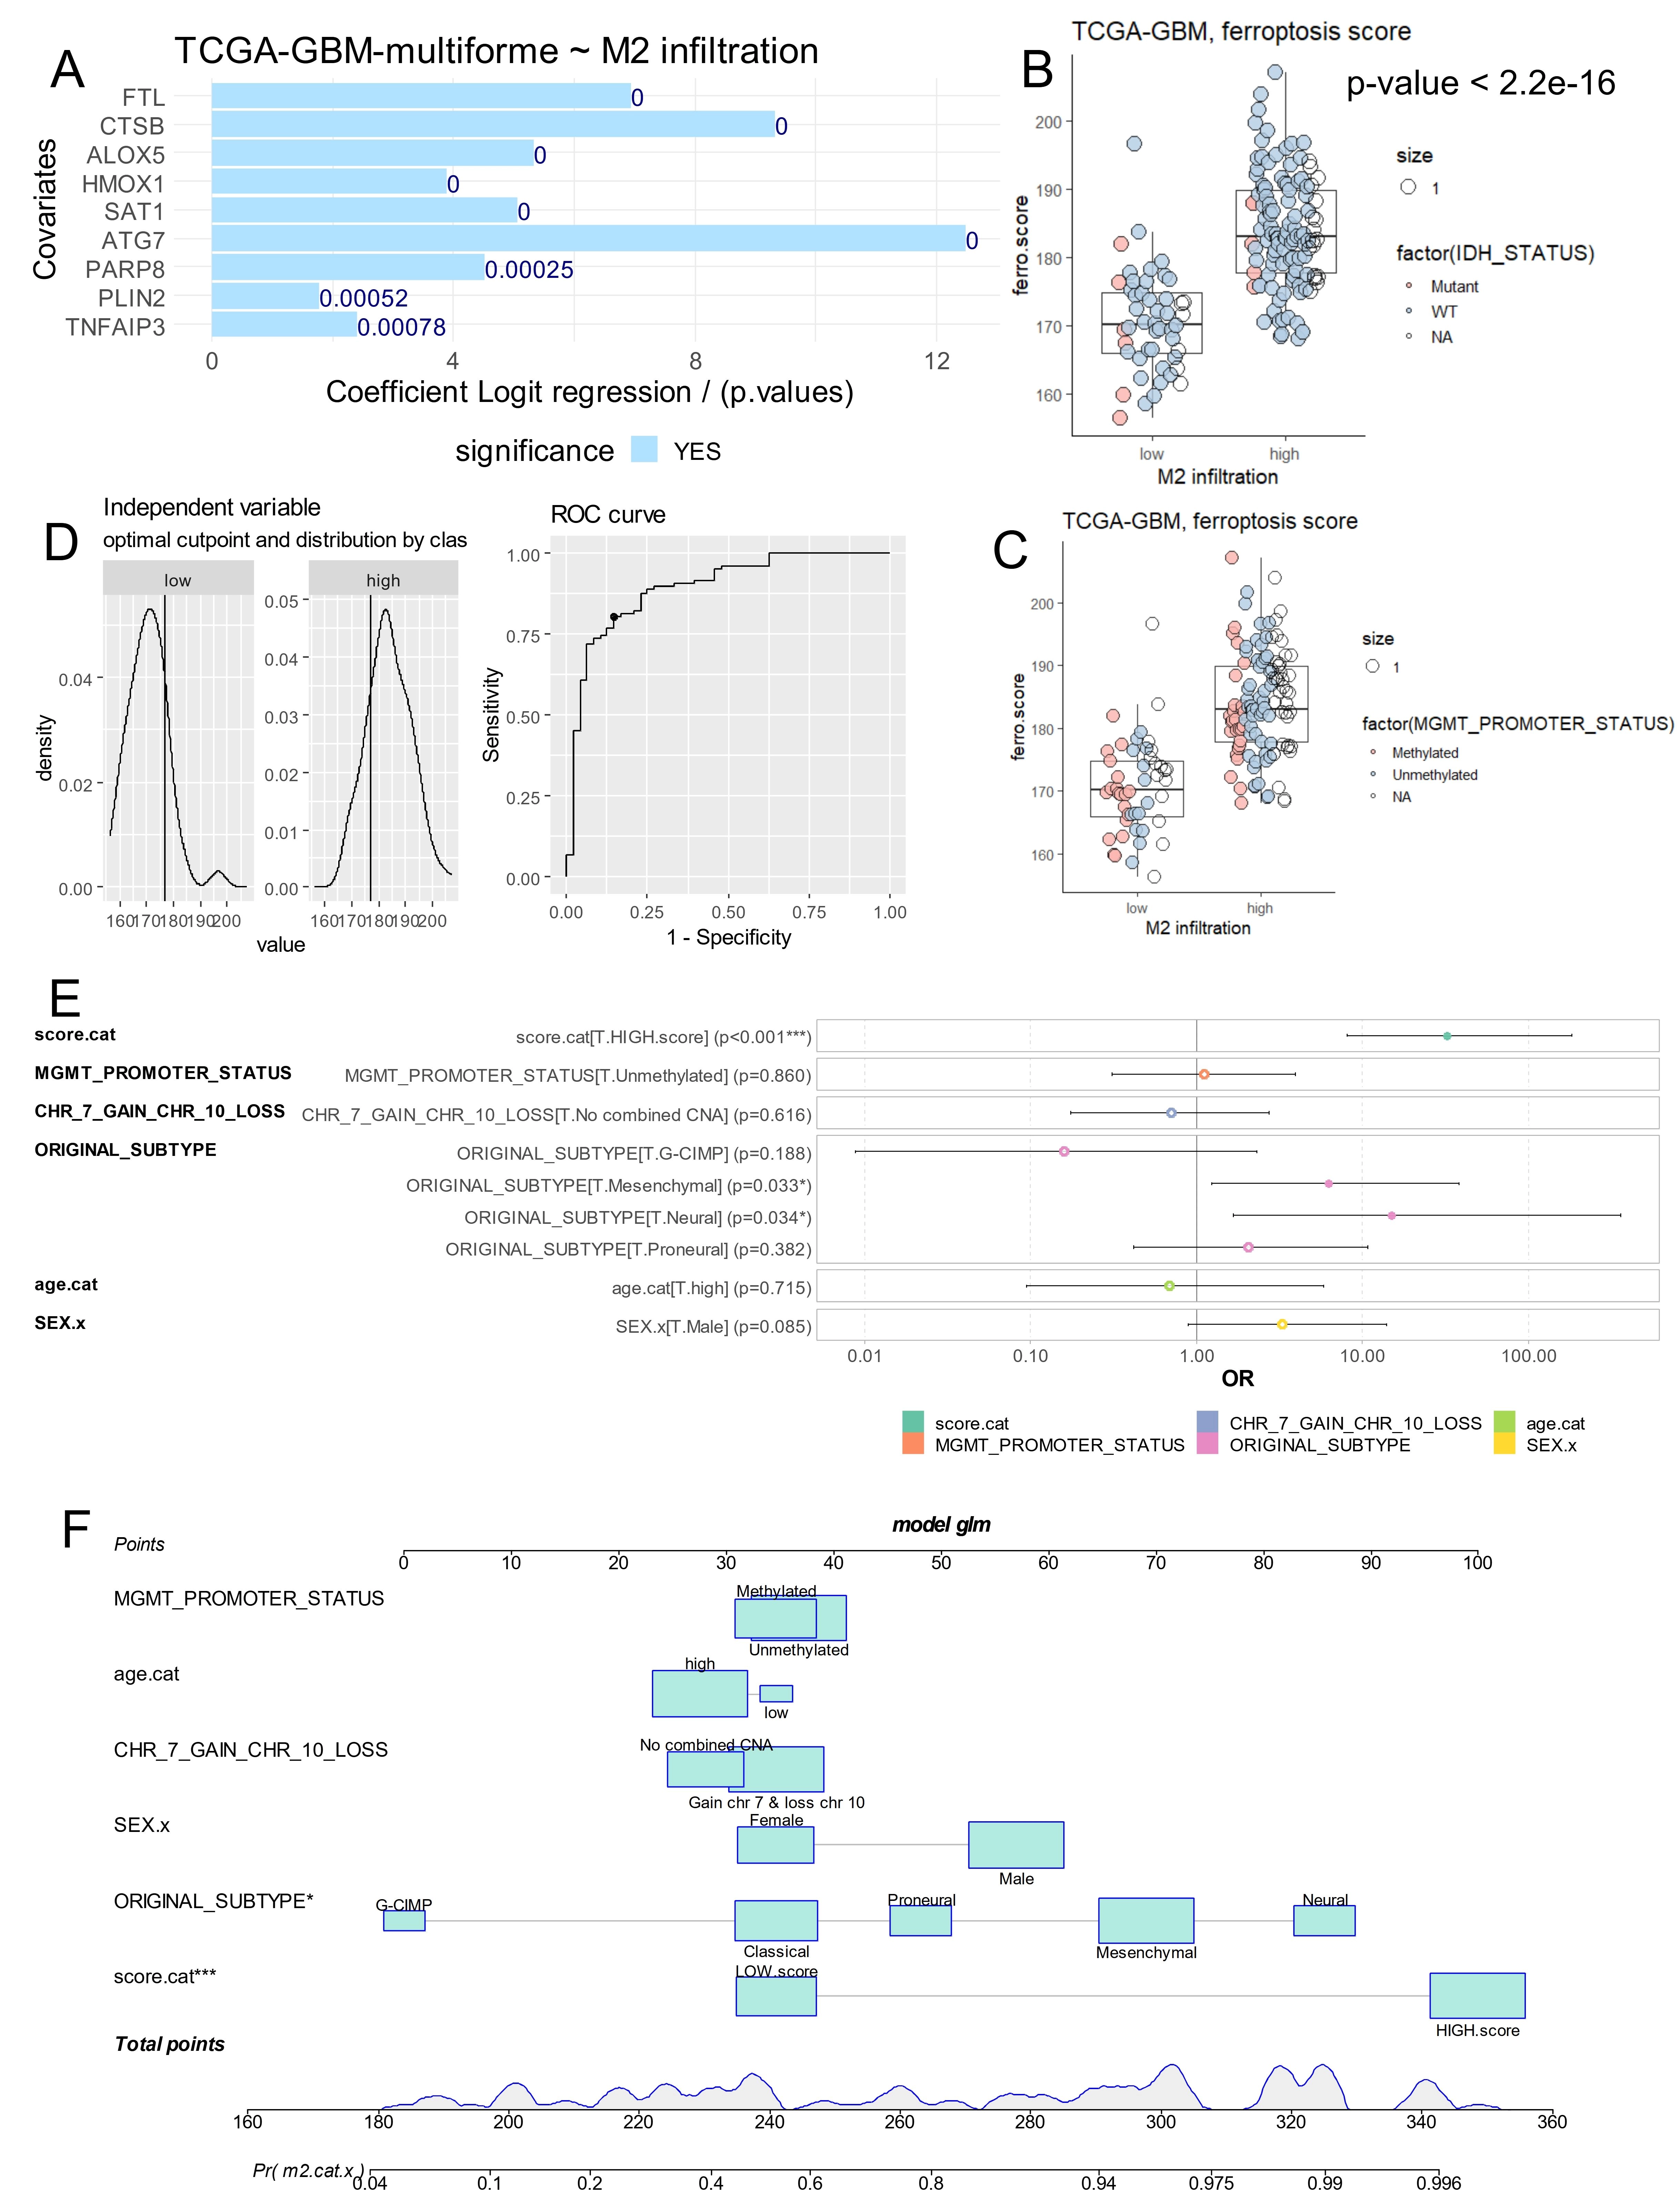
Figure 7. Ferroptosis score is an independent parameter to predict M2 macrophage infiltration in glioblastoma tumors. (A) Iterative univariate logistic regression with M2 macrophage infiltration as outcome for expression of ferroptosis markers; (B) Ferroptosis score according M2 macrophage infiltration and IDH mutation status; (C) Ferroptosis score according M2 macrophage infiltration and MGMT promoter methylation status; (D) Optimal threshold determination for ferroptosis score according to M2 macrophage stratification; (E) Forest plot of multivariable model for M2 macrophage infiltration prediction with incorporation of ferroptosis score (score.cat) and epidemiological (age and gender) and biological parameters (MGMT promoter status, glioma subtypes, chromosome instability: 7 and 10); (F) Nomogram of the multivariable model to predict M2 macrophage infiltration. IDH: isocitrate dehydrogenase; MGMT: O6-methylguanine-DNA methyltransferase.
Table 3. Multivariable logistic model predicting M2 macrophage infiltration in glioblastoma tumors from TCGA-GBM-multiforme cohort.
| Covariates | Odds ratios | CI95* (low) | CI95* (high) | p-value |
| Ferroptosis score [**REF.HIGH.score] | 32.099 | 8.114 | 183.024 | 8.10E-06 |
| MGMT promoter methylation [REF.Unmethylated] | 1.120 | 0.311 | 3.947 | 8.60E-01 |
| Chromosomes 7(gain) & 10(loss) [**REF.No combined CNA] | 0.707 | 0.174 | 2.744 | 6.16E-01 |
| Subtype [**REF.G-CIMP] | 0.159 | 0.009 | 2.327 | 1.88E-01 |
| Subtype [**REF.Mesenchymal] | 6.224 | 1.242 | 38.086 | 3.26E-02 |
| Subtype [**REF.Neural] | 15.035 | 1.670 | 363.075 | 3.40E-02 |
| Subtype [**REF.Proneural] | 2.046 | 0.418 | 10.765 | 3.82E-01 |
| Age categories [**REF.high] | 0.688 | 0.094 | 5.831 | 7.15E-01 |
| Gender [**REF.Male] | 3.274 | 0.893 | 13.976 | 8.53E-02 |
TCGA: The Cancer Genome Atlas; GBM: glioblastoma multiforme; *CI95: confident interval at 95 percent; **REF: groups of reference; MGMT: O6-methylguanine-DNA methyltransferase.
3.4 Inverse regulation of TNFAIP3 and FTL in M2-macrophage explains recurrent status of glioblastoma tumor
Single cell transcriptome of M2-macrophage (cluster 2) from glioblastoma tumors (GSE dataset) (Figure 8A) were used to build a deep learning neural network based on expression of the nine ferroptosis markers previously used for ferroptosis score computation (Figure 8B). Training of this neural network evaluated an optimal accuracy of 0.96 and an optimal Cohen Kappa coefficient of 0.68 to predict glioblastoma recurrence status from tumor-associated M2-macrophages (Figure 8C). Importance of Garson features in this model identified that TNFAIP3 has the best score for this prediction (Figure 8D), followed by ALOX5, PLIN2, SAT1 and FTL. Black box opening of this deep learning model highlights the major role of TNFAIP3 expression in cell-to-cell decisions at expression threshold ≤ 2. FTL expression at threshold ≤ 1 also showed an opposite major effect in cell-to-cell decision in this neural network model (Figure 8E). Notably, single cell expression ridgeplot confirmed a total repression of TNFAIP3 (a ferroptosis driver) associated with a major up-regulation of FTL (a ferroptosis suppressor) in M2-macrophage from recurrent glioblastomas compared to primary tumors (Figure 8F). In M2-macrophage single cell transcriptome from glioblastoma (Figure 9A), cell stratification was performed, based on alternative expression of TNFAIP3 and FTL (Figure 9B). Cells with high FTL and low TNFAIP3 expression (green cells) were strongly associated with recurrent tumor status (Figure 9C). A pseudotime cell trajectory was computed based on FTL/TNFAIP3 expression hierarchy in the M2 cells (Figure 9D) and this cell trajectory further stratified M2-macrophage according to the recurrent status of the tumor (Figure 9E). Genes significantly regulated along the cell trajectory were determined and the top 75 (Table S1) were used to build a pseudotime expression heatmap, which identified three clusters of genes (Figure 9F). Two of these clusters were large (green and pink) and the last one was small (blue) (Figure 9F). The largest gene cluster (green cluster, Figure 9F) associated an expression wave of TNFAIP3 with other markers such as TLR2, REL, IL1B, NFKBIA, ACSL1 in cell sub-population from primary glioblastomas (Figure S5A,B). Functional enrichment performed on genes associated with TNFAIP3 in M2-macrophages from primary glioblastomas allowed to identify their implication in innate immune responses such as: responses to lipopolysaccharides, molecule of bacterial origin, leukocyte migration and cytokine signaling (Figure 9G and Figure S5C). In contrast, the FTL expression wave fit in the second large gene cluster (pink cluster, Figure 9F) together with markers such as apolipoprotein’s members, apolipoprotein C1 (ApoC1), apolipoprotein E (APO-E), DHFR, and TXNIP, specifically enriched in M2 macrophages from recurrent glioblastomas from recurrent glioblastoma origin (Figure S6A,B). Literature-based text mining enrichment of FTL-associated genes in recurrent glioblastomas revealed an invasive signature, primarily implicating APO-E and SERPINE1, followed by TXNIP, GPNMB, CST3, DHFR, B2M, and NUPR1 (Figure 9H).
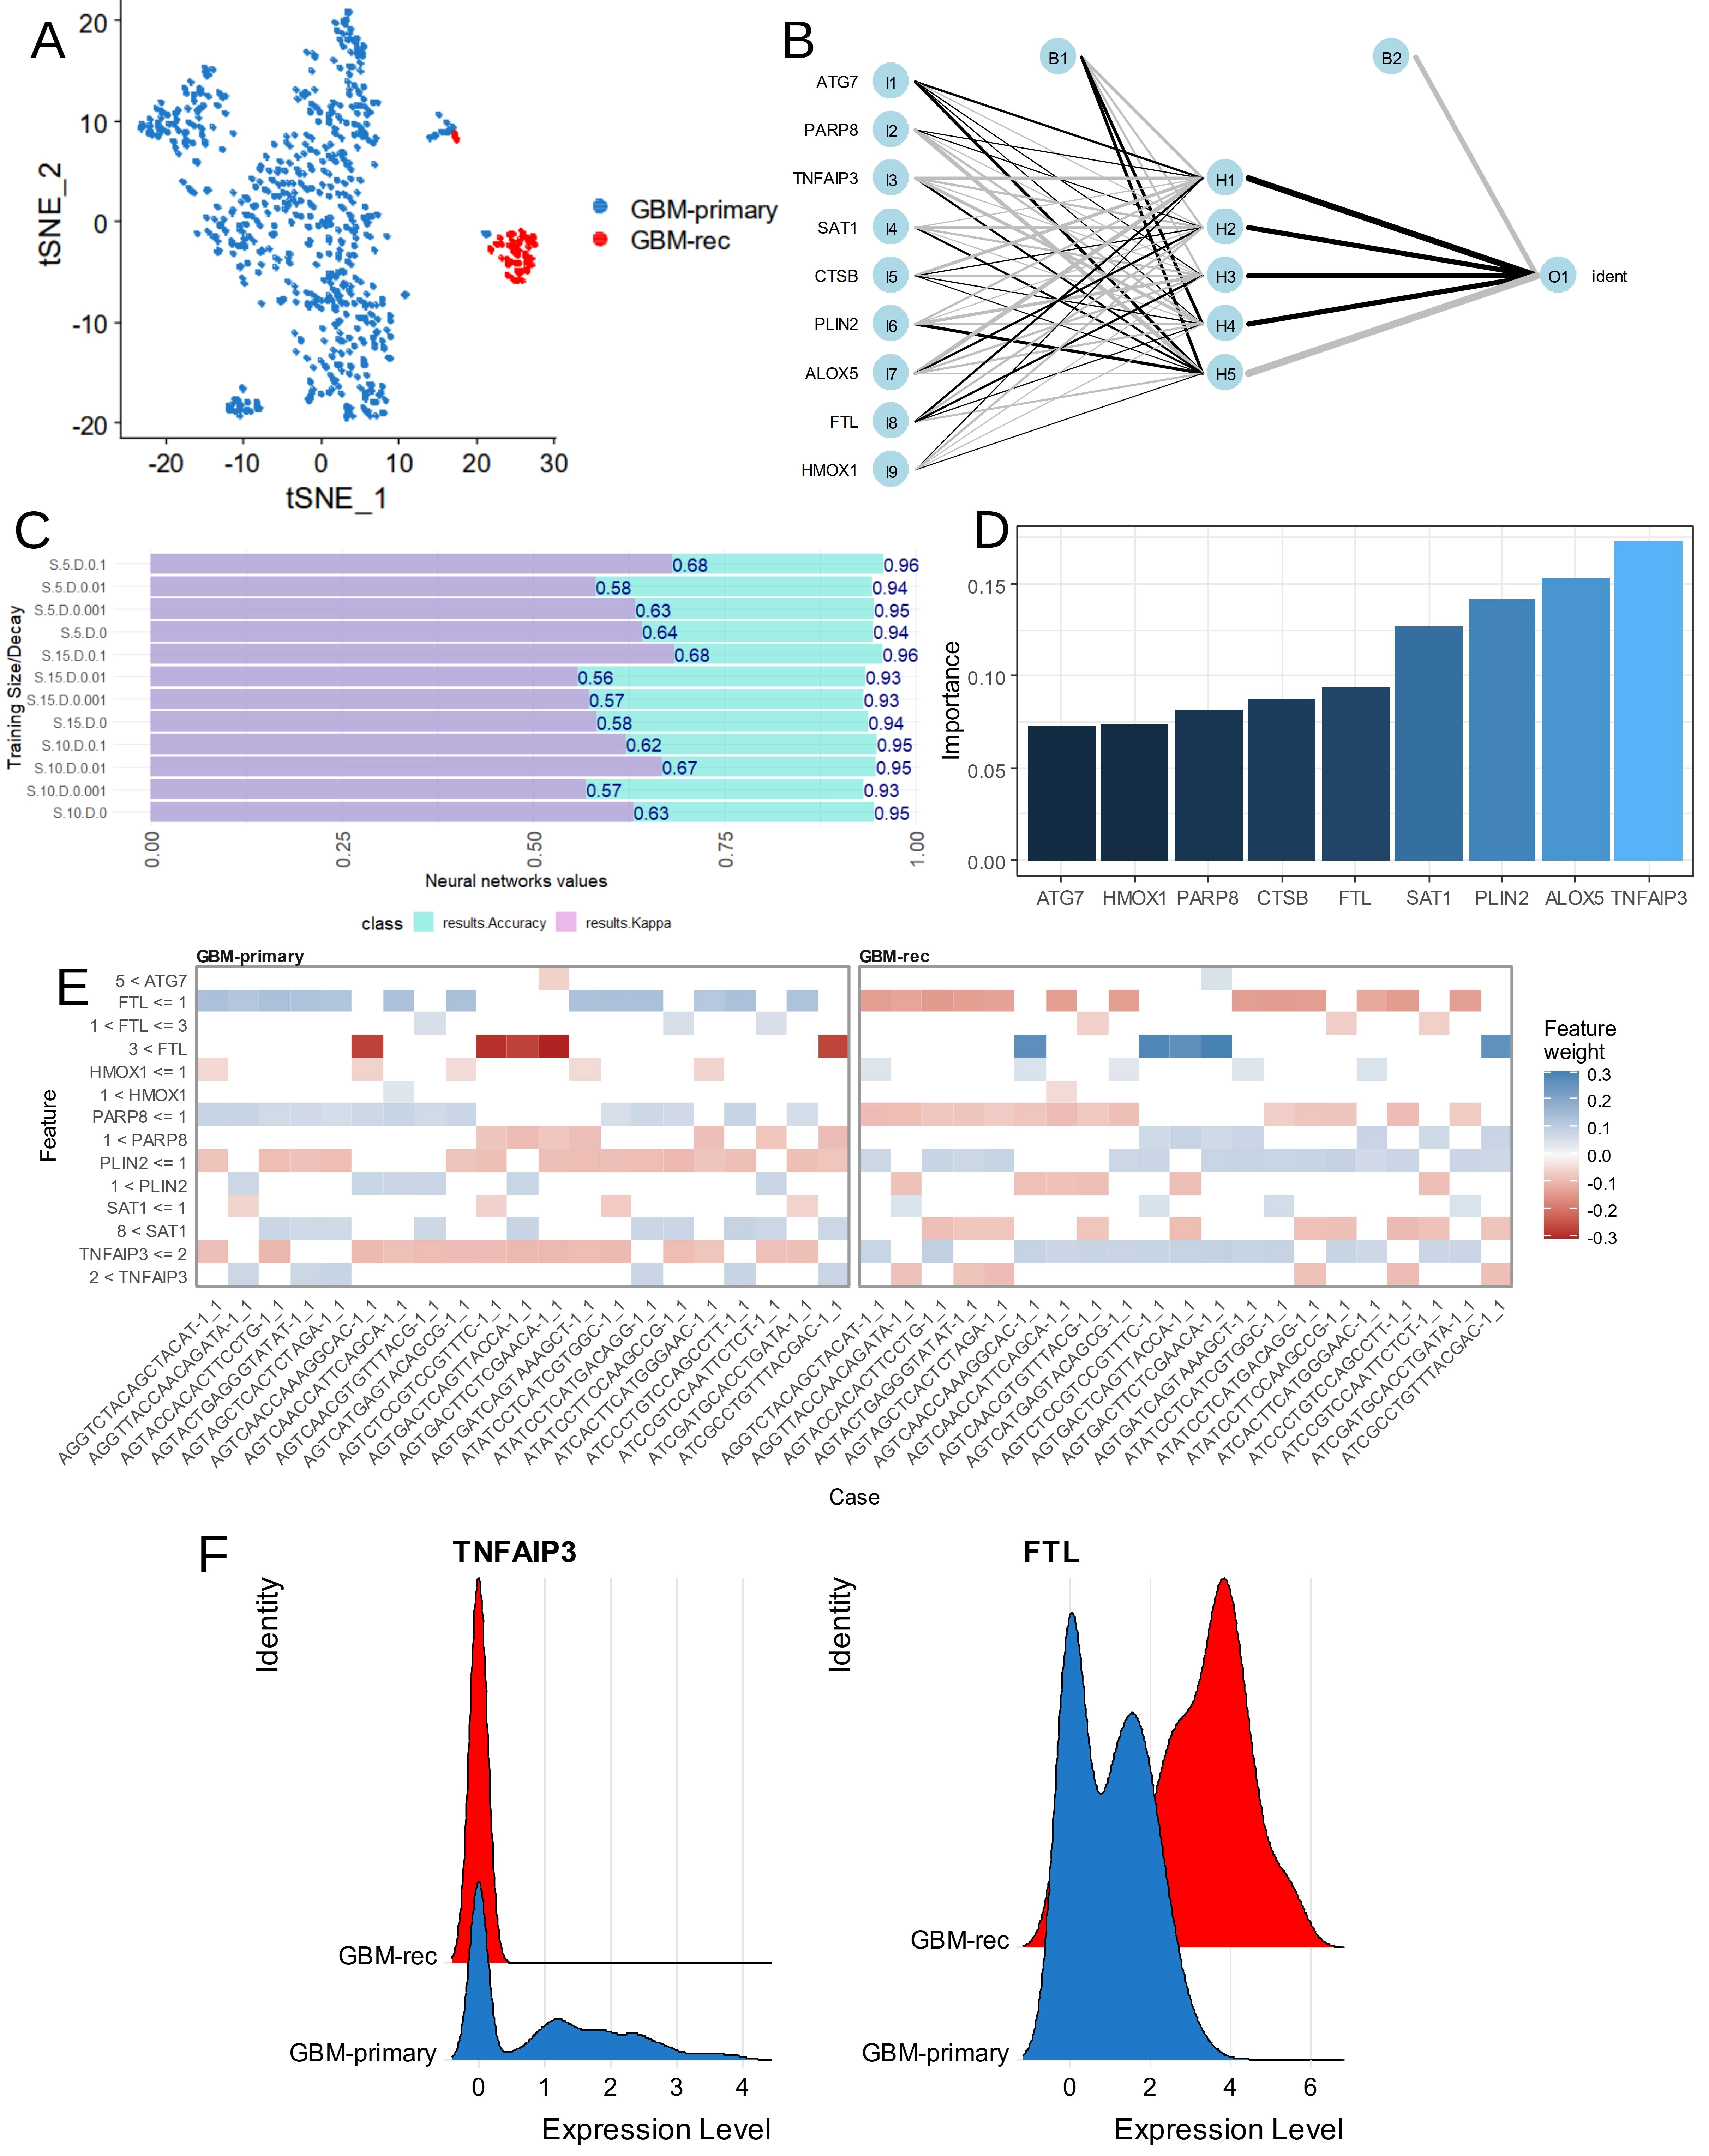
Figure 8. Inverse regulation of TNFAIP3 and FTL in monocyte/macrophage of glioblastoma. (A) TSNE dimension reduction performed on monocyte/macrophage cluster 2 of glioblastoma tumors according sampling time; (B) Neural network performed on single cell expression of ferroptosis markers to predict glioblastoma recurrence; (C) Bar plots of accuracy and Cohen kappa coefficient during optimization of neural network; (D) Importance of ferroptosis markers in the neural network to predict glioblastoma recurrence in the monocyte/macrophage cells; (E) Neural network black box opening with feature weights in individual cells; (F) Violin plot of single cell expression for TNFAIP3 and FTL monocyte/macrophage cell cluster of glioblastoma tumors according to time of sampling.
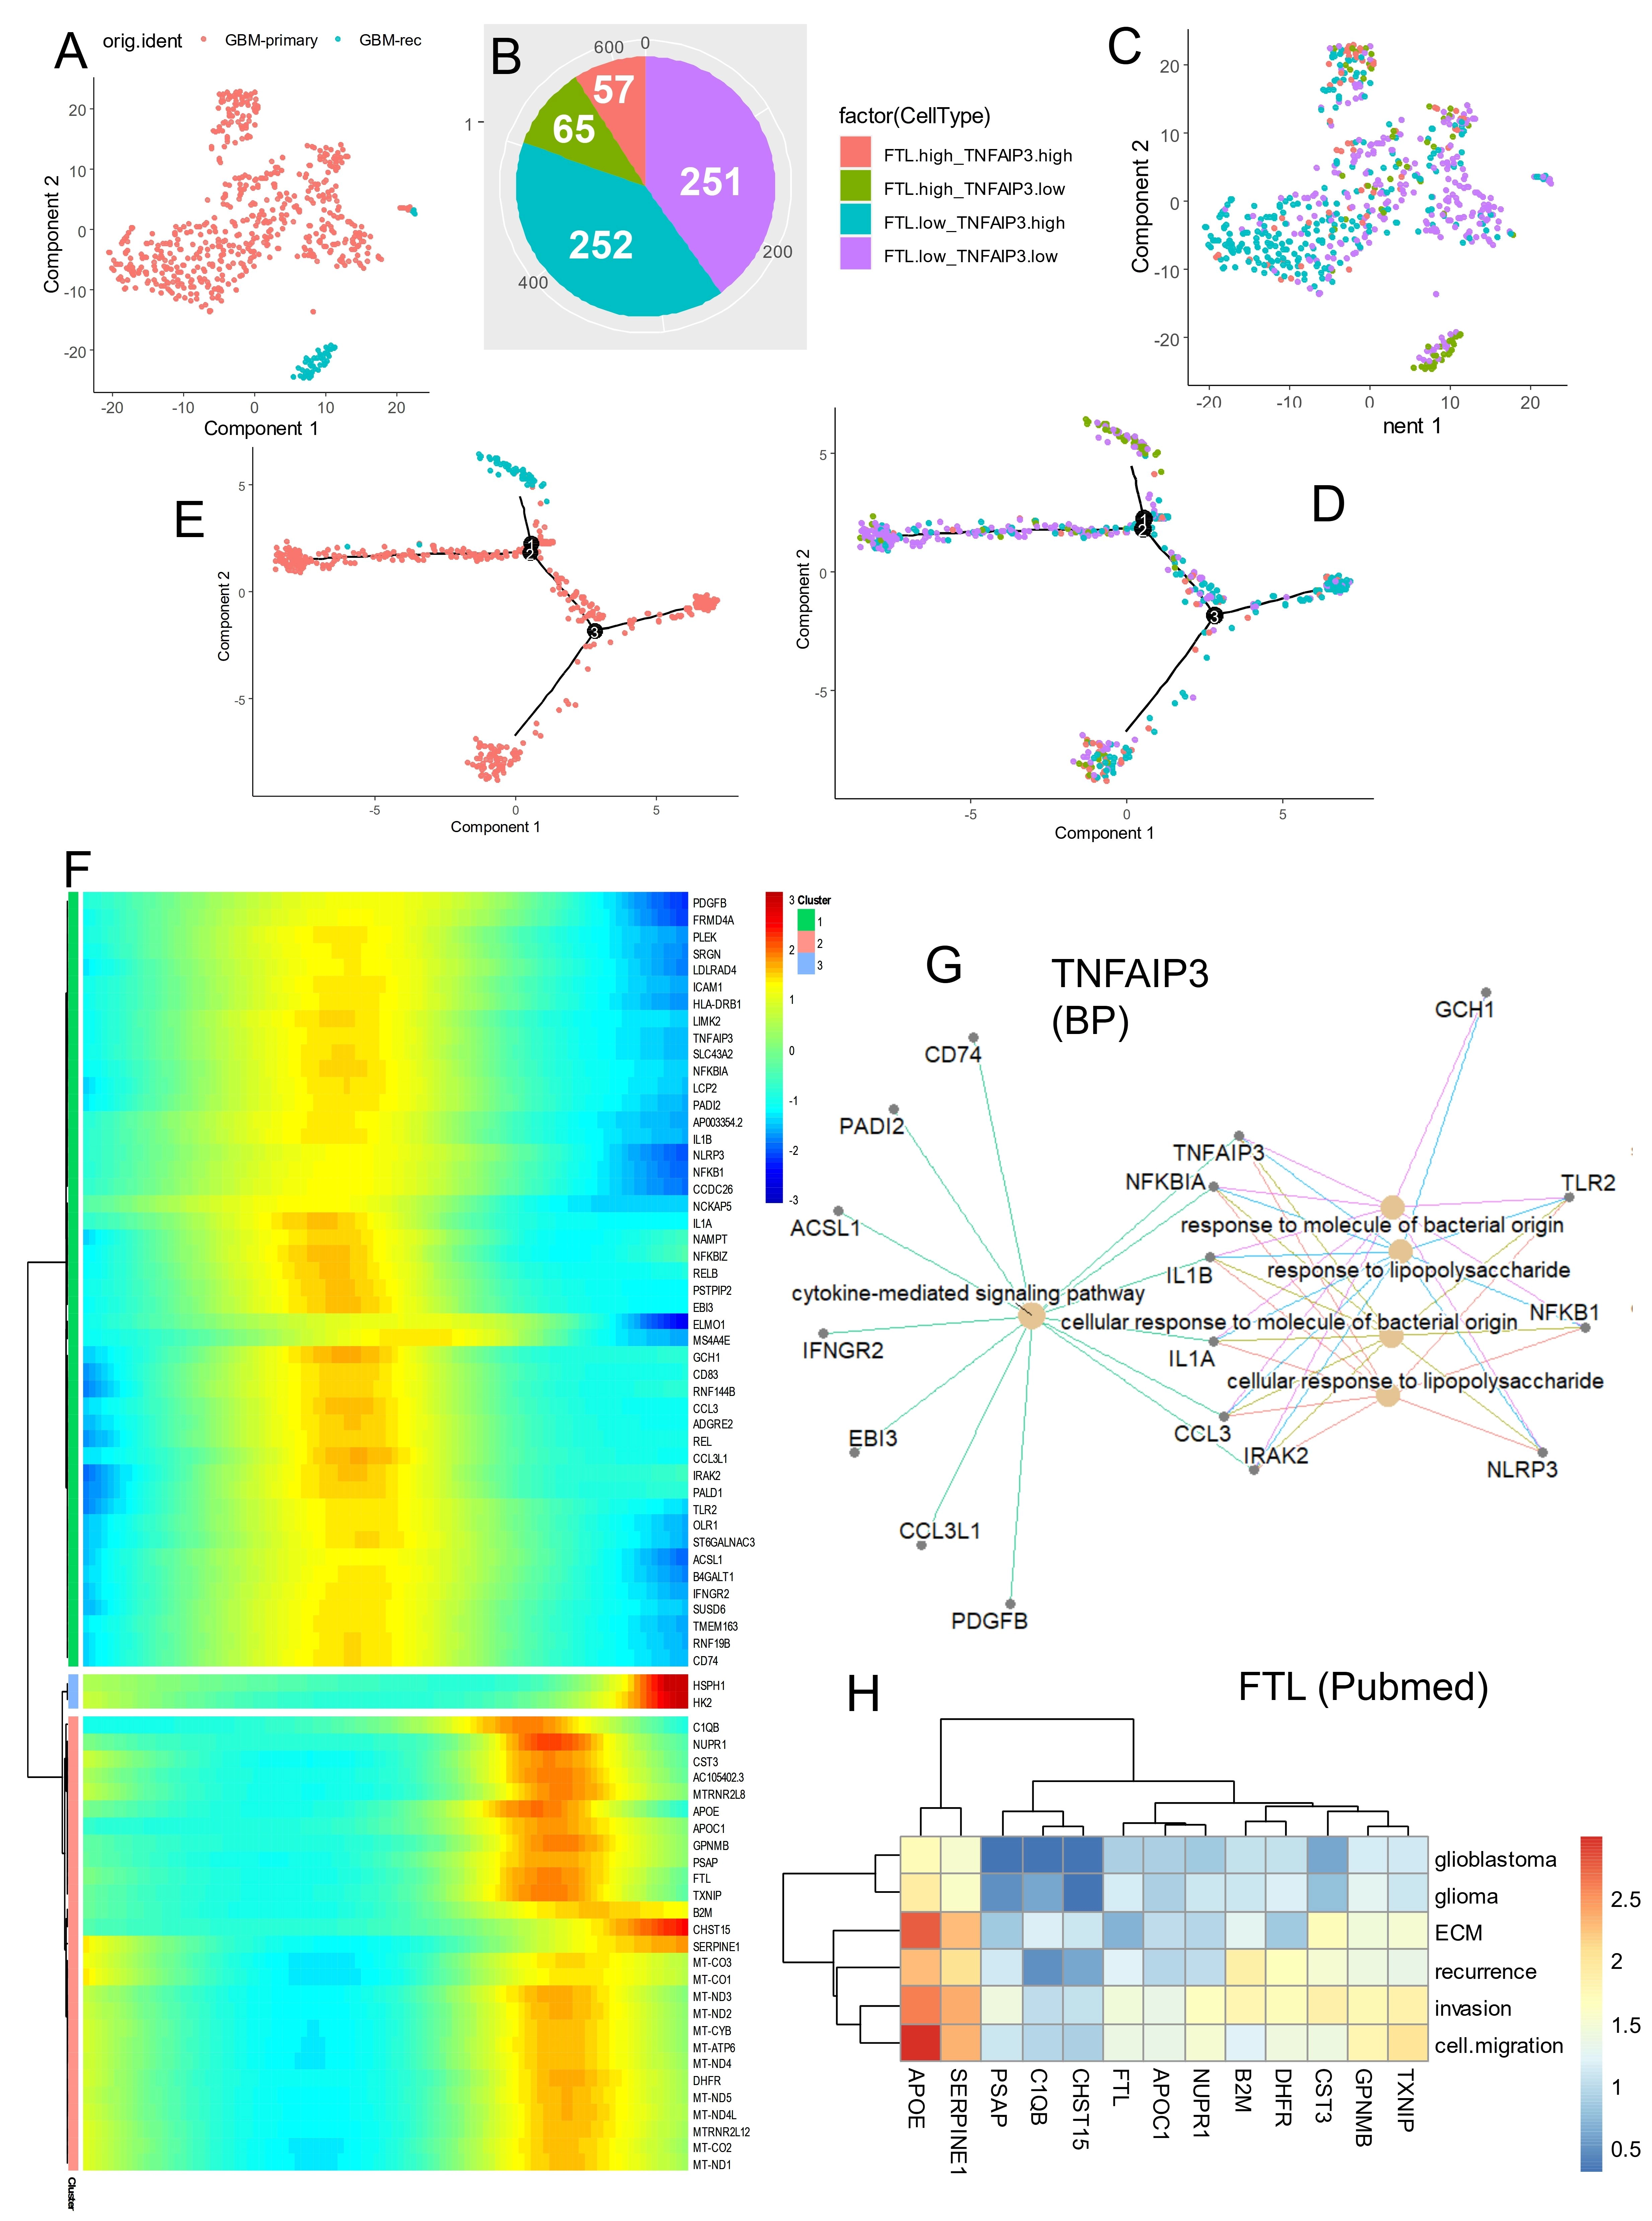
Figure 9. Cell trajectory prediction in recurrent glioblastoma M2 macrophages based on alternative expression of TNFAIP3 and FTL. (A) TSNE dimension reduction performed on monocyte/macrophage cluster 2 of glioblastoma tumors according to sampling time; (B) Pie chart of cell repartition according to expression of FTL and TNFAIP3; (C) TSNE dimension reduction of M2-macrophages according to the four groups stratified on expression of FTL and TNFAIP3; (D) M2-macrophage cell trajectory stratified on the four groups based on expression of FTL and TNFAIP3; (E) M2-macrophage cell trajectory stratified on sampling time of glioblastoma tumors; (F) Pseudotime expression heatmap built on FTL/TNFAIP3 M2-macrophage cell trajectory; (G) Functional enrichment network performed on GO BP database with genes associated with TNFAIP3 expression in glioblastoma M2-macrophages; (H) PubMed literature text-mining enrichment according to gene signature following FTL expression in glioblastoma M2-macrophages. TNFAIP3: tumor necrosis factor alpha-induced protein 3; FTL: ferritin light chain; GO: gene ontology; BP: biological process.
4. Discussion
Glioblastoma is the most prevalent malignant tumor of the central nervous system, accounting for 54 percent of the adult malignant cases. Glioblastoma tumor cells exhibit strong anti-apoptotic capacity and an immunosuppressive immune microenvironment, often described as an “immune desert” tumor, which contributes to poor responses to immunotherapy. In the present work, transcriptomic analyses confirmed that M2 macrophage infiltration in tumor is significantly associated with patient survival, and that the ferroptosis transcriptional program is regulated according to the degree of M2 macrophage infiltration. This observation is in agreement with the recent work of Xu et al., which clarified the impact of ferroptosis-related risk genes on M1/M2 macrophage polarization and glioblastoma patient prognosis[36].
Ferroptotic tumor cells are known to activate macrophage functions and recruitment[37]. During ferroptosis, cells release damage-associated molecular patterns, such as high mobility group box 1 protein (HMGB1), which can mediate inflammatory responses in macrophages[38,39]. Several common features link ferroptosis and macrophage states. Inflammatory factors such as IL-6, IL-1β and TNF-α, predominantly secreted by M1 macrophages, influence enzymatic activity in iron, lipid, and amino acid metabolism. ROS produced by macrophages affect both tissue cells and macrophages themselves by activating pathways related to iron, lipid, and amino acid metabolism. Iron overload associated with M1 polarization, together with GPX4 inactivation, contributes to ferroptotic cell death. In addition, the study by Kapralov et al. elegantly demonstrated that differential redox lipid reprogramming renders M2 macrophages more sensitive to ferroptosis than M1 macrophages, which is indeed a key mechanistic insight relevant to macrophage ferroptosis states. However, the work by Kapralov et al. was not performed in the context of glioblastoma or within a tumor microenvironment. Their conclusions were based on in vitro macrophage models and in vivo experiments conducted in non-tumoral settings, including systemic inflammatory and neuroinflammatory models. Therefore, while their study provides a valuable mechanistic framework, its findings cannot be directly extrapolated to GBM-associated macrophages, which are exposed to a profoundly different metabolic and immunosuppressive environment[13].
In glioblastoma, we demonstrated a clinically relevant connection between ferroptosis and M2 macrophage polarization. In macrophages, iron metabolism is tightly integrated with macrophage phenotype and mitochondrial function. For example, knockdown of the actin-regulatory protein glia maturation factor-γ alters the expression of iron metabolism proteins, increases intracellular iron levels, and concomitantly promotes anti-inflammatory M2 phenotype polarization in murine macrophages. An emerging prognostic factor in glioblastoma is the methylation status of the MGMT promoter. The TCGA-GBM study[15] suggested that MGMT methylation shifts the GBM mutation spectrum under alkylating treatment, a finding with potential clinical implications[34]. According to M2-macrophage infiltration stratification in TCGA-GBM cohort, a significant relation was confirmed with MGMT-promoter methylation status. During iron metabolism, Fe2+ is generally in the intracellular labile iron pool or stored by ferritin composed of ferritin heavy chain 1 and ferritin light chain[40].
Quantification of M2-TAMs in patients with poor prognosis was found to be associated with a deregulated ferroptosis expression program mainly including: TNFAIP3, ALOX5, PLIN2, SAT1, FTL, CTSB, PARP8, HMOX1, and ATG7. During glioblastoma, TNFAIP3 has already been shown to be implicated in temozolomide resistance by an intermediary mechanism passing through Akt and nuclear factor kappa B (NF-κB) signaling. FTL promoted the development of an immunosuppressive TME by inducing M2 polarization in TAMs[41]. In the Chinese Han population, rs2291427 in ALOX5 was associated with developing GBM[42] and its expression is already recognized as an adverse prognosis marker of glioblastoma[43]. At the single cell level, macrophages PLIN2-positive have already shown to be enriched in tumor samples as compared to non-tumors ones[44]. SAT1 regulated polyamine metabolism in myeloid cells from glioblastoma tumors[45]. CTSB has been already associated with M2 macrophage polarization during glioblastoma. Inhibition of HMOX1 in glioblastoma multiforme reduced cell migration[46]. ATG7 is a component of the autophagy machinery and could influence the ferroptosis program[47]. Deep learning analysis of single cell transcriptomes of M2-TAMs highlighted inverse regulation of TNFAIP3 (repression of ferroptosis driver) and FTL (up-regulation of ferroptosis suppressor) during recurrence of glioblastoma suggesting a defect of ferroptosis in these immune cells during disease progression. During glioblastoma recurrence, M2-TAMs were characterized by an increase of FTL expression. FTL is classified as a ferroptosis suppressor in Ferrdb V2 database. During glioma progression, FTL is known to contribute to the protumor microenvironment by promoting M2 polarization in TAMs via inhibiting the expression of iPLA2β to facilitate the ferroptosis pathway[41]. TNFAIP3 expression was found to be totally repressed in CD16+/CD163+ infiltrating cells from recurrent glioblastoma. TNFAIP3 is classified as a ferroptosis driver in ferrdb V2 database. TNFAIP3, also known as A20, is a ubiquitin-editing enzyme that acts as an endogenous suppressor of NF-κB, which activates inflammation[48]. However, the inhibition of A20/TNFAIP3 by YTHDF2 through Akt and NF-κB signaling is known to promote resistance to temozolomide[49].
Our results showed that alternative expression of TNFAIP3 and FTL in TAMs discriminates tumor recurrence status of the tumors, with a proinflammatory signature associated with TNFAIP3 expression in primary stage and with an invasive signature associated with FTL expression in recurrent stage involving: APO-E, SERPINE1, TXNIP, GPNMB, CST3, DHFR, B2M, and NUPR1. All these genes have already been suggested to play a role in glioblastoma pathogenesis. APO-E single cell expression in M2-TAMs was found to be increased in cells from recurrent glioblastoma. During glioblastoma, immunohistochemistry experiments showed that there was APO-E immunoreactivity in tumor cells, macrophages in necrotic areas and adjacent astrocytes[50]. This finding suggests that APO-E is involved in the delivery of lipids to tumor cells and in the recycling of lipids by macrophages in necrotic areas. APO-E could regulate the polarization changes of macrophages, participate in the construction of tumor immune microenvironment, regulate tumor inflammation and immune response and play a role in tumor progression, invasion, and metastasis[51]. During glioblastoma progression, the induction of SERPINE1 is known to be ROS-dependent under hypoxia, and ROS-induced HIF-1α enhances SERPINE1 expression through direct binding to the SERPINE1 promoter region[52]. TXNIP is directly involved in inflammatory activation through its interaction with the nucleotide-binding domain, leucine-rich-containing family, and pyrin domain-containing-3 (NLRP3) inflammasome complex. In microglia, TXNIP is associated with ROS production under thrombin treatment, a factor involved in brain injury after infarction or hemorrhage[53]. GPNMB, also known as hematopoietic growth factor inducible neurokinin-1 type, has already been characterized as a marker of glioma-induced microglial polarization, since it was found to be regulated in the transcriptome of microglia activated by glioma-conditioned medium[4]. CST3 is a protease inhibitor acting on cathepsin B, which is correlated with glioma malignancy. CST3 has been shown to be implicated in the invasiveness of human glioblastoma cells[54]. CST3 is also known to be repressed in unfavorable glioma and could be used as a prognosis indicator in the disease[55]. DHFR converts dihydrofolate into tetrahydrofolate, a methyl group shuttle required for the de novo synthesis of purines and its inhibitor methotrexate has shown some effect in the therapy of glioblastoma with leptomeningeal dissemination[56]. Inhibition of DHFR targets the self-renewing potential of brain tumor-initiating cells[57] and folate can reprogram glioblastoma tumor cells with pluripotent properties. B2M maintains glioblastoma stem cells and induces M2-like polarization of TAMs. NUPR1 is known to be implicated in proliferation of glioblastoma cells via ERK1/2, p38 MAPK signaling and caspase-3[58]. Thus, the association of these 8 ferroptosis-related genes with poor prognosis in our in silico study is largely supported by the literature in the field documenting the functional relevance of cognate proteins individually in glioblastoma pathogenesis or progression. Interestingly, we compared our signature with established ferroptosis-responsive transcriptional markers such as CHAC1, PTGS2, ACSL4, LPCAT3, ALOX15, GPX4, HSPB1, and STEAP3[43,59-64]. However, in contrast to FTL and TNFAIP3, except HSPB1, neither other ferroptosis tested markers showed a significant association with the macrophage M2 infiltration categories when evaluated in the bulk GBM transcriptome from the GSE4412 cohort (Figure S7A,B). Except for HSPB1, this suggests that canonical ferroptosis-responsive markers do not stratify M2-TAM infiltration levels in this dataset, consistent with their known context-dependent induction. This observation supports the idea that ferroptosis-related transcriptional programs in TAMs are heterogeneous and cannot be inferred solely from canonical stress-response genes. HSPB1 is a ferroptosis suppressor which has already been shown to be associated with poor prognosis and immunosuppressive micro-environment attributed to T-cell exhaustion and cytotoxic T-lymphocyte evasion during glioblastoma[65]. A well-known regulator of NF-κB signaling and inflammatory responses, TNFAIP3 dysregulation in recurrent M2-TAMs may also indicate global immune reprogramming than a direct ferroptosis-related mechanism. However, we observed strong positive correlations between PTGS2 and TNFAIP3, and between TNFAIP3 and STEAP3, both of which are ferroptosis-responsive genes (Figure S7B).
Ferroptosis is a regulatory cell death process which has been shown to modulate the efficacy of chemotherapy, radiotherapy and immunotherapy; hence drug combination targeting ferroptosis signals may improve the current efficacy of these cancer treatments. The dialog between macrophage and ferroptosis highlighted in this study may be targeted through magnetosome delivery into tumors to induce M2 to M1 macrophage repolarization, which would increase Fe ions release, thereby producing excessive hydrogen peroxide and impelling ferroptosis[66].
5. Limitations
Our study relies primarily on bulk and single-cell transcriptomic data, which limits the ability to infer ferroptosis sensitivity with mechanistic precision. Ferroptosis is fundamentally a metabolic and redox-driven process, and transcriptional profiles alone cannot capture iron availability, lipid peroxidation dynamics, or antioxidant capacity. Gene expression signatures have limited power to predict actual ferroptosis occurrence. Moreover, metabolic flux and redox status are themselves capable of shaping gene expression patterns, making the relationship between transcription and ferroptosis bidirectional rather than linear. This implies that transcriptomic states may reflect downstream consequences of metabolic stress rather than its upstream drivers. Single-cell RNA-seq, while more granular, still cannot measure lipid peroxidation or redox imbalance at the single-cell level. Our analyses were conducted in silico, and as a result, our conclusions regarding ferroptosis-related states in TAMs remain correlative. Future work integrating metabolic, lipidomic, and functional perturbation approaches will be essential to confirm the mechanistic relevance of the transcriptional patterns identified here.
6. Conclusion
This study indicates that ferroptosis defects occur during M2 polarization of tumor-associated macrophages in glioblastomas with the poorest prognosis. The disease recurrence further emphasizes the role of ferroptosis-impaired macrophages in driving a molecular signature that fosters glioblastoma invasion. Importantly, restoring ferroptotic activity in tumor-associated macrophages may represent a promising therapeutic strategy to counteract disease progression and improve outcomes in this highly aggressive malignancy.
Supplementary materials
The supplementary material for this article is available at: Supplementary materials.
Authors contribution
Desterke C, Hamaï A: Conceptualization, data interpretation, writing-original draft.
Elhage R, Fu Y, Duruel C, Cresseaux R, Goffin V, Chang-Marchand Y: Writing-review & editing.
Conflicts of interest
Rima Elhage, Clémence Duruel, Rose Cresseaux, and Ahmed Hamaï are affiliated with Ferostem Group. The other authors declare that they have no conflicts of interest.
Ethical approval
Not applicable.
Consent to participate
Not applicable.
Consent for publication
Not applicable.
Availability of data and materials
The data and materials supporting the findings of this study are available from the corresponding author upon reasonable request.
Funding
The work of Ferostem group was supported by INSERM; Université de Paris Cité; Comité de Paris de la Ligue Contre le Cancer; and under the program “Investissement d’Avenir” launched by the French Government (Grant No. ANR‐18‐IdEx‐0001) as part of its program «Emergence».
Copyright
© The Author(s) 2026.
References
-
1. Ohgaki H, Kleihues P. Epidemiology and etiology of gliomas. Acta Neuropathol. 2005;109(1):93-108.[DOI]
-
2. Pouyan A, Ghorbanlo M, Eslami M, Jahanshahi M, Ziaei E, Salami A, et al. Glioblastoma multiforme: Insights into pathogenesis, key signaling pathways, and therapeutic strategies. Mol Cancer. 2025;24(1):58.[DOI]
-
4. Walentynowicz KA, Ochocka N, Pasierbinska M, Wojnicki K, Stepniak K, Mieczkowski J, et al. In search for reliable markers of glioma-induced polarization of microglia. Front Immunol. 2018;9:1329.[DOI]
-
5. Wang G, Zhong K, Wang Z, Zhang Z, Tang X, Tong A, et al. Tumor-associated microglia and macrophages in glioblastoma: From basic insights to therapeutic opportunities. Front Immunol. 2022;13:964898.[DOI]
-
9. Yu H, Guo P, Xie X, Wang Y, Chen G. Ferroptosis, a new form of cell death, and its relationships with tumourous diseases. J Cell Mol Med. 2017;21(4):648-657.[DOI]
-
11. Hangauer MJ, Viswanathan VS, Ryan MJ, Bole D, Eaton JK, Matov A, et al. Drug-tolerant persister cancer cells are vulnerable to GPX4 inhibition. Nature. 2017;551:247-250.[DOI]
-
12. Griess B, Mir S, Datta K, Teoh-Fitzgerald M. Scavenging reactive oxygen species selectively inhibits M2 macrophage polarization and their pro-tumorigenic function in part, via Stat3 suppression. Free Radic Biol Med. 2020;147:48-60.[DOI]
-
13. Kapralov AA, Yang Q, Dar HH, Tyurina YY, Anthonymuthu TS, Kim R, et al. Redox lipid reprogramming commands susceptibility of macrophages and microglia to ferroptotic death. Nat Chem Biol. 2020;16:278-290.[DOI]
-
14. Li B, Dewey CN. RSEM: Accurate transcript quantification from RNA-Seq data with or without a reference genome. BMC Bioinform. 2011;12(1):323.[DOI]
-
16. Barrett T, Wilhite SE, Ledoux P, Evangelista C, Kim IF, Tomashevsky M, et al. NCBI GEO: Archive for functional genomics data sets: Update. Nucleic Acids Res. 2012;41(D1):D991-D995.[DOI]
-
17. Freije WA, Castro-Vargas FE, Fang Z, Horvath S, Cloughesy T, Liau LM, et al. Gene expression profiling of gliomas strongly predicts survival. Cancer Res. 2004;64(18):6503-6510.[DOI]
-
20. Ritchie ME, Phipson B, Wu D, Hu Y, Law CW, Shi W, et al. Limma powers differential expression analyses for RNA-sequencing and microarray studies. Nucleic Acids Res. 2015;43(7):e47.[DOI]
-
22. Therneau TM, Grambsch PM. Modeling survival data: Extending the cox model. New York: Springer; 2000.[DOI]
-
23. Zhou N, Yuan X, Du Q, Zhang Z, Shi X, Bao J, et al. FerrDb V2: Update of the manually curated database of ferroptosis regulators and ferroptosis-disease associations. Nucleic Acids Res. 2023;51(D1):D571-D582.[DOI]
-
24. Desterke C, Xiang Y, Elhage R, Duruel C, Chang Y, Hamaï A. Ferroptosis inducers upregulate PD-L1 in recurrent triple-negative breast cancer. Cancers. 2024;16(1):155.[DOI]
-
25. Thiele C, Hirschfeld G. Cutpointr: Improved estimation and validation of optimal cutpoints in R. J Stat Soft. 2021;98(11):1-27.[DOI]
-
26. Wickham H. ggplot2: Elegant graphics for data analysis. New York: Springer; 2009.[DOI]
-
28. Xu C, Su Z. Identification of cell types from single-cell transcriptomes using a novel clustering method. Bioinformatics. 2015;31(12):1974-1980.[DOI]
-
29. Kuhn M. Building predictive models in R Using the caret Package. J Stat Soft. 2008;28(5):1-26.[DOI]
-
30. Beck MW. NeuralNetTools: Visualization and analysis tools for neural networks. J Stat Soft. 2018;85(11):1-20.[DOI]
-
31. Trapnell C, Cacchiarelli D, Grimsby J, Pokharel P, Li S, Morse M, et al. The dynamics and regulators of cell fate decisions are revealed by pseudotemporal ordering of single cells. Nat Biotechnol. 2014;32:381-386.[DOI]
-
32. Qiu X, Trapnell C, Mao Q, Wang L. DDRTree: Learning Principal Graphs with DDRTree [Internet]. 2017 [cité 11 janv 2024]. Available from: https://cran.r-project.org/web/packages/DDRTree/index.html
-
34. Verhaak RGW, Hoadley KA, Purdom E, Wang V, Qi Y, Wilkerson MD, et al. Integrated genomic analysis identifies clinically relevant subtypes of glioblastoma characterized by abnormalities in PDGFRA, IDH1, EGFR, and NF1. Cancer Cell. 2010;17(1):98-110.[DOI]
-
35. Noushmehr H, Weisenberger DJ, Diefes K, Phillips HS, Pujara K, Berman BP, et al. Identification of a CpG island methylator phenotype that defines a distinct subgroup of glioma. Cancer Cell. 2010;17(5):510-522.[DOI]
-
36. Xu X, Zhang Y, Liao C, Zhou H, Wu Y, Zhang W. Impact of ferroptosis-related risk genes on macrophage M1/M2 polarization and prognosis in glioblastoma. Front Cell Neurosci. 2024;17:1294029.[DOI]
-
37. Qian Z, Zhang Z, Bai W, Li J, Rao X, Huang G, et al. Immunometabolic crosstalk between tumor- associated macrophages and ferroptotic cancer cells: Mechanisms, regulation, and therapeutic applications. Front Immunol. 2026;16:1628142.[DOI]
-
38. Wen Q, Liu J, Kang R, Zhou B, Tang D. The release and activity of HMGB1 in ferroptosis. Biochem Biophys Res Commun. 2019;510(2):278-283.[DOI]
-
39. Rahaman S, Vohora D, Kamal A. Ferroptosis-induced immune modulation: A new frontier in glioblastoma therapy. Naunyn-Schmiedeberg’s Arch Pharmacol. 2026:26;1-26:[DOI]
-
44. Wei Z, Liu H, Yang Y, Liu M. Molecular characterization of macrophage-related prognostic factors in glioblastoma revealed by combined analysis on single-cell and bulk transcriptome data. Discov Onc. 2025;16:1948.[DOI]
-
45. Rana AB, Lombard DB, Shah AH, Welford SM. Polyamine acetylation mediates crosstalk between cancer cells and myeloid cells to promote mesenchymal/plurimetabolic states in glioblastoma. Neuro Oncol. 2025;27(10):2574-2591.[DOI]
-
47. Zhou B, Liu J, Kang R, Klionsky DJ, Kroemer G, Tang D. Ferroptosis is a type of autophagy-dependent cell death. Semin Cancer Biol. 2020;66:89-100.[DOI]
-
49. Chen Y, Wang YL, Qiu K, Cao YQ, Zhang FJ, Zhao HB, et al. YTHDF2 promotes temozolomide resistance in glioblastoma by activation of the Akt and NF-κB signalling pathways via inhibiting EPHB3 and TNFAIP3. Clin Transl Immunol 2022;11(5):e1393.[DOI]
-
51. Miao G, Zhuo D, Han X, Yao W, Liu C, Liu H, et al. From degenerative disease to malignant tumors: Insight to the function of ApoE. Biomed Pharmacother. 2023;158:114127.[DOI]
-
56. Kang X, Chen F, Yang SB, Wang YL, Qian ZH, Li Y, et al. Intrathecal methotrexate in combination with systemic chemotherapy in glioblastoma patients with leptomeningeal dissemination: A retrospective analysis. World J Clin Cases. 2022;10(17):5595-5605.[DOI]
-
57. Fawal MA, Jungas T, Davy A. Inhibition of DHFR targets the self-renewing potential of brain tumor initiating cells. Cancer Lett. 2021;503:129-137.[DOI]
-
59. Skossyrskiy VS, Kurdina NA, Kuzovkova VS, Boot MS, Zelenchenkova PI, Popova EO, et al. Cyclooxygenase-2 as a potential therapeutic target in the treatment of chemoresistant glioblastomas. Med Oncol. 2025;42(12):530.[DOI]
-
61. Freitas-Cortez MA, Masrorpour F, Jiang H, Mahmud I, Lu Y, Huang A, et al. Cancer cells avoid ferroptosis induced by immune cells via fatty acid binding proteins. Mol Cancer. 2025;24(1):40.[DOI]
-
63. Zhang G, Hu J, Li A, Zhang H, Guo Z, Li X, et al. Ginsenoside Rg5 inhibits glioblastoma by activating ferroptosis via NR3C1/HSPB1/NCOA4. Phytomedicine. 2024;129:155631.[DOI]
-
64. Li S, He Y, Chen K, Sun J, Zhang L, He Y, et al. RSL3 drives ferroptosis through NF-κB pathway activation and GPX4 depletion in glioblastoma. Oxid Med Cell Longev. 2021;2021:2915019.[DOI]
-
65. Deng S, Zheng Y, Mo Y, Xu X, Li Y, Zhang Y, et al. Ferroptosis suppressive genes correlate with immunosuppression in glioblastoma. World Neurosurg. 2021;152:e436-e448.[DOI]
Copyright
© The Author(s) 2026. This is an Open Access article licensed under a Creative Commons Attribution 4.0 International License (https://creativecommons.org/licenses/by/4.0/), which permits unrestricted use, sharing, adaptation, distribution and reproduction in any medium or format, for any purpose, even commercially, as long as you give appropriate credit to the original author(s) and the source, provide a link to the Creative Commons license, and indicate if changes were made.
Publisher’s Note
Science Exploration remains a neutral stance on jurisdictional claims in published
maps
and institutional affiliations. The views expressed in this article are solely those
of
the author(s) and do not reflect the opinions of the Editors or the publisher.
Share And Cite


Science Exploration Style
Desterke C, Elhage R, Fu Y, Duruel C, Cresseaux R, Goffin V, et al. Defects of ferroptosis in tumor-associated M2-macrophages during adverse and recurrent glioblastoma. Ferroptosis Oxid Stress. 2026;2:202604. https://doi.org/10.70401/fos.2026.0025
Tips
Copy completed.
Submit a Manuscript
Author Instructions
Cite this Article
Article Metrics
0
View
0
Download
Cited
Article Updates

- Abstract
- Keywords
- 1. Introduction
- 2. Material and Methods
- 3. Results
- 4. Discussion
- 5. Limitations
- 6. Conclusion
- Supplementary materials
- Authors contribution
- Conflicts of interest
- Ethical approval
- Consent to participate
- Consent for publication
- Availability of data and materials
- Funding
- References
- Copyright
Science Exploration Style
Desterke C, Elhage R, Fu Y, Duruel C, Cresseaux R, Goffin V, et al. Defects of ferroptosis in tumor-associated M2-macrophages during adverse and recurrent glioblastoma. Ferroptosis Oxid Stress. 2026;2:202604. https://doi.org/10.70401/fos.2026.0025
copy
Share Link
copy