The senescence-inhibitory p53 isoform Δ133p53α represses the proinflammatory chemokine CXCL10 in progeria model mice and naturally aged mice

Leo Yamada
1,†

,
Huaitian Liu
1,2
,
Curtis C. Harris
1
,
Izumi Horikawa
1,*
*Correspondence to:
Izumi Horikawa, Laboratory of Human Carcinogenesis, Center for Cancer Research, National Cancer Institute, National Institutes of Health, Bethesda, MA 20892, USA.
E-mail: horikawi@mail.nih.gov
Geromedicine. 2026;2:202627. 10.70401/Geromedicine.2026.0035
Received: April 15, 2026Accepted: August 26, 2026Published: August 27, 2026
Abstract
Aims: Δ133p53α is a naturally occurring isoform of the human p53 protein that inhibits p53-mediated cellular senescence. We previously reported that transgenic expression of this senescence-inhibitory p53 isoform counteracts aging-associated pathological changes in progeria model mice (heterozygous LmnaG609G/+). The anti-aging effect of Δ133p53α was attributed in part to reduced levels of the proinflammatory cytokine IL-6. This study aims to comprehensively profile Δ133p53α-induced changes in cytokines and chemokines.
Methods: A Luminex-based multiplex quantitative assay was performed using mouse serum samples from transgenic Δ133p53α-expressing LmnaG609G/+ mice and non-expressing controls. Quantitative RT-PCR and RNA in situ hybridization assays were used to assess Cxcl10 expression in mouse tissues. In addition, gene expression datasets from human tissues were analyzed.
Results: In the Luminex assay, used as an exploratory screen, transgenic Δ133p53α expression was suggestively associated with reduced serum levels of not only IL-6 but also CXCL1, IL-1α, and CXCL10. We further characterized CXCL10, which has not previously been linked to progeria in mice or humans. Consistent with reduced serum CXCL10 levels, both young (15-week-old) and old (10-month-old) Δ133p53α-expressing LmnaG609G/+ mice showed reduced Cxcl10 expression in the liver, spleen, and brain, major organs that produce CXCL10, compared with age-matched non-expressing controls. In naturally aged wild-type mice (2 years old), transgenic Δ133p53α expression also significantly repressed Cxcl10 expression in the spleen and brain. An inverse association between CXCL10 and Δ133p53α levels was observed in human spleen tissues.
Conclusion: CXCL10, a proinflammatory chemokine elevated in both accelerated and natural aging, is a potential target of the anti-inflammatory activity of Δ133p53α.
Keywords
p53 isoform, aging, progeria mice, Luminex assay, CXCL10, proinflammatory chemokine, human GTEx dataset
1. Introduction
The human TP53 gene encodes not only the full-length p53 protein (hereafter simply referred to as p53) but also multiple naturally occurring protein isoforms that are N-terminally truncated and/or C-terminally modified[1]. Among these, Δ133p53α is an N-terminally truncated isoform generated via alternative transcription initiated from the intron 4 promoter and alternative translation from the methionine at codon 133[1,2]. Δ133p53α functions as a dominant-negative inhibitory isoform of p53, preferentially inhibiting p53-mediated cellular senescence while preserving or enhancing cellular DNA repair activity[1-4]. We recently generated a transgenic mouse strain that enables inducible expression of this human p53 isoform to investigate its in vivo functions in senescence-associated diseases and conditions[5]. In our previous preprint study[6], by crossing this strain with a progeria model (LmnaG609G/+)[7], we demonstrated that Δ133p53α counteracts progeria-associated pathological changes, including those in the skin and aorta, and extends median lifespan by approximately 10%. These anti-aging effects of Δ133p53α were primarily attributed to the widespread inhibition of cellular senescence (represented by reduced levels of p21Waf1/Cip1, a key effector of p53-mediated senescence, across multiple organs) and a reduction in systemic inflammation (indicated by decreased serum IL-6 levels and reduced Il6 expression in multiple organs)[6].
Although IL-6 is a key cytokine contributing to systemic inflammation in both progeria-associated accelerated aging and natural aging[8-10], a more comprehensive inflammatory profile requires multiplex analysis of a broad range of cytokines and chemokines. To this end, we perform a Luminex-based multiplex assay on serum samples collected from Δ133p53α-expressing LmnaG609G/+ mice and non-expressing controls. This assay leads to the identification of CXCL10 as a proinflammatory chemokine that is potentially repressed by Δ133p53α. Further analyses of Cxcl10 expression in tissues from LmnaG609G/+ mice and aged wild-type mice, together with interrogation of human tissue expression datasets, suggest that Δ133p53α-mediated repression of CXCL10 constitutes part of its counteracting effects on both accelerated and physiological aging.
Although the serum and RNA samples from LmnaG609G/+ mice used in our previous preprint study[6] were also used in the present study, all findings presented here are new and independent.
2. Methods
2.1 Mice
All animal studies have been approved by the Animal Care and Use Committee (ACUC) at the National Cancer Institute (NCI, Frederick, MD) under the protocols ASP 25-264, ASP 24-466, and ASP 21-0212. All animal procedures, including housing and environmental enrichment, breeding, genotyping, recognition and alleviation of pain and distress, collection of tissues and blood, humane endpoints, and euthanasia, followed the ACUC guidelines (https://ncifrederick.cancer.gov/Lasp/ACUC/Frederick/GuidelinesFnl).
All mice used in this study were obtained in our previous study[6] and their genotypes therein are given in the parentheses below. The heterozygous progeria mice included: Δ133p53α-expressing mice in which its Cre-ERT2-mediated activation was induced by tamoxifen injection at 5-6 weeks of age (CAG-133Tam/+;CreTg/+;LmnaG609G/+); control mice with both Δ133p53α and Cre-ERT2 transgenes but not tamoxifen-injected (CAG-133LSL/+;CreTg/+;LmnaG609G/+); control mice without Δ133p53α, with Cre-ERT2 and tamoxifen-injected (CAG-133+/+;CreTg/+;LmnaG609G/+); and control mice without Δ133p53α and Cre-ERT2 (CAG-133+/+;Cre+/+;LmnaG609G/+). The wild-type mice included: Δ133p53α-expressing mice in which its Cre-ERT2-mediated activation was induced by tamoxifen injection at 8-10 weeks of age (CAG-133Tam/+;CreTg/+); control mice with both Δ133p53α and Cre-ERT2 transgenes but not tamoxifen-injected (CAG-133LSL/+;CreTg/+); and control mice without Δ133p53α and Cre-ERT2 (CAG-133+/+;Cre+/+). All experiments used samples from 4 or 5 mice per group, with female and male mice indicated by open and closed circles, respectively, in the data presentation.
2.2 Luminex-based multiplex quantitative assay of mouse serum samples
Serum samples were prepared from blood obtained via post-mortem cardiac puncture. Serum cytokine and chemokine levels were measured at Eve Technologies (Calgary, Canada, https://www.evetechnologies.com/) using the Mouse Cytokine/Chemokine 32-Plex Discovery Assay (MD32; Eve Technologies), a bead-based multiplex immunoassay performed on a Luminex platform. All samples were analyzed in a single assay batch. The data underwent quality control by Eve Technologies prior to release. No missing measurements were identified, and all samples were included in the subsequent data analysis (Table S1). Statistical analyses were performed using GraphPad Prism software (version 11.0.0). Pairwise P-values were calculated using the Mann–Whitney U test. Multiple comparisons across the 32-plex assay panel were corrected using the Benjamini–Hochberg procedure.
2.3 Quantitative RT-PCR (qRT-PCR) assays
Total RNA samples were isolated using the RNeasy Plus Micro Kit (QIAGEN, 74034). Snap-frozen tissues were homogenized in the RLT Plus buffer (supplemented with β-mercaptoethanol) provided in the kit. Cultured cells were suspended in the same RLT Plus buffer. Subsequently, both tissue and cell samples were processed according to the manufacturer’s instructions. RNA quality was checked on the Agilent TapeStation at the CCR Genomics Core, NCI. Reverse transcription for cDNA synthesis was performed using the High-Capacity cDNA Reverse Transcription Kit (Thermo Fisher Scientific, 4368814). qRT-PCR assays were performed on the 7500 Real-Time PCR system (Applied Biosystems) using the TaqMan Gene Expression Master Mix (Thermo Fisher Scientific, 4369016) and the following primers/probe sets (Thermo Fisher Scientific): mouse Cxcl10 (Mm00445235_m1) and human CXCL10 (Hs00171042_m1), as well as mouse Gapdh (Mm99999915_g1) and human GAPDH (Hs02758991_g1) as normalization controls. Quantitative data analysis was performed using the ΔΔCt method (https://assets.thermofisher.com/TFS-Assets/LSG/manuals/cms_042380.pdf). All samples were analyzed in technical triplicate.
2.4 Mouse embryonic fibroblasts (MEFs) and human fibroblasts
MEFs were prepared from mouse embryos as previously described[6]. Retroviral expression of progerin was achieved by transducing the pBABE-puro-GFP-progerin vector (Addgene #17663), along with the pBABE-puro control vector. After two days of puromycin selection (2 µg ml-1), the cells were split into two sets: one set treated for 3 days with 1 µM 4-hydroxytamoxifen (4-OHT), and the other set treated with DMSO alone. After an additional two days of culture, the cells were used for qRT-PCR analyses.
Human fibroblasts from patients with Hutchinson-Gilford progeria syndrome (HGPS), AG11513 and HGADFN271, were obtained from Coriell Institute for Medical Research (https://catalog.coriell.org/) and Progeria Research Foundation (https://www.progeriaresearch.org/), respectively. The lentiviral vector expressing Δ133p53α (pLOC-Δ133p53α; Addgene #241916) and the corresponding control vector (pLOC-RFP, Open Biosystems) were transduced into AG11513 and HGADFN271 cells. Following 1 day of incubation, the cells were selected for 4 days in the presence of blasticidin (5 µg ml-1), followed by qRT-PCR analyses.
2.5 RNA in situ hybridization using RNAscope technology
Spleen and brain tissues were embedded in optimal cutting temperature compound (OCT) and snap-frozen. OCT-embedded tissues were cryosectioned at a thickness of 20 µm using the Cryo-Jane system (Leica Biosystems). The sections were fixed in 2% formaldehyde, and BaseScope duplex in situ hybridization was performed using the BaseScope™ Duplex Reagent Kit (Advanced Cell Diagnostics, #323800) according to the manufacturer's instructions. Briefly, probes were hybridized at 40 °C for 2 hours, followed by signal amplification using the provided amplification reagents. After chromogenic development, sections were counterstained with hematoxylin. The probe used to detect Δ133p53α mRNA was BA-Hs-TP53-1zz-st (Advanced Cell Diagnostics, #863951; 1 ZZ pair targeting exons 7-8 of human TP53; C1 channel, green), which does not cross-hybridize mouse p53 mRNA. For detecting mouse Cxcl10 mRNA, BA-Mm-Cxcl10-3EJ-C2 (Advanced Cell Diagnostics, #1560691-C2; 3 ZZ pairs targeting the exon 3 junction of mouse Cxcl10; C2 channel, red) was included. BaseScope images of spleen sections were scanned using the Axio Scan 2 slide scanner (Carl Zeiss Microscopy) and analyzed using QuPath v0.7.0. Cxcl10-positive staining was defined as a red chromogenic signal in the C2 channel. The percentage of Cxcl10-positive area was calculated by dividing the red-positive area by the total analyzed area, corresponding to the entire tissue section.
2.6 Analysis of human gene expression datasets
Postmortem RNA-seq data generated by the Genotype-Tissue Expression (GTEx) consortium (v8 release) were analyzed as previously performed[6]. Briefly, sequencing reads were aligned to the GRCh38 human reference genome to determine transcript abundances corresponding to Δ133p53α (ENST00000504937.5, GENCODE v26) and CXCL10 (ENSG00000169245.5). Transcripts per million (TPM) values were log₂-transformed [log2(TPM + 1)] prior to downstream analyses. Spearman rank-correlation coefficients were calculated between CXCL10 and Δ133p53α transcripts at the subject level. For the primary multi-tissue analysis, nominal P values were adjusted across the eight prespecified tissue tests using the Benjamini-Hochberg false-discovery-rate (FDR) procedure. For the sex-stratified analysis, nominal P values were adjusted using the Benjamini-Hochberg procedure across the 16 prespecified tissue-by-sex tests.
2.7 Statistical analyses
Statistical analyses were performed using GraphPad Prism software (version 11.0.0). P-values for the serum and qRT-PCR assays were calculated using the Mann-Whitney U test or Welch’s t-test, as specified in each figure legend. For the GTEx dataset analysis, Spearman rank correlation was used to assess associations between variables. Multiple-comparison correction was performed using the Benjamini-Hochberg procedure. P-values < 0.05 were considered statistically significant.
3. Results
3.1 Δ133p53α reduces serum CXCL10 levels in LmnaG609G/+ progeria mice
Serum samples were prepared from 15-week-old heterozygous LmnaG609G/+ progeria mice expressing transgenic Δ133p53α, along with two non-expressing control groups (no-transgene control and no-tamoxifen control) and age-matched wild-type mice (n = 4 per group). A Luminex-based multiplex quantitative assay measuring 32 mouse cytokines and chemokines was then performed (Table S1). Consistent with our previous enzyme-linked immunosorbent assay (ELISA) data[6], serum IL-6 levels were suggested to be increased in LmnaG609G/+ mice and decreased back to the wild-type levels by transgenic Δ133p53α expression (Figure 1a, Table S1). Despite substantial inter-mouse variations within groups, which limited statistical significance, this multiplex assay still identified three additional factors, CXCL1 (also known as KC), IL-1α, and CXCL10 (also known as IP-10), as potentially repressed in the Δ133p53α-expressing group (Figure 1b, Table S1). This study further characterizes CXCL10, a proinflammatory chemokine associated with immune responses, chronic inflammation, and infectious diseases[11,12], but which remains largely unexplored in progeria models and patients.
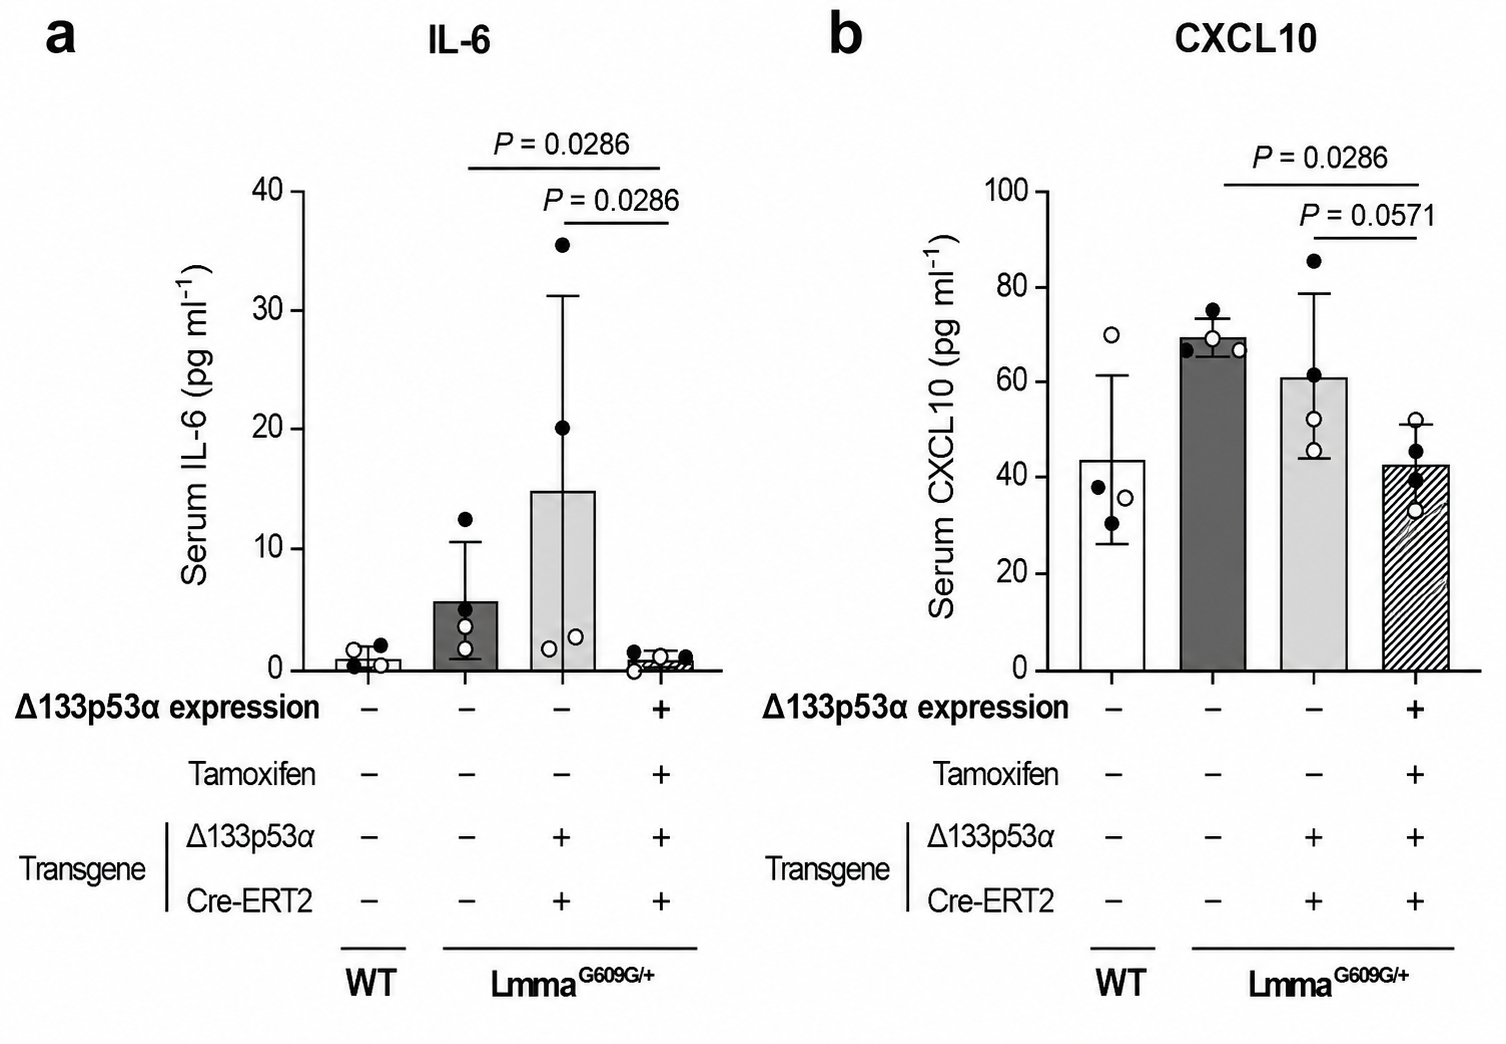
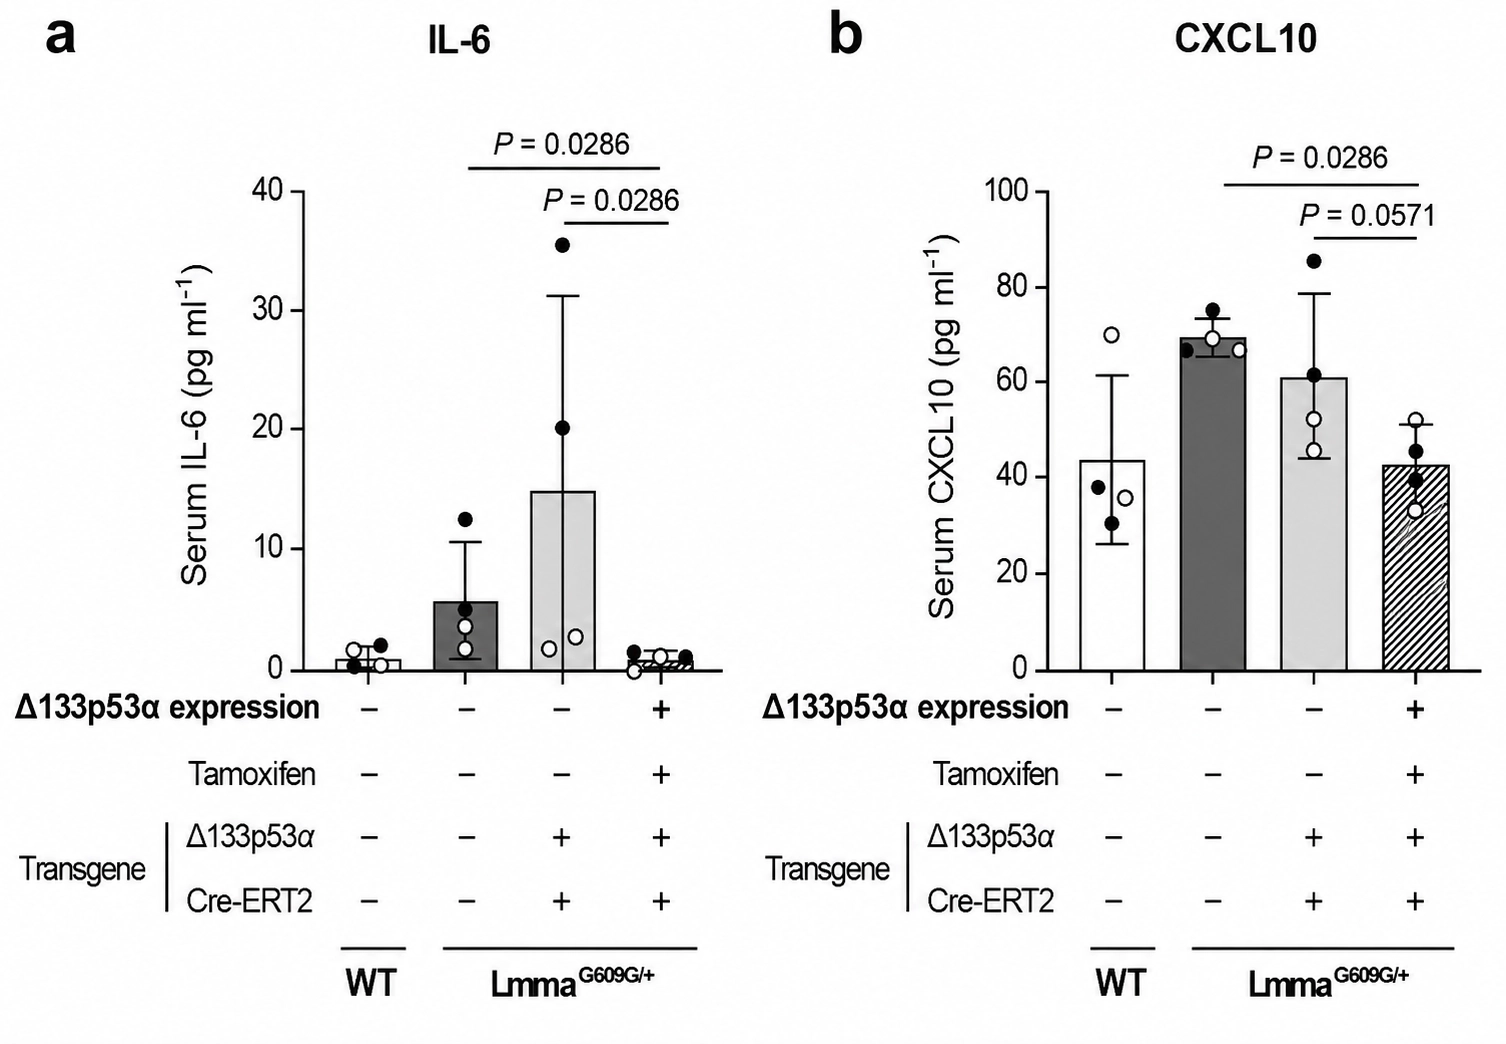
Figure 1. Transgenic expression of Δ133p53α is associated with lower serum IL-6 (a) and CXCL10 (b) levels in heterozygous LmnaG609G/+ progeria mice. Three groups of LmnaG609G/+ mice and one group of WT mice at 15 weeks of age, with the indicated transgene status and tamoxifen treatment, were examined. These include a Δ133p53α-expressing LmnaG609G/+ group (rightmost), two non-expressing LmnaG609G/+ control groups (middle), and an age-matched WT group for comparison (leftmost). Serum concentrations (pg ml-1) measured using the mouse cytokine/chemokine 32-plex assay (Eve Technologies) are presented as mean ± s.d. (n = 4; open circles indicate two females, and closed circles indicate two males). Pairwise P-values shown (calculated using the Mann-Whitney U test) indicate nominal statistical significance or a trend toward significance, although none remains significant after correction for multiple comparisons across the 32-plex panel (Table S1). WT: wild-type.
3.2 Cxcl10 expression is repressed by Δ133p53α in the spleen, brain, and liver of LmnaG609G/+ progeria mice
We next examined mRNA expression levels of Cxcl10 in mouse organs known to express Cxcl10, including the spleen, brain, liver, and lung[11,12] (Figure 2, Figure S1). Using the same set of 15-week-old LmnaG609G/+ mice and age-matched wild-type mice as in the above serum Luminex assay (n = 4 per group), the spleen, brain, and liver showed an increase in Cxcl10 expression associated with progeria, which was reduced back to wild-type levels by transgenic Δ133p53α expression (Figure 2a,b,c, left panels). These changes in Cxcl10 mRNA levels parallel the changes in serum CXCL10 levels as presented above (Figure 1b). When LmnaG609G/+ mice reached 10 months of age, approaching the end of their lifespan, Cxcl10 expression levels in the spleen, brain, and liver of the Δ133p53α-expression group were again as low as those in age-matched wild-type mice, in contrast to the increased levels observed in the third non-expressing control group (tamoxifen-injected control with no Δ133p53α transgene) (Figure 2a,b,c, right panels, n = 5 per group). In the lung, neither a progeria-associated increase nor a Δ133p53α-mediated decrease in Cxcl10 expression was observed at either 15 weeks or 10 months of age (Figure 2d), likely reflecting organ-specific regulations of Cxcl10 expression.
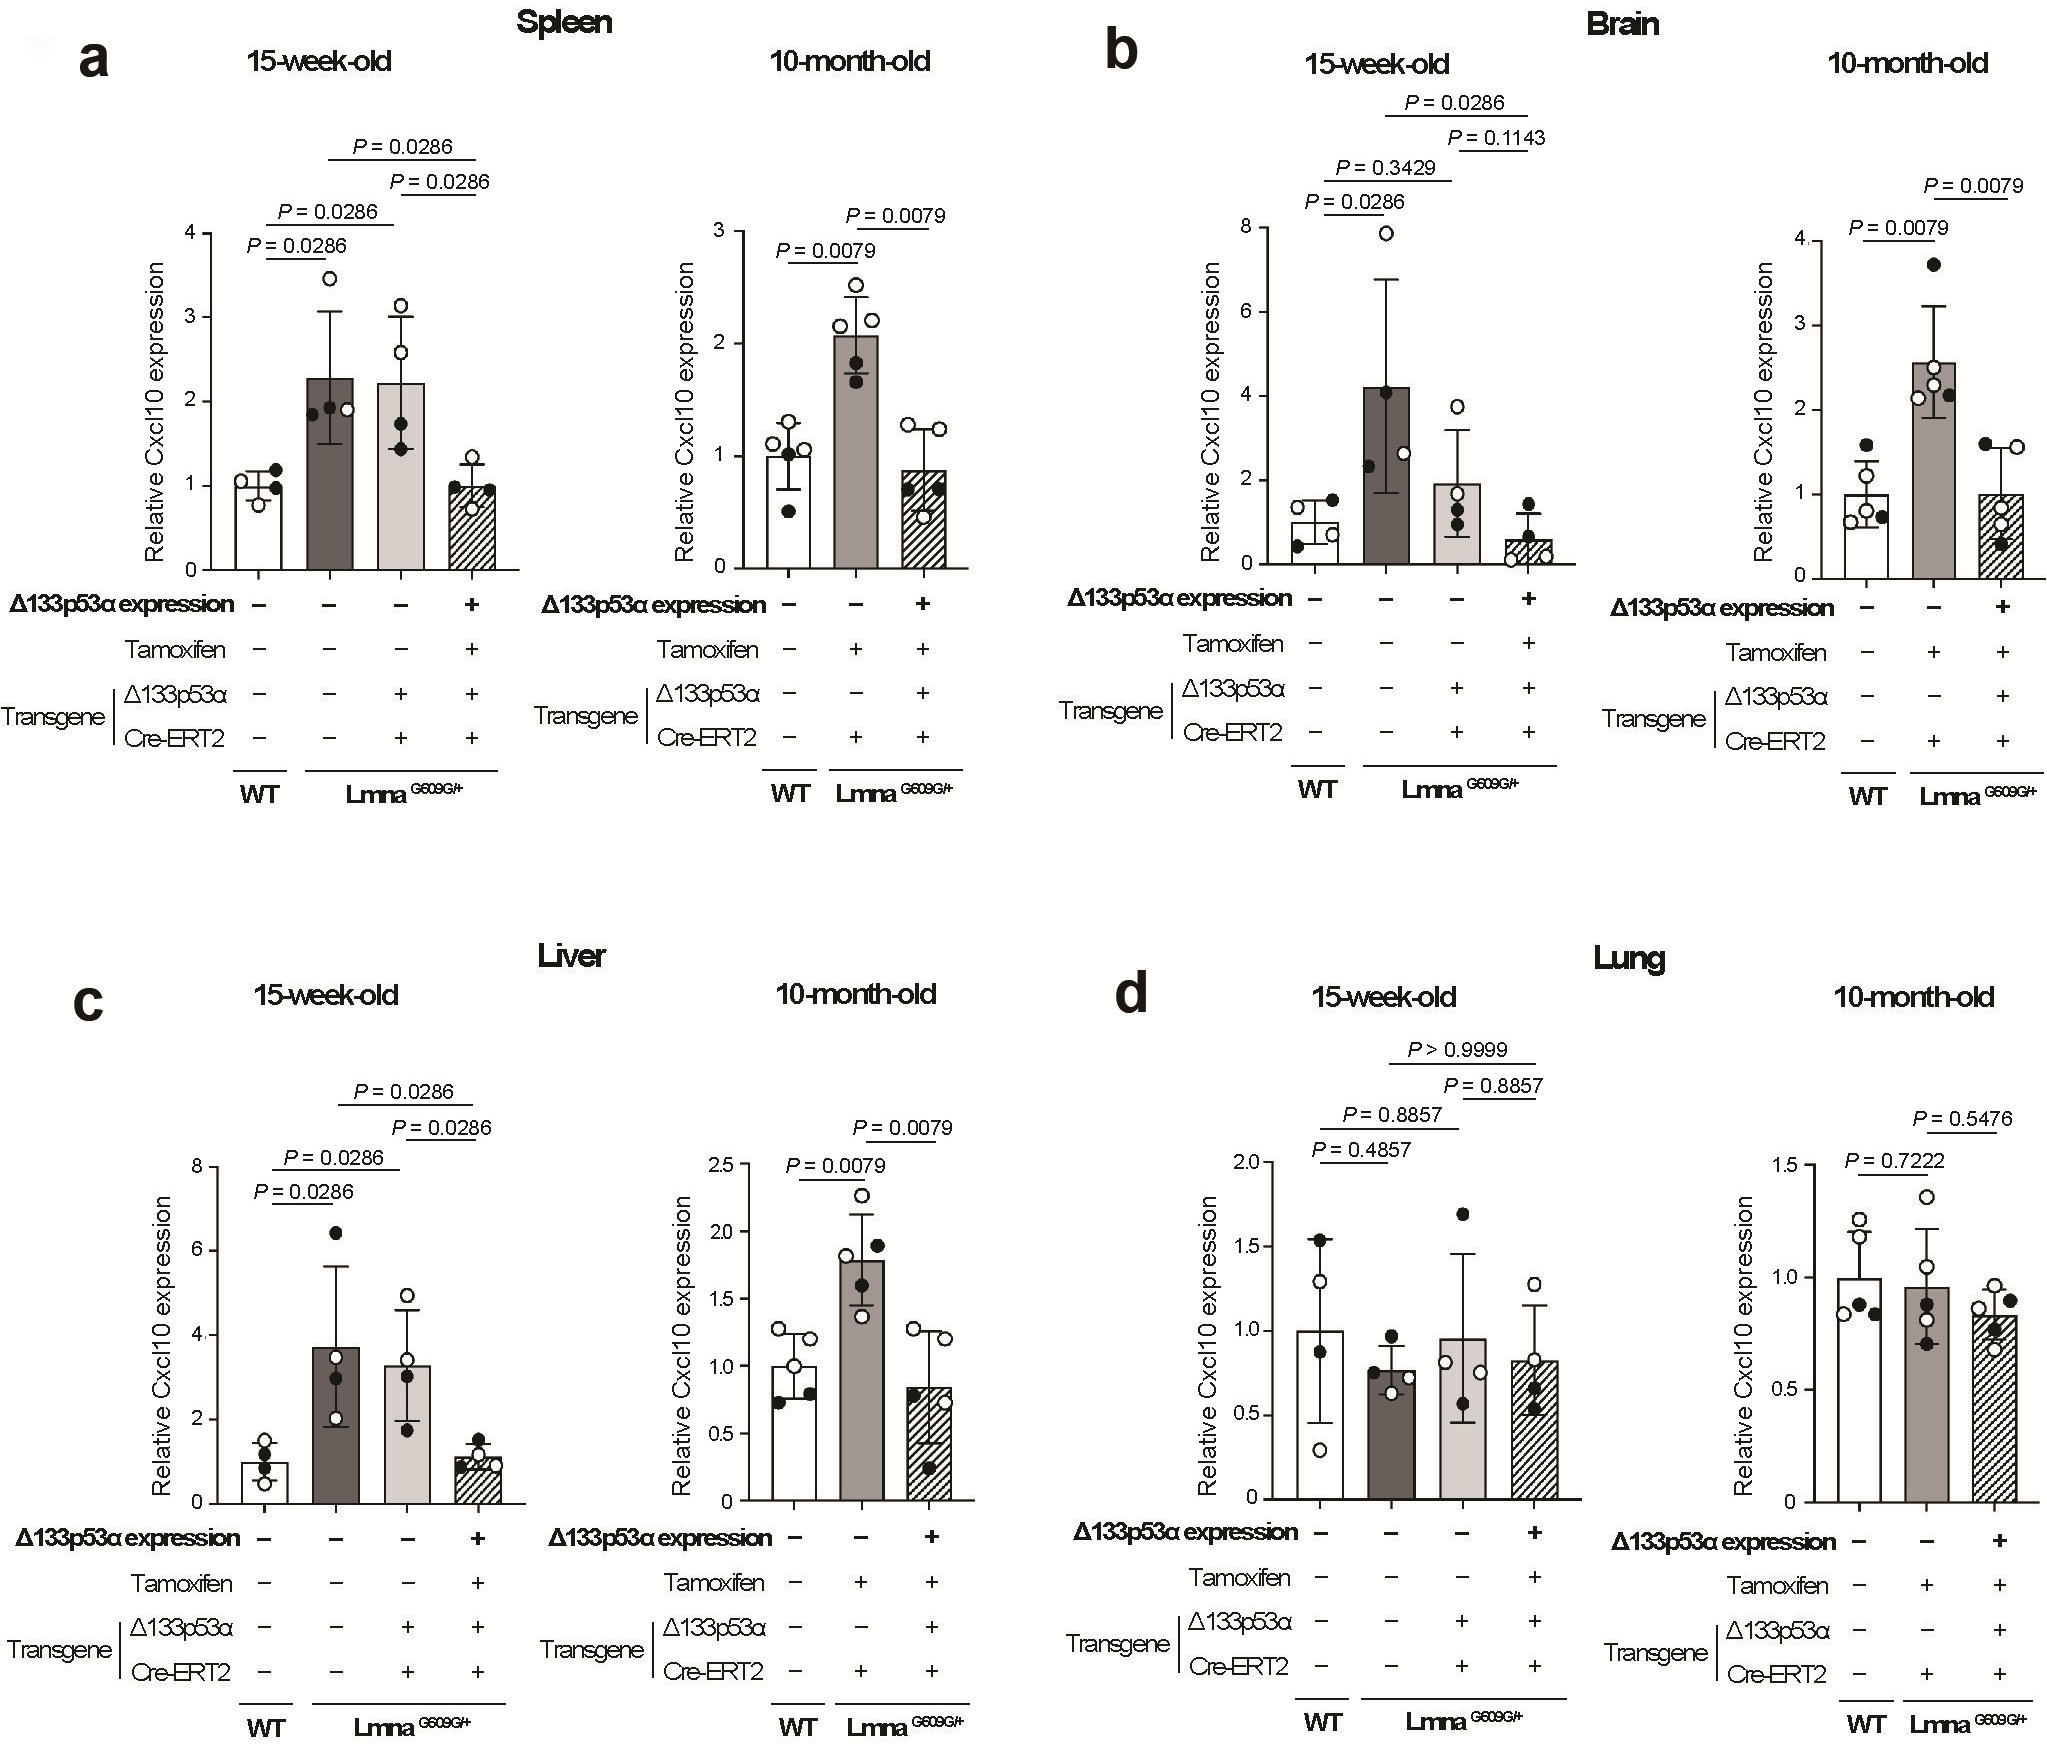
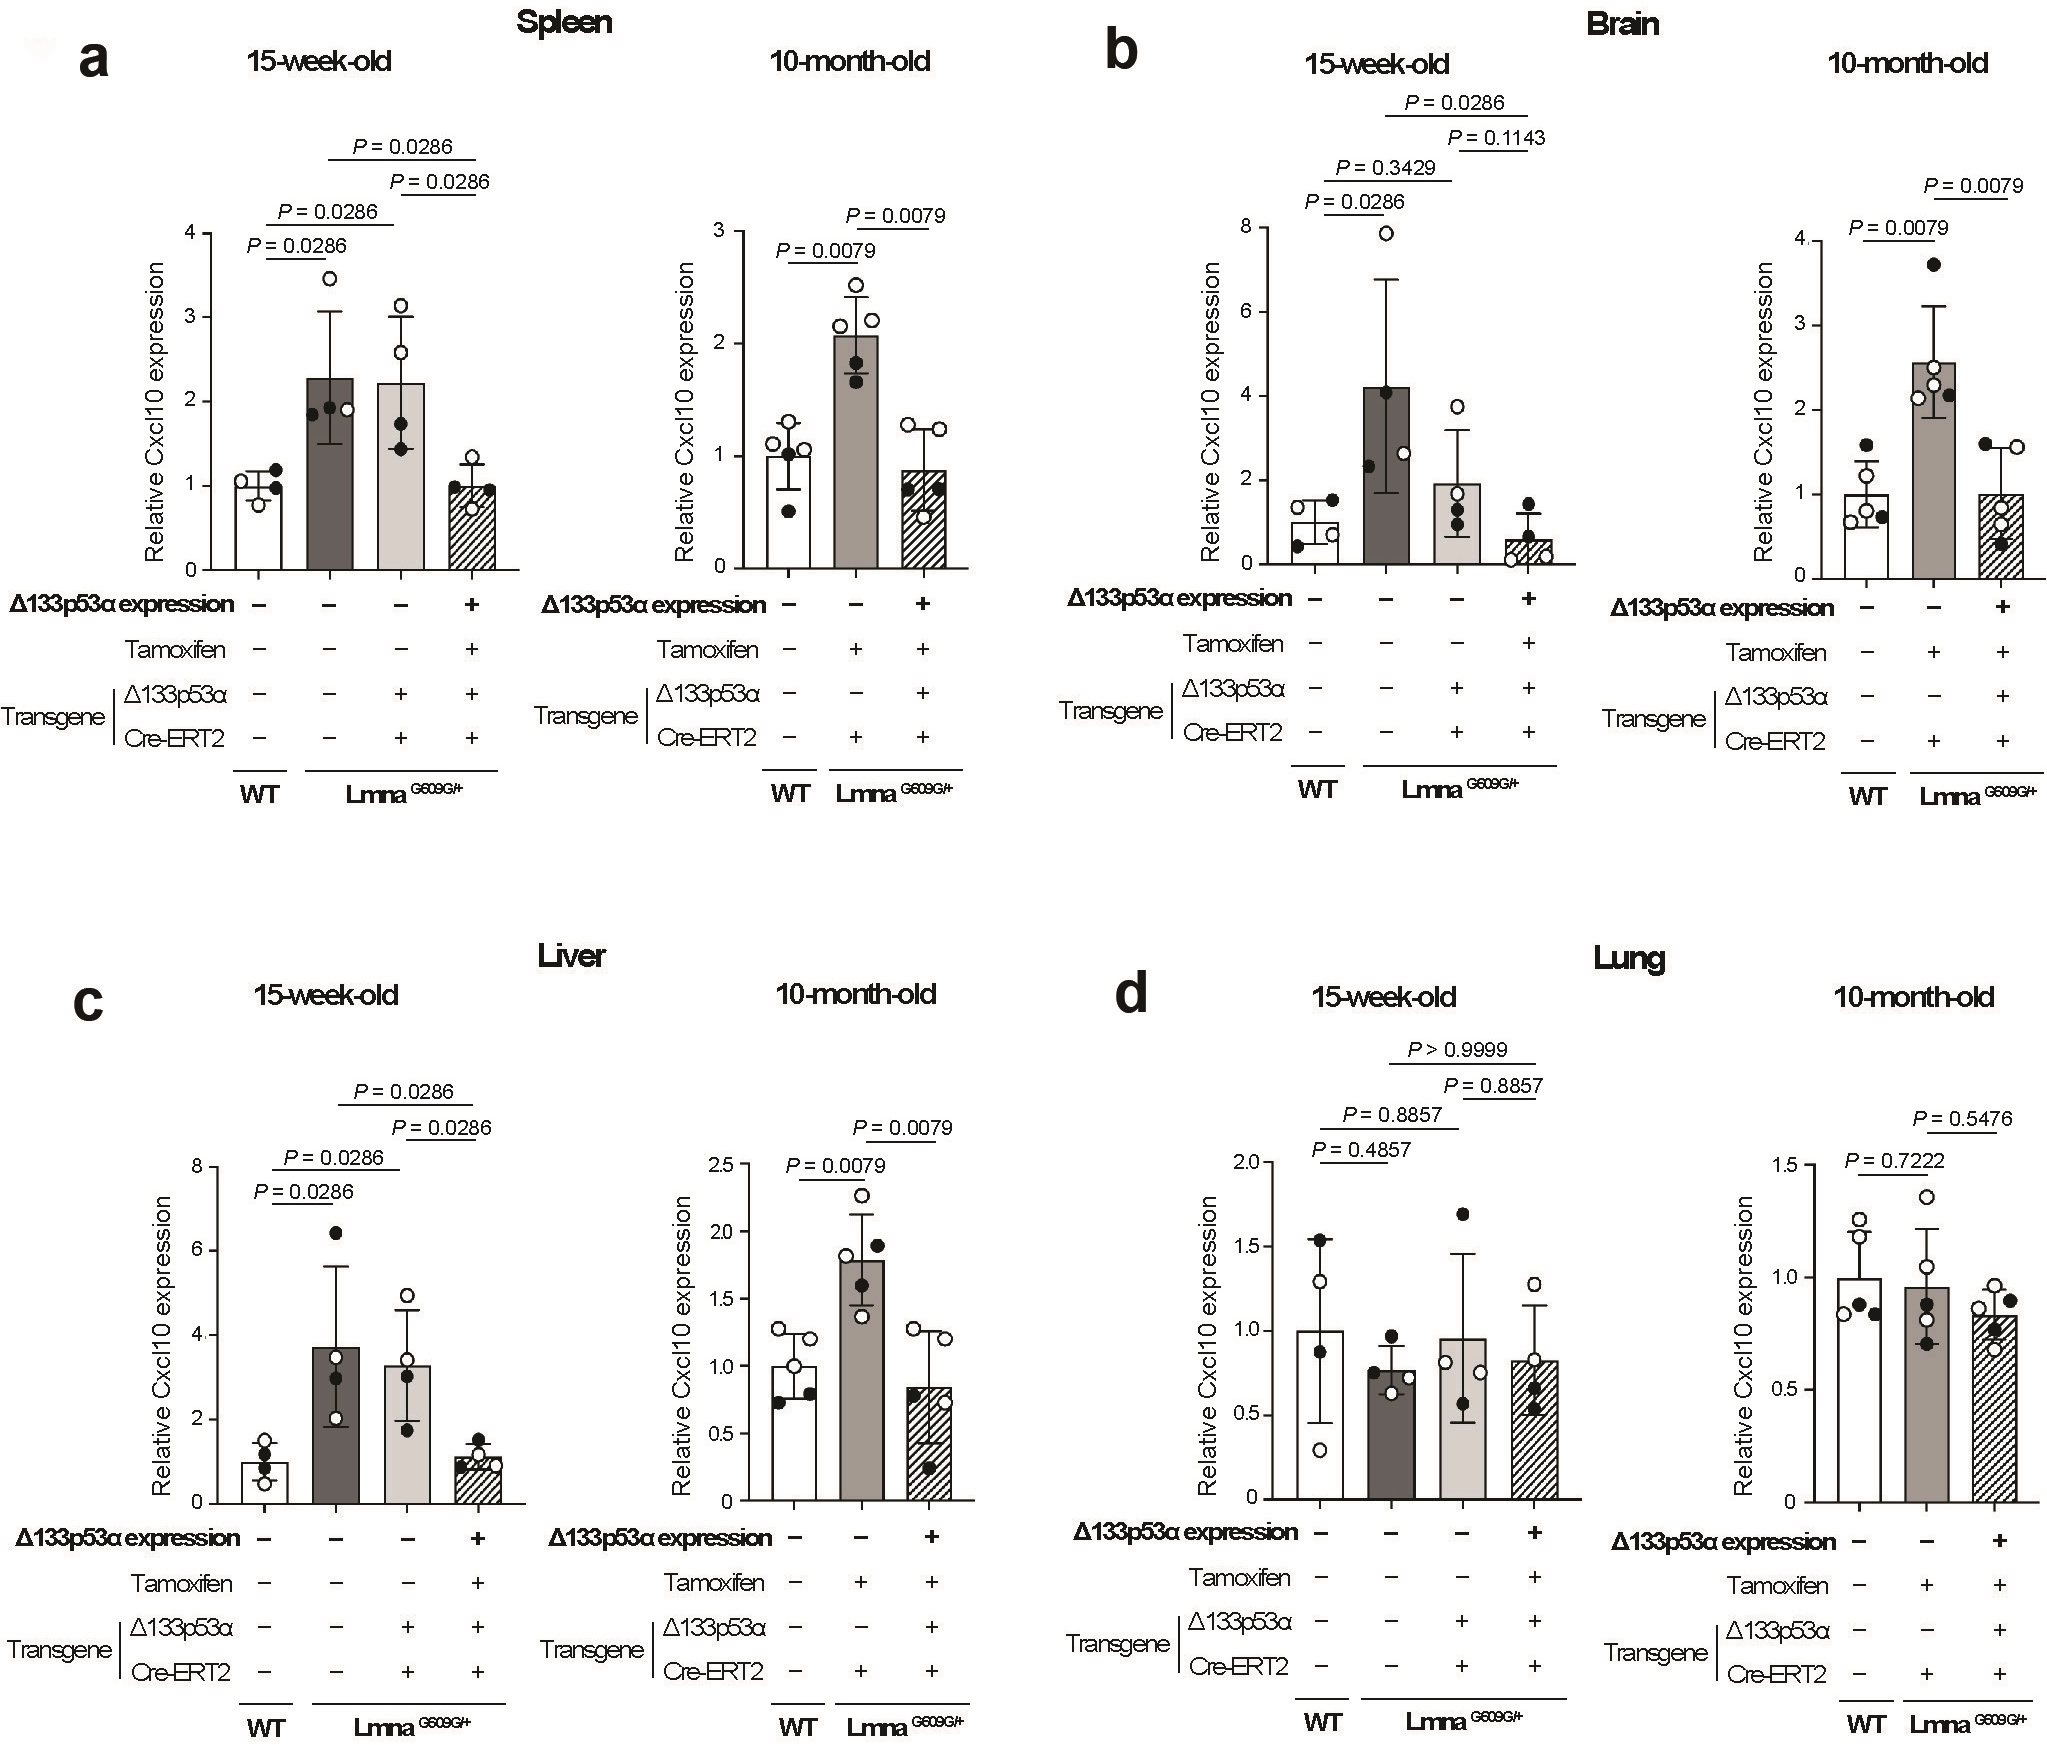
Figure 2. Δ133p53α represses Cxcl10 expression in the spleen, brain, and liver of LmnaG609G/+ mice. Cxcl10 mRNA expression was analyzed by qRT-PCR in the spleen (a); brain (b); liver (c); lung (d) from the same set of 15-week-old mice as in Figure 1 (left panels, n = 4), as well as from 10-month-old mice including Δ133p53α-expressing LmnaG609G/+ mice, non-expressing control LmnaG609G/+ mice (lacking the Δ133p53α transgene), and age-matched WT mice (right panels, n = 5; open circles indicate three females, and closed circles indicate two males). Data are presented as values relative to WT mice in each panel (mean ± s.d. from n = 4 or n = 5, each with technical triplicates). P-values were calculated using the Mann-Whitney U test. qRT-PCR: quantitative RT-PCR; WT: wild-type.
3.3 Cxcl10 expression is repressed by Δ133p53α in the spleen and brain of naturally aged wild-type mice
To investigate the effect of Δ133p53α on Cxcl10 expression during natural aging, we examined 2-year-old wild-type mice expressing Δ133p53α, along with two age-matched control groups, no-tamoxifen control and no-transgene control (n = 4 per group). The results are presented in Figure 3, which also includes 15-week-old and 10-month-old wild-type mice (with no transgene) for comparison. Cxcl10 mRNA levels in the spleen and brain tended to increase with age, if not statistically significant (Figure 3a,b). In these two organs, transgenic expression of Δ133p53α significantly reduced Cxcl10 expression at 2 years of age (Figure 3a,b), recapitulating the results observed in LmnaG609G/+ mice and suggesting that Δ133p53α regulates Cxcl10 in naturally aged mice as well. The effect of Δ133p53α on Cxcl10 expression in the liver and lung showed a weak trend but was not statistically significant (Figure 3c,d).
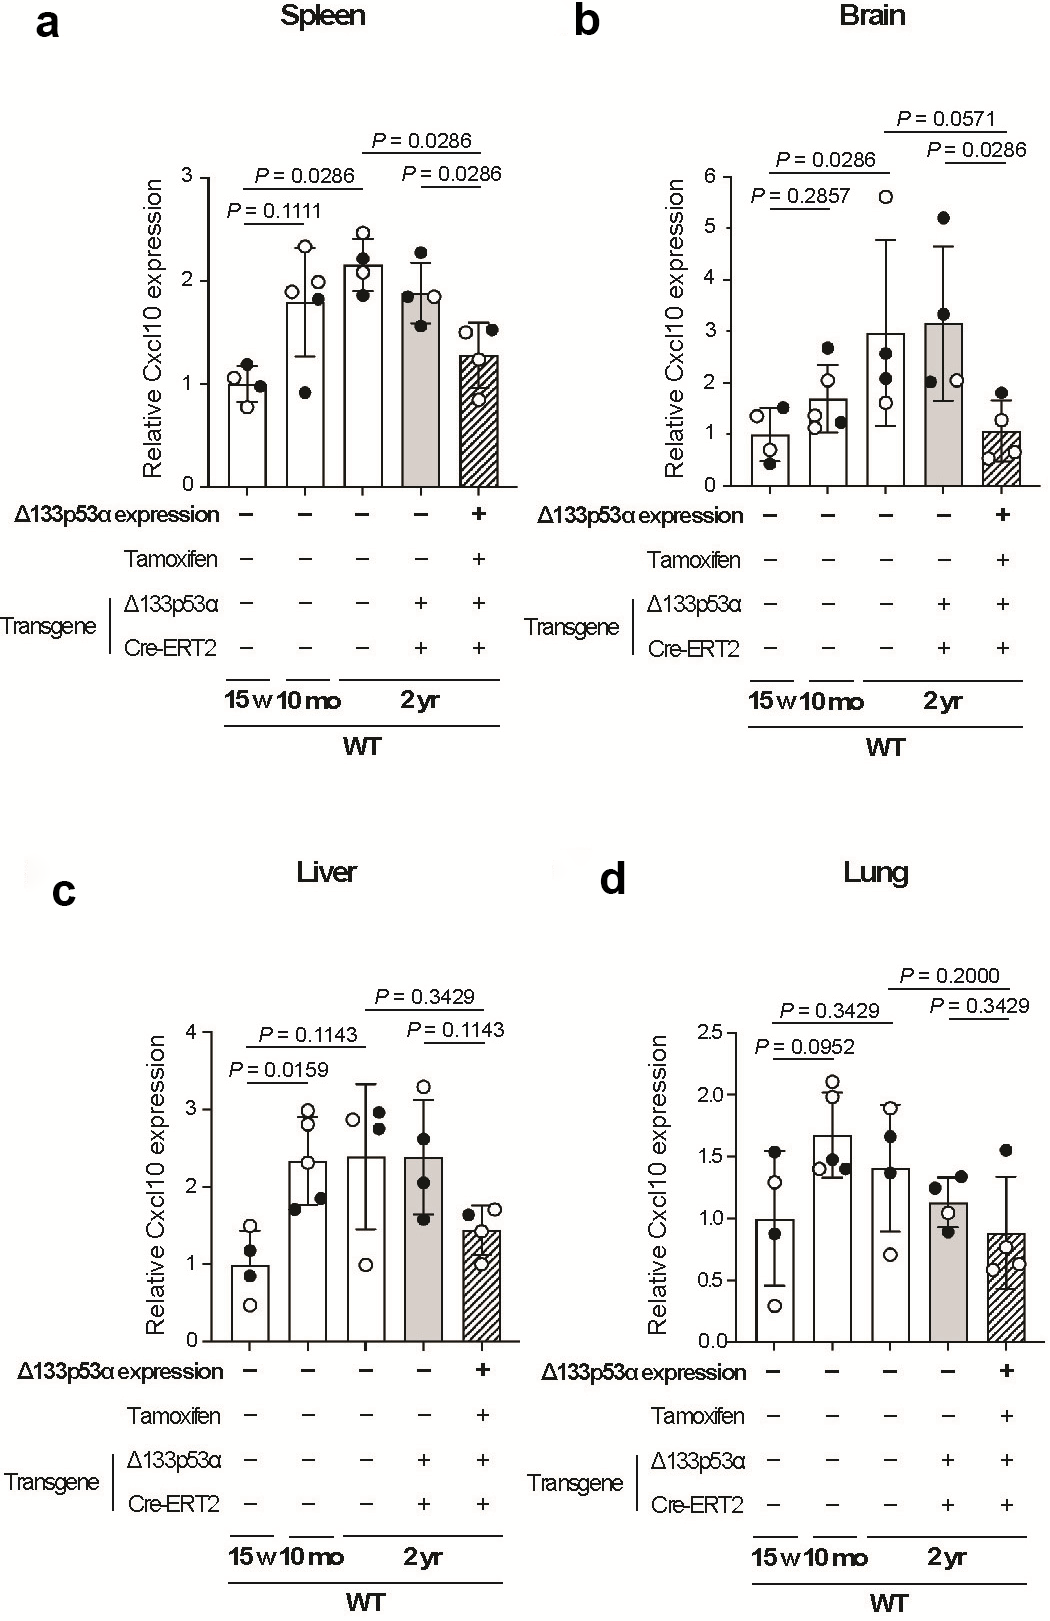
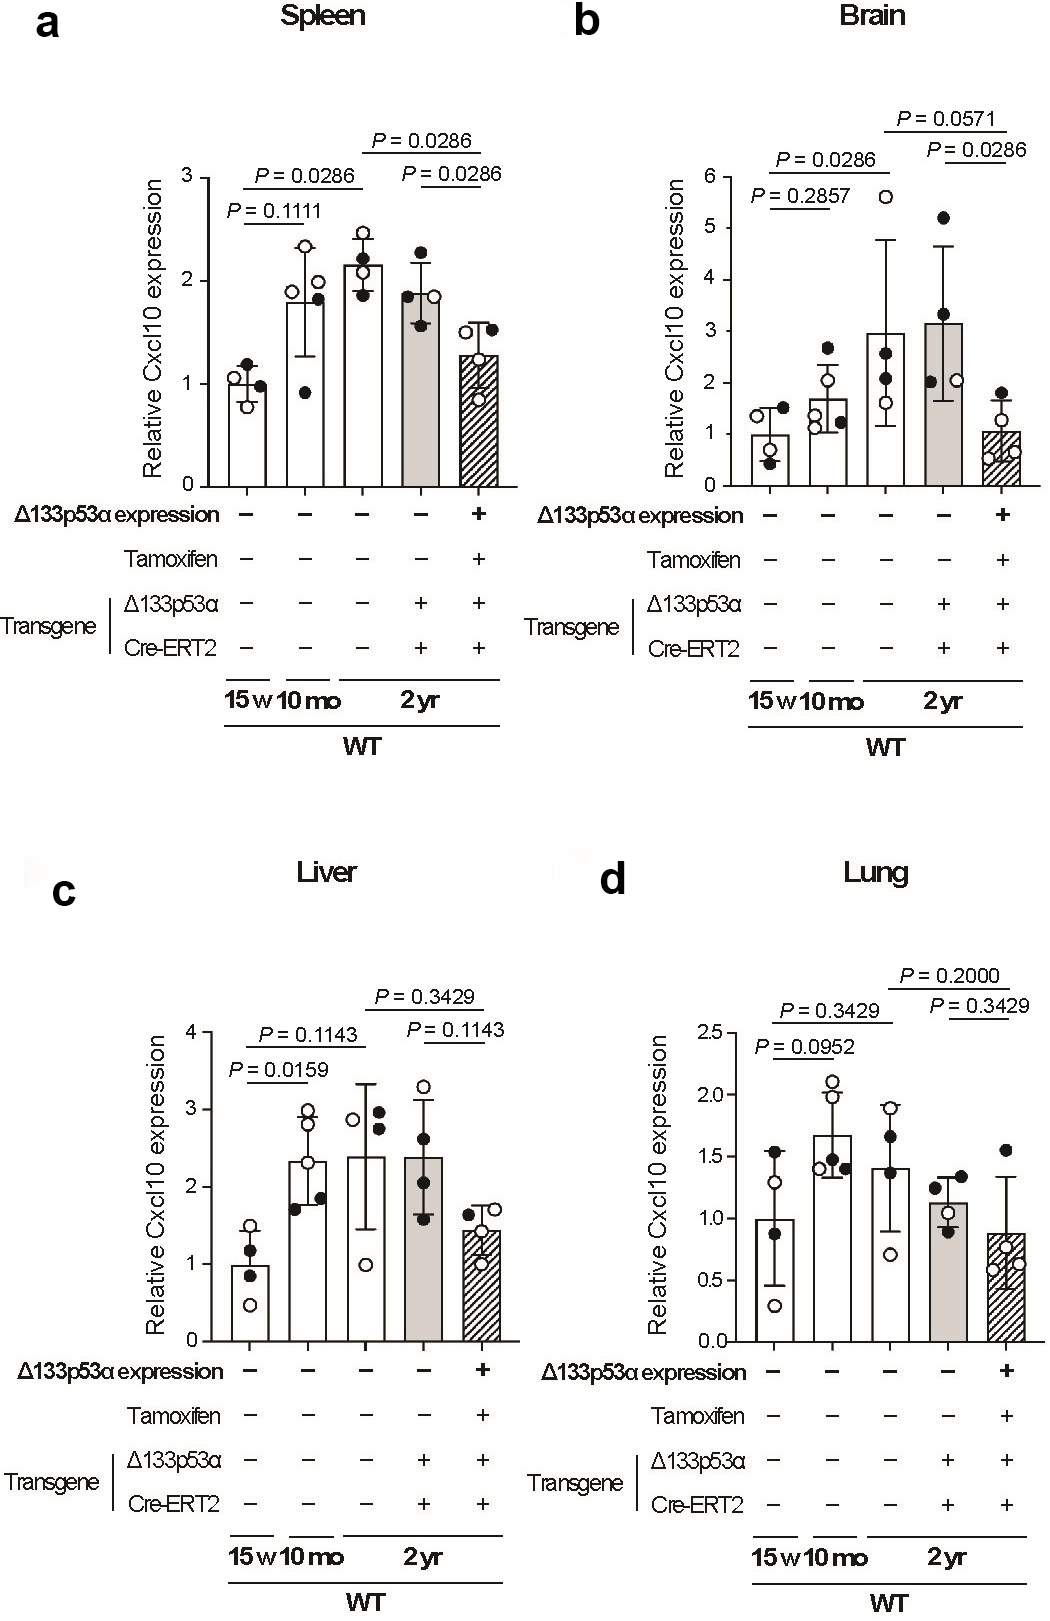
Figure 3. Δ133p53α represses Cxcl10 expression in the spleen and brain of naturally aged wild-type mice. Cxcl10 mRNA expression was analyzed by qRT-PCR in the spleen (a); brain (b); liver (c); lung (d) from three groups of 2-year-old WT mice: a Δ133p53α-expressing group and two non-expressing control groups (no-tamoxifen and no-transgene controls) (n = 4; open circles indicate females, and closed circles indicate males). WT mice at 15 weeks and 10 months of age are shown in parallel (same data as shown above in Figure 2). All data are presented relative to 15-week-old WT mice (mean ± s.d. from n = 4 or n = 5, each with technical triplicates). P-values were calculated using the Mann-Whitney U test. qRT-PCR: quantitative RT-PCR; WT: wild-type.
3.4 Δ133p53α expression in vitro represses Cxcl10/CXCL10
To perform an in vitro cell culture experiment with short-term expression of Δ133p53α, we established mouse embryonic fibroblasts (MEFs) from a wild-type mouse embryo carrying Δ133p53α and Cre-ERT2 transgenes. Retroviral expression of progerin significantly increased Cxcl10 mRNA levels in these MEFs (Figure 4a), recapitulating in vivo Cxcl10 increases observed in LmnaG609G/+ mice (Figure 2a,b,c). Induction of Δ133p53α expression by 4-OHT for 5 days was sufficient to reverse the progerin-induced increase in Cxcl10 (Figure 4a). In two human fibroblast strains derived from HGPS patients, lentiviral expression of Δ133p53α for 5 days also significantly repressed CXCL10 mRNA levels (Figure 4b). These findings, observed within 5 days in vitro, suggest that Δ133p53α-mediated repression of Cxcl10 can occur without requiring prolonged in vivo adaptation, although the underlying mechanism remains to be determined.
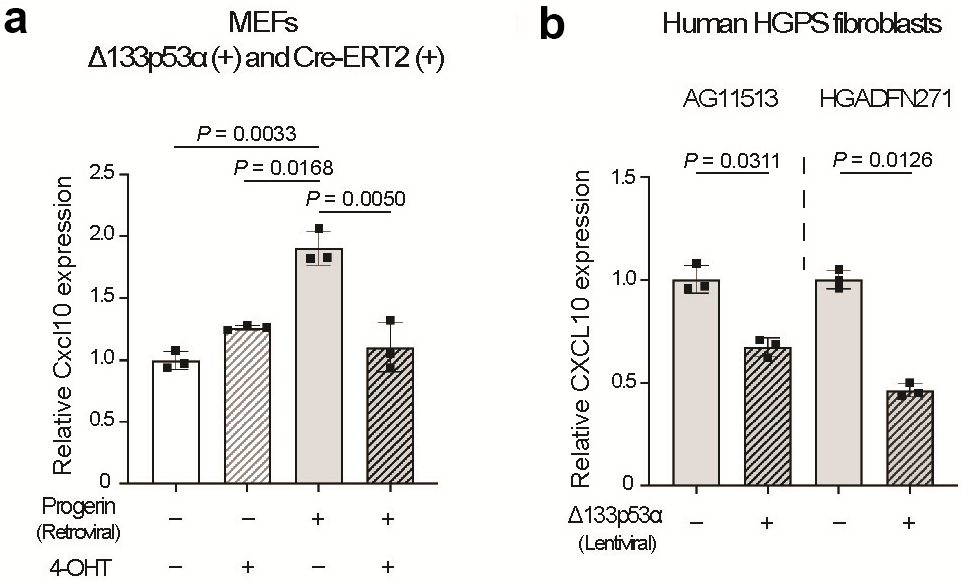
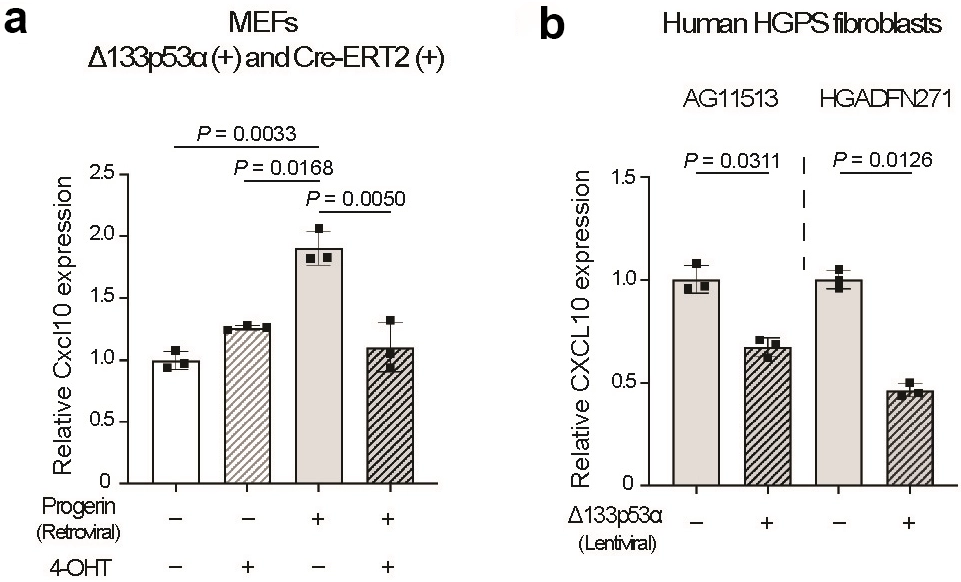
Figure 4. Δ133p53α expression in vitro represses Cxcl10/CXCL10. (A) Cxcl10 mRNA expression was analyzed by qRT-PCR in MEFs carrying both the Δ133p53α and Cre-ERT2 transgenes. Cells were retrovirally transduced with either the progerin expression vector (+) or the control vector (-), followed by treatment with (+) or without (-) 4-OHT to induce Δ133p53α expression for 5 days. Relative expression values to progerin (-)/4-OHT (-) cells are presented as mean ± s.d. (n = 3, biological triplicates, each technically triplicated). The similar Cxcl10 expression levels in progerin (-)/4-OHT (-) and progerin (-)/4-OHT (+) cells argue against a substantial nonspecific effect of 4-OHT or 4-OHT-induced Cre activation on Cxcl10 expression; (b) CXCL10 mRNA expression was analyzed by qRT-PCR in HGPS-derived fibroblasts, AG11513 and HGADFN271. Cells were transduced with either the lentiviral Δ133p53α expression vector (+) or the control lentiviral vector (-) for 5 days. Relative expression values to cells with the control vector (-) are presented as mean ± s.d. (n = 3, biological triplicates, each technically triplicated). P-values were calculated using the Welch’s t-test. qRT-PCR: quantitative RT-PCR; WT: wild-type; MEFs: mouse embryonic fibroblasts; 4-OHT: 4-hydroxytamoxifen.
3.5 RNA in situ hybridization visualizes Δ133p53α-mediated repression of Cxcl10 expression in the spleen and cerebellum.
To visualize Cxcl10 and Δ133p53α expression in tissues, spleen sections from 10-month-old Δ133p53α-expressing LmnaG609G/+ mice and age-matched non-expressing control mice (tamoxifen-injected, no-Δ133p53α control) were analyzed by RNAscope-based RNA in situ hybridization (Figure 5). As expected, positive signals for Δ133p53α mRNA (green) were observed only in Δ133p53α-expressing mice. Quantification of Cxcl10-positive signals (red) revealed significantly decreased Cxcl10 expression in Δ133p53α-expressing mice, compared with non-expressing controls (Figure 5, right). These results visually confirm the ELISA and qRT-PCR data demonstrating Δ133p53α-mediated repression of Cxcl10.
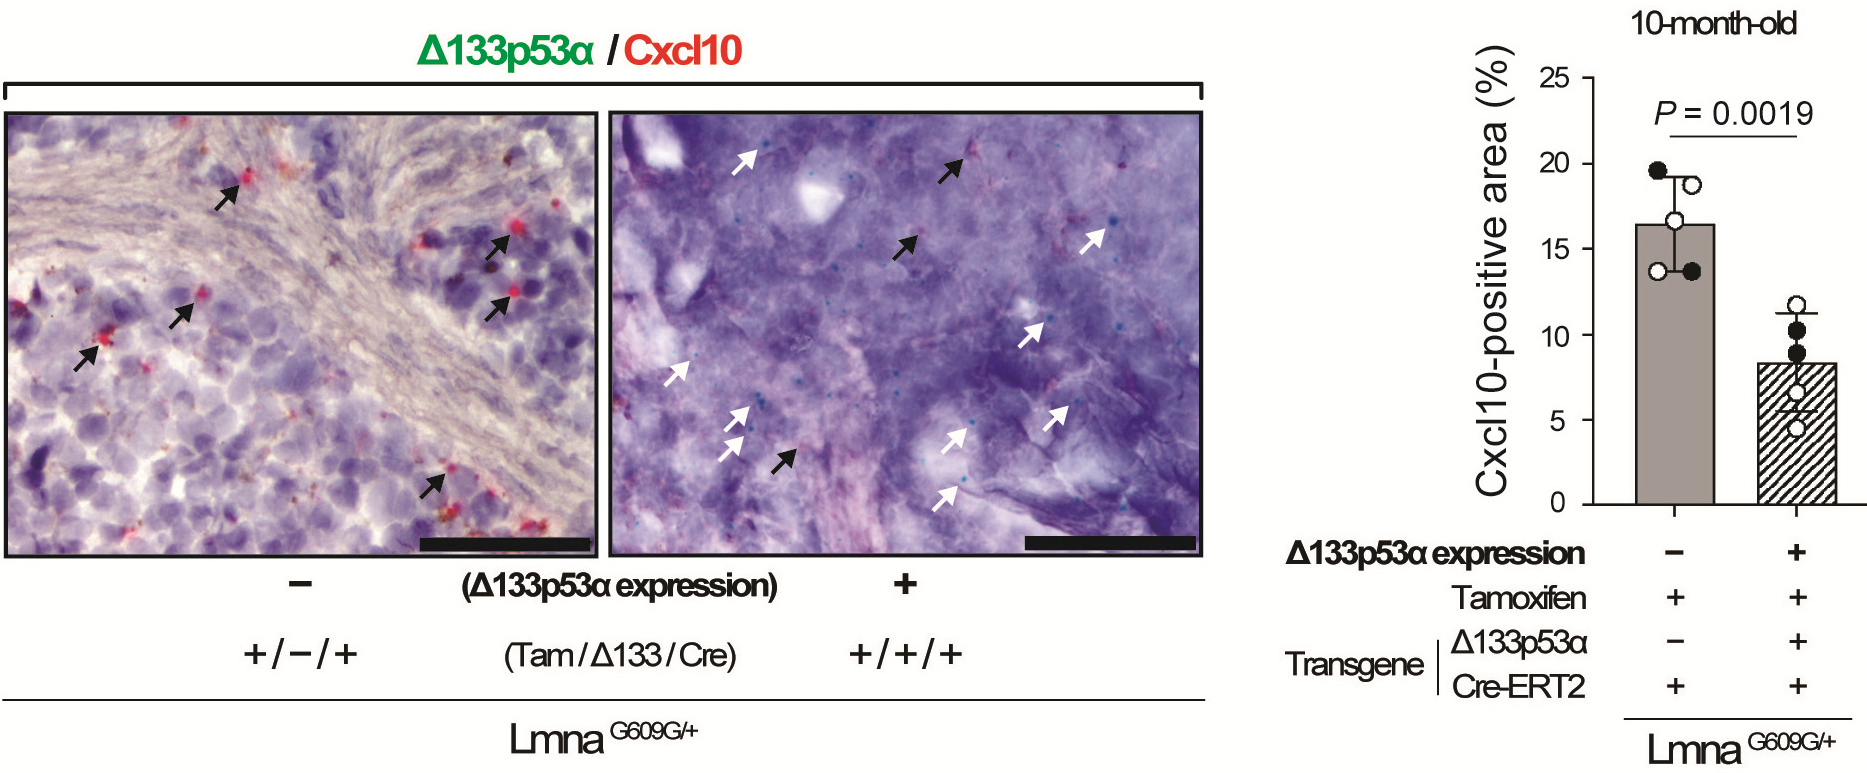
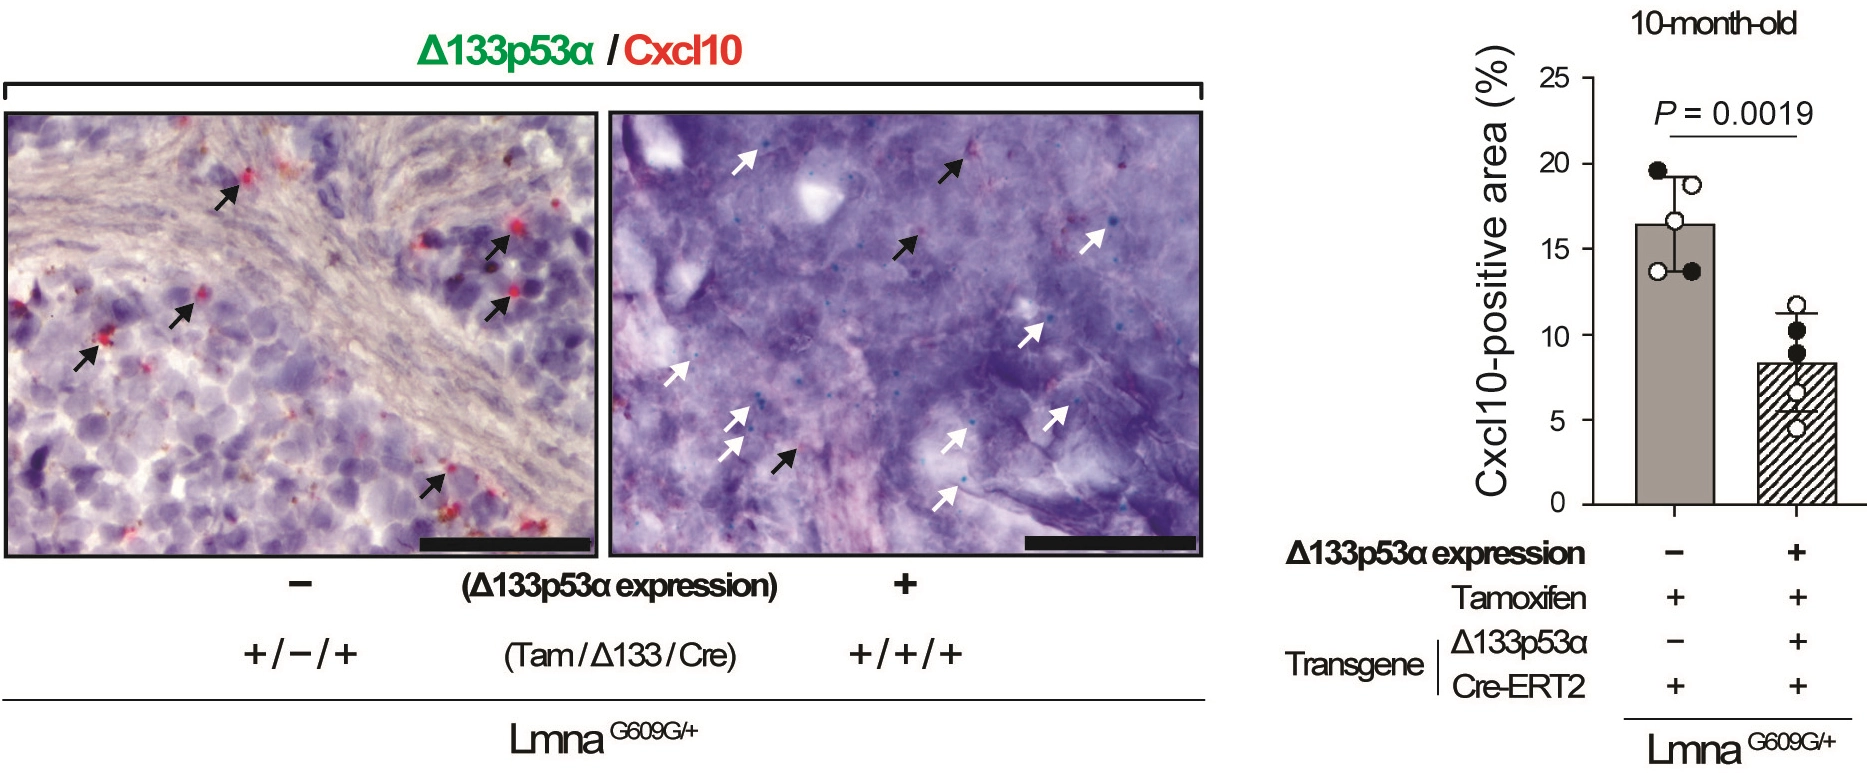
Figure 5. RNA in situ hybridization demonstrates that Δ133p53α represses Cxcl10 expression in the spleen of LmnaG609G/+ mice. Spleen sections from Δ133p53α-expressing LmnaG609G/+ mice (Tam/Δ133/Cre, +/+/+) and non-expressing controls (+/-/+) at 10 months of age were analyzed by BaseScope duplex in situ hybridization to simultaneously detect Cxcl10 mRNA (red) and Δ133p53α mRNA (green). Representative images are shown on the left. Representative Cxcl10 and Δ133p53α signals are indicated by black and white arrows, respectively. Note that Δ133p53α signals are present only in Δ133p53α-expressing mice (Tam/Δ133/Cre, +/+/+). Scale bars, 50 µm. On the right, quantitative data for Cxcl10 signals (% positive area) are presented as mean ± s.d. (n = 5; open circles indicate three females, and closed circles indicate two males). P-values were calculated using the Welch’s t-test.
Brain tissue sections from the same set of LmnaG609G/+ mice were also examined in this assay. In non-expressing control mice, whereas the cerebral cortex showed no or only sparse staining of Cxcl10 mRNA (images not shown), the cerebellum exhibited prominent Cxcl10 staining (Figure S2). Cxcl10-positive cell types and regions included: Purkinje neurons (Figure S2A, left), which are known to accumulate DNA damage with age[13]; the white matter (Figure S2B, left), where glial cells are vulnerable to aging-associated changes[14]; and the molecular layer (Figure S2C, left). In Δ133p53α-expressing mice, these cell types and regions were confirmed positive for Δ133p53α mRNA, accompanied by disappearance of Cxcl10-positive cells (Figure S2A,B,C, right).
3.6 CXCL10 expression is negatively correlated with Δ133p53α expression in human spleen tissues
The repression of Cxcl10 by Δ133p53α in mice led us to hypothesize that endogenous Δ133p53α expression may be associated with CXCL10 expression in humans. To test this hypothesis, we examined potential correlations between CXCL10 and Δ133p53α transcript levels using the human GTEx RNA-seq dataset. Among the eight tissues analyzed (aorta, brain, heart, kidney, liver, lower leg skin, suprapubic skin, and spleen), the spleen (n = 227) exhibited the most pronounced inverse correlation between the two transcripts (Spearman’s ρ = -0.224, P = 1.671 × 10⁻⁴; Figure 6, Table S2). Suprapubic skin (n = 650) also showed a significant inverse correlation (Spearman’s ρ = -0.140, P = 3.571 × 10⁻⁴; Table S2), whereas the other six tissues showed no significant correlation (Table S2). The finding in the human spleen is consistent with the results obtained in mice, in which the spleen most consistently and significantly exhibited Δ133p53α-mediated repression of Cxcl10 in both LmnaG609G/+ and wild-type mice (Figure 2 and Figure 3).
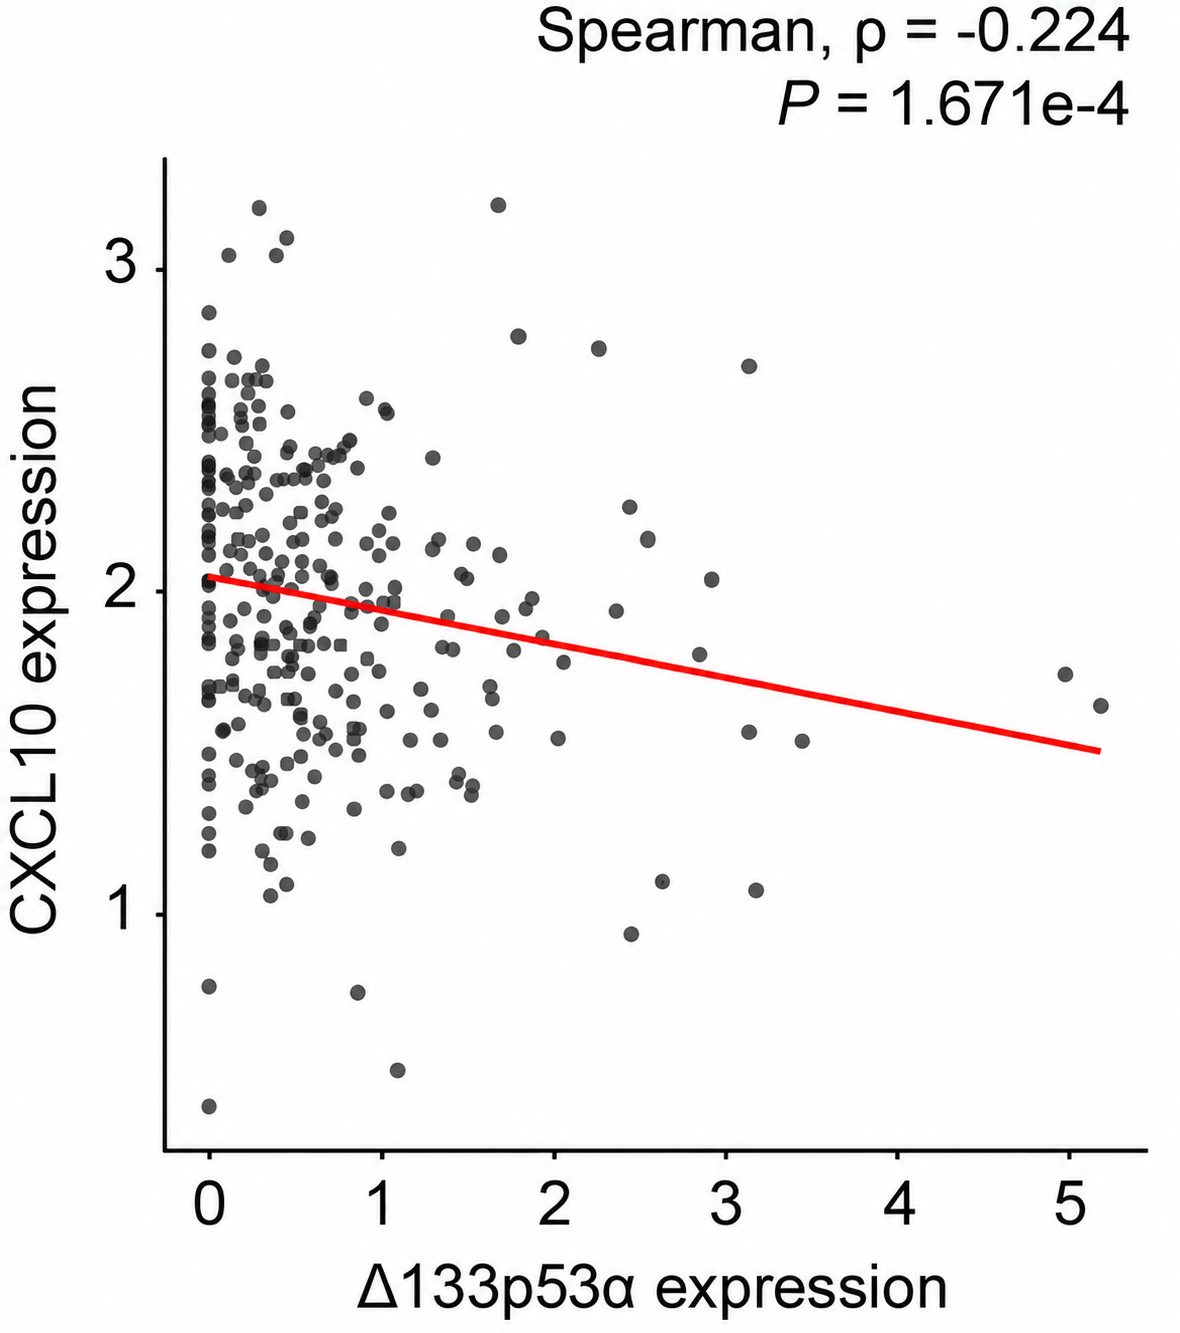
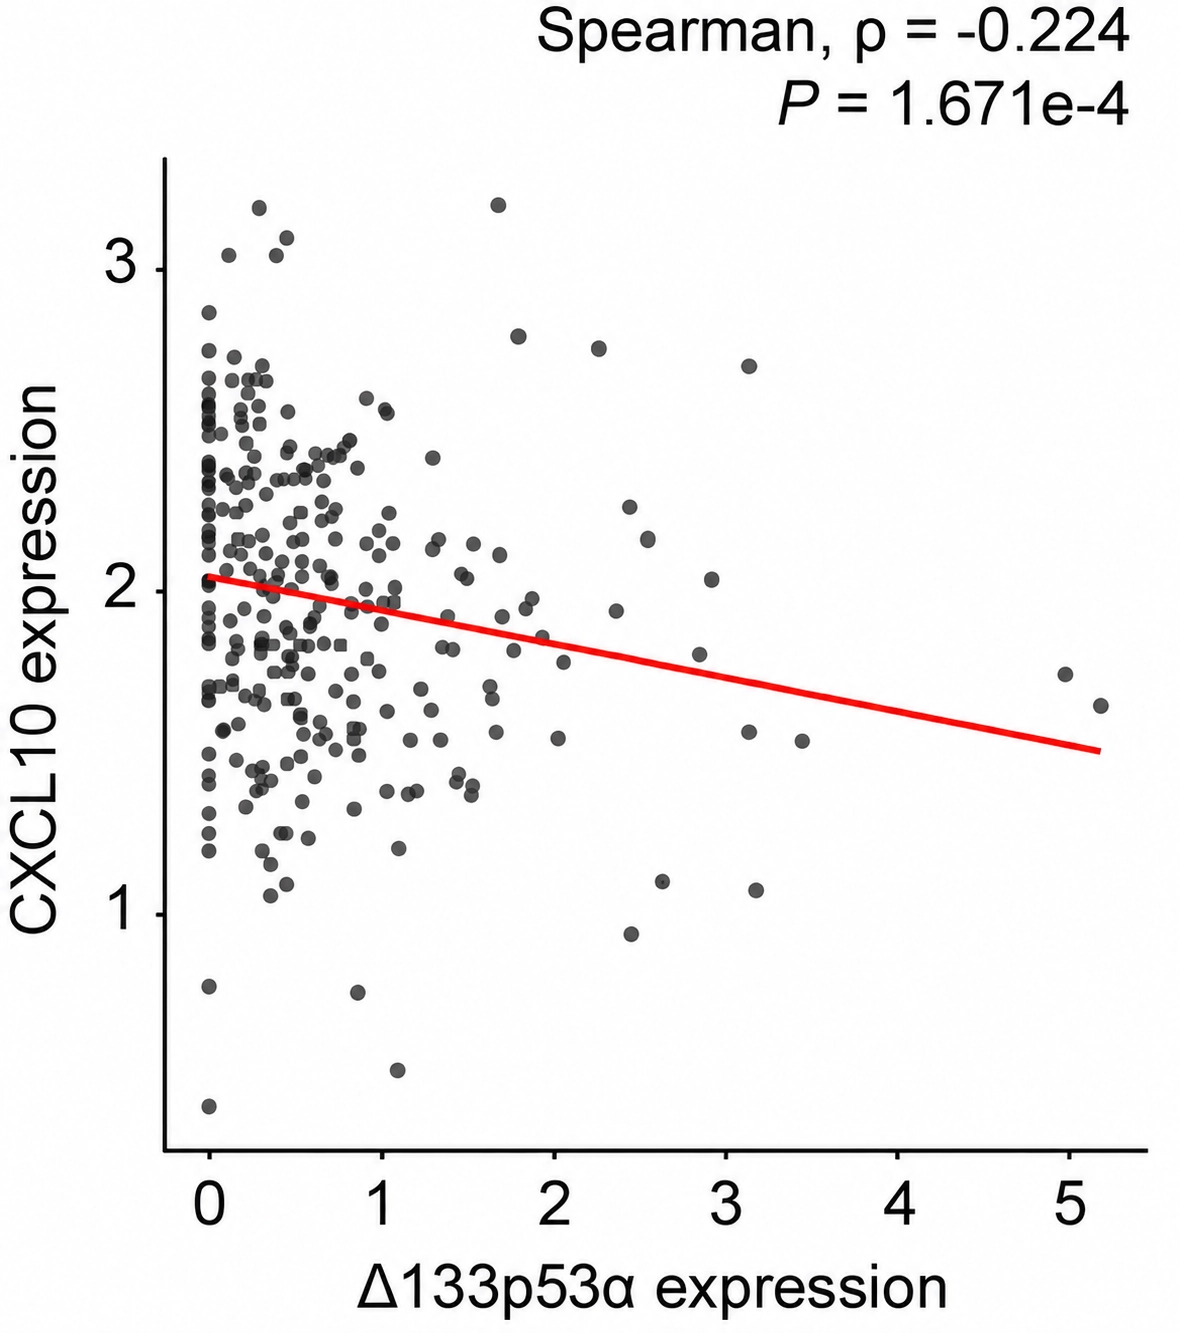
Figure 6. CXCL10 expression is inversely associated with Δ133p53α expression in human spleen tissues. CXCL10 and Δ133p53α expression levels in the spleen (n = 227) were obtained from analysis of the GTEx human RNA-seq dataset and are presented as log2(TPM + 1). Spearman’s rho and P value were calculated using the Spearman’s rank correlation test. TPM: transcripts per million; GTEx: Genotype-Tissue Expression.
After correction for the eight prespecified tissue comparisons in the human GTEx dataset analysis, the inverse correlations between CXCL10 and Δ133p53α remained significant in both the spleen (Benjamini-Hochberg-adjusted P = 0.00134) and suprapubic skin (Benjamini-Hochberg-adjusted P = 0.00143). When males and females were analyzed separately, the spleen showed significant inverse correlations in both males (n = 176, Spearman’s ρ = −0.207, P = 0.00593, Benjamini-Hochberg-adjusted P = 0.0474) and females (n = 101, Spearman’s ρ = -0.258, P = 0.00912, Benjamini-Hochberg-adjusted P = 0.0486). In suprapubic skin, inverse correlations were also observed in both males (n = 444, Spearman’s ρ = -0.131, P = 0.0058, Benjamini-Hochberg-adjusted P = 0.0474) and females (n = 206, Spearman’s ρ = -0.161, P = 0.0212, Benjamini-Hochberg-adjusted P = 0.0847), although the correlation in females was significant only at the nominal level.
4. Discussion
Among various cytokines involved in the senescence-associated secretory phenotype (SASP), IL-6 plays a primary role in systemic inflammation and accelerated aging phenotypes in progeria models and patients[6,10,15]. A multiplex serum cytokine/chemokine assay in this study suggested that serum IL-6 is elevated in LmnaG609G/+ progeria mice and repressed by transgenic expression of Δ133p53α (Figure 1a), which counteracts accelerated aging and extends lifespan in these mice[6]. This multiplex assay also suggested CXCL1, IL-1α, and CXCL10 as additional SASP factors potentially repressed by Δ133p53α (Figure 1b, Table S1). In previously reported inflammatory disease models, CXCL1 and IL-6 have been suggested to potentially regulate each other[16,17]. IL-1α is known to be an upstream activator of IL-6[18,19], although this has not been assessed in the context of progeria. This study for the first time provided an opportunity to investigate CXCL10 as a progeria-linked chemokine regulated by Δ133p53α.
Consistent with a progeria-associated increase and a Δ133p53α-mediated decrease in serum CXCL10 levels, tissue expression levels of Cxcl10 in the spleen, brain, and liver were elevated in LmnaG609G/+ progeria mice, compared with wild-type counterparts, and they were repressed back to wild-type levels by transgenic Δ133p53α expression (Figure 2a,b,c). Among these organs, we have shown that the spleen consistently exhibits increased Cxcl10 expression associated with both progeria and natural aging, as well as Δ133p53α-mediated repression of Cxcl10 expression (Figure 2a, Figure 3a, Figure 5, Figure 6, and Figure S1). While CXCL10, a ligand for the CXCR3 chemokine receptor, plays a physiological role in acute infectious and inflammatory responses[11,12], we hypothesize that its persistent production in these organs and elevated serum levels due to sustained stress, such as progeria-associated genotoxic stress, may act in concert with increased IL-6, CXCL1, and IL-1α to promote systemic inflammation.
Major pathological changes in progeria model mice and HGPS patients occur in the skin and the cardiovascular system including aorta[7,20], where our previous study demonstrated the anti-aging effect of Δ133p53α[6]. In contrast, such major changes are not observed in the spleen, brain, or liver, where we showed above that Δ133p53α represses Cxcl10. We speculate that CXCL10-mediated deleterious effects in these organs do not manifest during the shortened lifespan of progeria mice and patients but may appear later in normal lifespan. In the spleen and brain of wild-type mice, we found that Cxcl10 expression tends to increase with age and is significantly repressed at 2 years of age by transgenic Δ133p53α expression (Figure 3a,b). These findings support the physiological and therapeutic relevance of CXCL10 and its regulation by Δ133p53α in natural aging.
The dominant-negative activity of Δ133p53α against p53[2,3] may contribute to the Δ133p53α-mediated repression of Cxcl10 observed in the spleen, brain, and liver, similar to the Δ133p53α-mediated repression of p21Waf1/Cip1 observed in various tissues and cell types[2,3,6,15]. However, the molecular basis for the lack of progeria-associated or Δ133p53α-mediated changes in Cxcl10 expression in the lung (Figure 2d and Figure 3d) is currently unknown. Other limitations of this study include: i) Our primary expression analysis was performed at the mRNA level because this approach was considered to more directly reflect Cxcl10 production in each tissue than protein-level analysis, which may not fully capture the secreted protein fraction. However, protein-level assays would further strengthen our conclusions in future studies; ii) This study did not determine which cell types in each tissue expressed Cxcl10 or were subject to Δ133p53α-mediated repression of Cxcl10. Future studies will address this issue using single-cell omics approaches; and iii) To functionally validate the contribution of CXCL10 to Δ133p53α-induced phenotypes, CXCL10 blockade or inhibition will need to be performed in vitro and in vivo in combination with Δ133p53α expression.
Given our GTEx dataset analysis showing an inverse correlation between CXCL10 and Δ133p53α expression in the human spleen (Figure 6), Δ133p53α-mediated interventions to inhibit CXCL10 may warrant further exploration. We have initiated a study aimed at the pharmacological enhancement of Δ133p53α[21]. However, the study is still at the stage of using HGPS-derived fibroblasts, and its effect on CXCL10 remains to be investigated. In addition to the findings presented here, a large-scale database- and literature-based analysis[8] has proposed both CXCL10 and IL-6 as candidate components of a biomarker panel for frailty, an age-associated condition characterized by reduced physiological reserve and resilience. Combinatorial approaches targeting both CXCL10 and IL-6 are thus worth exploring.
5. Conclusion
CXCL10 is a proinflammatory chemokine that is elevated in both accelerated and natural aging and is repressed by the senescence-inhibitory p53 isoform Δ133p53α. The repression of CXCL10, along with IL-6, likely mediates the anti-inflammatory activity of Δ133p53α. CXCL10 may be further investigated in the context of senescence-associated and inflammatory diseases.
Supplementary materials
The supplementary material for this article is available at: Supplementary materials.
Acknowledgements
We thank Jessica Ebersole, Eleazar Vega-Valle, Morgan Whipp, Jacqueline Clem and Christine Perella for animal care and support. We also thank NCI-Frederick Molecular Histopathology Laboratory, Animal Diagnostic Laboratory, and CCR Genomics Core for their technical assistance and advice. The retroviral expression vector of progerin (pBABE-puro-GFP-progerin) was a gift from Tom Misteli through Addgene. This manuscript is dedicated to the memory of L.Y., who passed away unexpectedly before the publication of this work.
Authors contribution
Yamada L: Investigation, formal analysis, writing-review & editing.
Liu H: Formal analysis, writing-review & editing.
Harris CC: Conceptualization, funding acquisition, writing-review & editing.
Horikawa I: Conceptualization, methodology, formal analysis, writing-original draft, writing-review & editing.
All authors have read and approved the final version of the manuscript.
Conflicts of interest
The authors declare no conflicts of interest.
Ethical approval
All animal studies were approved by the Animal Care and Use Committee (ACUC) of the National Cancer Institute (NCI), Frederick, Maryland, under protocols ASP 25-264, ASP 24-466, and ASP 21-0212. All procedures involving animals, including housing and environmental enrichment, breeding, genotyping, the recognition and alleviation of pain and distress, the collection of tissues and blood, the application of humane endpoints, and euthanasia, were conducted in accordance with the ACUC guidelines (https://ncifrederick.cancer.gov/Lasp/ACUC/Frederick/GuidelinesFnl).
Consent to participate
Not applicable.
Consent for publication
Not applicable.
Availability of data and materials
All original data supporting the findings of this study are openly available in Figshare at https://doi.org/10.6084/m9.figshare.32827136. The Δ133p53α-transgenic mouse strain (CAG-LSL-Δ133p53α) is available from the Mutant Mouse Resource and Research Center (MMRRC: 075789-UNC). The lentiviral expression vector of Δ133p53α is available from Addgene (#241916). Others could be obtained from the corresponding authors.
Funding
This research was supported by the Intramural Research Program of the National Institutes of Health (NIH) (ZIA BC 011496). The contributions of the NIH authors were made as part of their official duties as NIH federal employees, are following agency policy requirements, and are considered Works of the United States Government. However, the findings and conclusions presented in this paper are those of the authors and do not necessarily reflect the views of the NIH or the U.S. Department of Health and Human Services.
Copyright
© The Author(s) 2026.
References
-
1. Levine AJ, Hainaut P. The TP53 gene contains a diversity box that makes it more than a tumor suppressor. Cell Death Differ. 2026.[DOI]
-
2. Fujita K, Mondal AM, Horikawa I, Nguyen GH, Kumamoto K, Sohn JJ, et al. p53 isoforms Δ133p53 and p53β are endogenous regulators of replicative cellular senescence. Nat Cell Biol. 2009;11(9):1135-1142.[DOI]
-
11. Groom JR, Luster AD. CXCR3 ligands: Redundant, collaborative and antagonistic functions. Immunol Cell Biol. 2011;89(2):207-215.[DOI]
-
15. Von Muhlinen N, Horikawa I, Alam F, Isogaya K, Lissa D, Vojtesek B, et al. p53 isoforms regulate premature aging in human cells. Oncogene. 2018;37(18):2379-2393.[DOI]
-
19. Orjalo AV, Bhaumik D, Gengler BK, Scott GK, Campisi J. Cell surface-bound IL-1α is an upstream regulator of the senescence-associated IL-6/IL-8 cytokine network. Proc Natl Acad Sci U S A. 2009;106(40):17031-17036.[DOI]
Copyright
© The Author(s) 2026. This is an Open Access article licensed under a Creative Commons Attribution 4.0 International License (https://creativecommons.org/licenses/by/4.0/), which permits unrestricted use, sharing, adaptation, distribution and reproduction in any medium or format, for any purpose, even commercially, as long as you give appropriate credit to the original author(s) and the source, provide a link to the Creative Commons license, and indicate if changes were made.
Publisher’s Note
Science Exploration remains a neutral stance on jurisdictional claims in published
maps
and institutional affiliations. The views expressed in this article are solely those
of
the author(s) and do not reflect the opinions of the Editors or the publisher.
Share And Cite


Science Exploration Style
Yamada L, Liu H, Harris CC, Horikawa I. The senescence-inhibitory p53 isoform Δ133p53α represses the proinflammatory chemokine CXCL10 in progeria model mice and naturally aged mice. Geromedicine. 2026;2:202627. https://doi.org/10.70401/Geromedicine.2026.0035
Tips
Copy completed.
Submit a Manuscript
Author Instructions
Cite this Article
Article Metrics
0
View
0
Download
Cited
Article Updates

 Get citation
Science Exploration Style

Yamada L, Liu H, Harris CC, Horikawa I. The senescence-inhibitory p53 isoform Δ133p53α represses the proinflammatory chemokine CXCL10 in progeria model mice and naturally aged mice. Geromedicine. 2026;2:202627. https://doi.org/10.70401/Geromedicine.2026.0035
copy
Share Link
copy