Combined normal and inverse barocaloric effect materials

Lingli Li

Haoyu Wang
Xiaoyan Fan
Yanxu Wang
Kun Zhang
Bing Li
*
*Correspondence to:
Bing Li, Shenyang National Laboratory for Materials Science, Institute of Metal Research, Chinese Academy of Sciences (IMR, CAS), Shenyang 110016, Liaoning, China.
E-mail: bingli@imr.ac.cn
Thermo-X. 2026;2:202628. 10.70401/tx.2026.0029
Received: June 12, 2026Accepted: August 20, 2026Published: August 20, 2026
Abstract
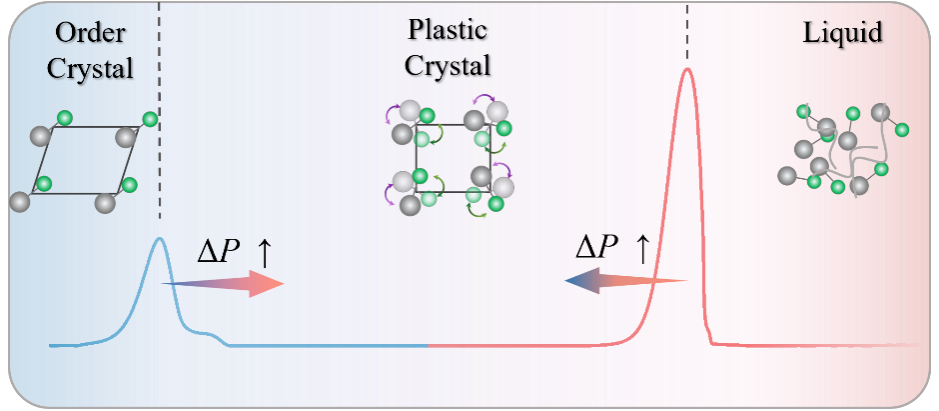
Barocaloric materials have attracted considerable attention as promising thermal-management alternatives to conventional vapour-compression technologies; however, virtually all reported systems exhibit only a single type of barocaloric effect (BCE), fundamentally constraining the functional versatility and accessible operating-temperature range of prospective devices. Here we report that two fluorinated alcohols, C9H6F14O2 (2OH) and C9H4F16O (1OH), harbour two mechanistically distinct phase transitions within a single material family: a solid-solid transition giving rise to a conventional normal BCE, and a solid-liquid transition yielding a rare inverse BCE. By systematically tuning the number of hydroxyl substituents (-OH), the transition temperatures of these two processes can be shifted by several tens of kelvin, enabling their natural alignment with distinct low- and high-temperature operating regimes. This intrinsic thermal property allows both heating and cooling functions to be realized within the same material system, solely through the exploitation of its barocaloric characteristics. Remarkably, 1OH exhibits exceptional pressure sensitivity during solid-liquid transition, reaching 0.34 K/MPa at 100 MPa. These findings establish fluorinated alcohols as a versatile and high-performance material platform, and open new avenues for the rational design of next-generation barocaloric energy conversion technologies.
Graphical Abstract
Keywords
Barocaloric effect, inverse barocaloric effect, solid-liquid phase transition, pressure sensitivity, fluoroalcohol
1. Introduction
With the increasing global concern over environmental protection and energy efficiency, finding alternatives to traditional vapor-compression thermal-energy management has become an important research direction in materials science[1-3]. Barocaloric materials have attracted significant attention due to their high efficiency, lack of greenhouse gas emissions, and excellent potential for miniaturization[4-6]. By applying or releasing pressure, this technology induces changes in multiple internal degrees of freedom within materials, generating substantial entropy changes that enable heat absorption and release[7-9]. Particularly, the colossal barocaloric effect (BCE) discovered in materials such as plastic crystals[4,10,11], organic ionic crystals[12-14], halide perovskites[15-18] and so on, where the isothermal entropy (ΔS) change can reach several hundred J/kg·K, comparable to commercial refrigerants, offering new possibilities for the practical application of thermal management.
Currently, most BCE materials display a normal barocaloric effect, in which pressure favours a denser, lower-entropy phase[4,11,13,19-25]. Consequently, compression releases heat and decompression produces cooling. In contrast, an inverse BCE arises when pressure stabilizes a higher-entropy phase, leading to heat absorption upon compression and heat release upon decompression. Representative inverse BCEs have been observed in BaTiO3[26], (NH4)2SO4[27], NH4SCN[28], and ice during its solid-liquid (S-L) phase transition[29]. Realizing both normal and inverse BCE in the same material would allow switching between cooling and heating modes in a single device under different temperature windows.
Previous studies of long-chain alkanes, such as C17H36[30], show that multiple solid-solid (S-S) and S-L transitions can produce enhanced normal BCEs when their pressure-induced transition ranges overlap. However, because these transitions have the same normal sign, they cannot enable reversible switching between opposite thermal responses. Molecular materials that naturally possess multiple, suitably spaced phase transitions may instead provide a route to integrate normal and inverse BCEs within a single compound. Such materials could potentially support pressure-programmable cooling, heat-release, and thermal-storage functions, offering opportunities for multifunctional thermal-management architectures.
Against this background, the present work reports a new class of functional materials, two fluoroalcohols, C9H6F14O2 (2OH) and C9H4F16O (1OH), that simultaneously exhibit a normal S-S BCE and a rare inverse S-L BCE. By systematically investigating the normal and inverse thermodynamic behaviors associated with pressure-induced phase transitions, we evaluate the potential performance of these materials under in situ pressurization conditions and elucidate the underlying phase transition mechanisms. This study not only deepens the fundamental physical understanding of BCE but also establishes a new materials platform and design strategy for developing next-generation, highly efficient, and controllable thermal management technologies.
2. Experimental Section
2.1 Sample preparation
The C9H6F14O2 (2OH, ≥ 90% purity) and C9H4F16O (1OH, ≥ 97% purity) were commercially available from Aladdin Inc. The raw materials were used as received from the suppliers without any further purification.
2.2 High-pressure differential scanning calorimetry
Heat flow data at ambient pressure were collected using a differential scanning calorimeter (NETZSCH DSC 200F3 for scans at 10 K/min). Pressure-dependent heat flow measurements were performed using a high-pressure differential scanning calorimeter (μDSC 7, Setaram). Powder samples were sealed in a high-pressure vessel made of Hastelloy, while an empty vessel served as the reference. The scanning rate was 1 K/min. Hydrostatic pressure was controlled by adjusting argon gas pressure, and measurements were conducted over a temperature range of 220-390 K under various constant pressures. The phase transition temperature Tt was defined as the temperature corresponding to the peak of the heat flow signal. To calculate the entropy change under constant pressure, the baseline-subtracted heat flow Q(P, T) was integrated over the temperature interval from T1 to T2.
where T' is the temperature ramping rate[19,31]. Moreover, the heat flow data of 2OH and 1OH under different high-pressure were collected. Constant pressure scans were performed on them at 0.1, 20, 40, 60, 80, and 100 MPa at a rate of 1 K/min. Hence, the pressure-induced entropy changes for the pressure change from the ambient (P0) to the applied pressure (P) were calculated as
2.3 Powder X‑ray diffraction (PXRD)
Variable-temperature PXRD patterns between 180 and 360 K were collected by a Rigaku Smartlab diffractometer. All the diffraction patterns were collected in the 2θ range of 4-48° with a step size of 0.02°. Room temperature data was collected on a Rigaku SmartLab (9 kW) with a scan rate of 1 º/min and a step size of 0.01°. The resulting data were analyzed by Le Bail fitting in JANA2006 software[32].
2.4 Raman spectroscopy
Temperature- and pressure-dependent Raman spectra were collected using an in-situ Raman spectrometer (LabRAM HR Evolution, Horiba) equipped with a 4He cryostat (S-300, Physike) and a diamond anvil cell (CryoDAC Tesla, ALmax easylab). 633- and 532-nm lasers were used as the excitation source. The diamond anvil cell was employed to apply pressure to the sample while maintaining a constant temperature in the range of 200-400 K. The pressure was determined via the ruby fluorescence method, with an uncertainty of approximately 50 MPa in the studied pressure range[33]. All Raman data were processed using LabSpec6 software.
3. Results and Discussion
3.1 Phase transitions and structure characterization
BCE exploiting pressure-driven phase transitions demonstrates remarkable performance as a basis for solid-state refrigeration and thermal energy storage: under applied pressures of 100 MPa, Tt are typically shifted by more than ten kelvin[10,30,34]. Nevertheless, because all such materials rely on a single type of phase transition (S-S or S-L), their functional scope remains inherently constrained, limiting their deployment in multifunctional or wide-temperature-range applications.
This limitation naturally raises the question of whether normal and inverse BCEs can be made to coexist within a single material, thereby enabling both active heating and active cooling across distinct temperature regimes. Guided by this reasoning, we identified two structurally related perfluorinated alcohols, 2OH and 1OH, that contain precisely these dual characters: a conventional normal BCE associated with a S-S transition, and a rare inverse BCE arising from a S-L transition, coexisting within the same molecular family.
The molecular architectures of the two compounds are illustrated in Figure 1a. Both feature carbon backbones in which the majority of hydrogen atoms are substituted by fluorine, with the key structural distinction being the number of terminal hydroxyl groups: two (-OH) in 2OH and one in 1OH. This difference in hydroxyl content profoundly modifies the intermolecular hydrogen-bonding environment, giving rise to markedly different Tt (Figure 1b). For 2OH, the S-S and S-L transitions occur at 342/302 K and 390/385 K (heating/cooling), respectively. In contrast, 1OH exhibits both transitions at substantially reduced temperatures of 250/226 K (S-S) and 333/323 K (S-L), representing a downward shift of several tens of kelvin relative to 2OH. The pronounced thermal hysteresis of ΔThys ~40 K for 2OH and ~24 K in S-S phase transitions for 1OH indicate the first-order nature of this phase transition, while restricting the operating-temperature window and performance. The substantial difference in transition temperatures also suggests that the pressure sensitivity of the phase transitions may differ considerably between the two materials, due to the change in the hydrogen bond environment.
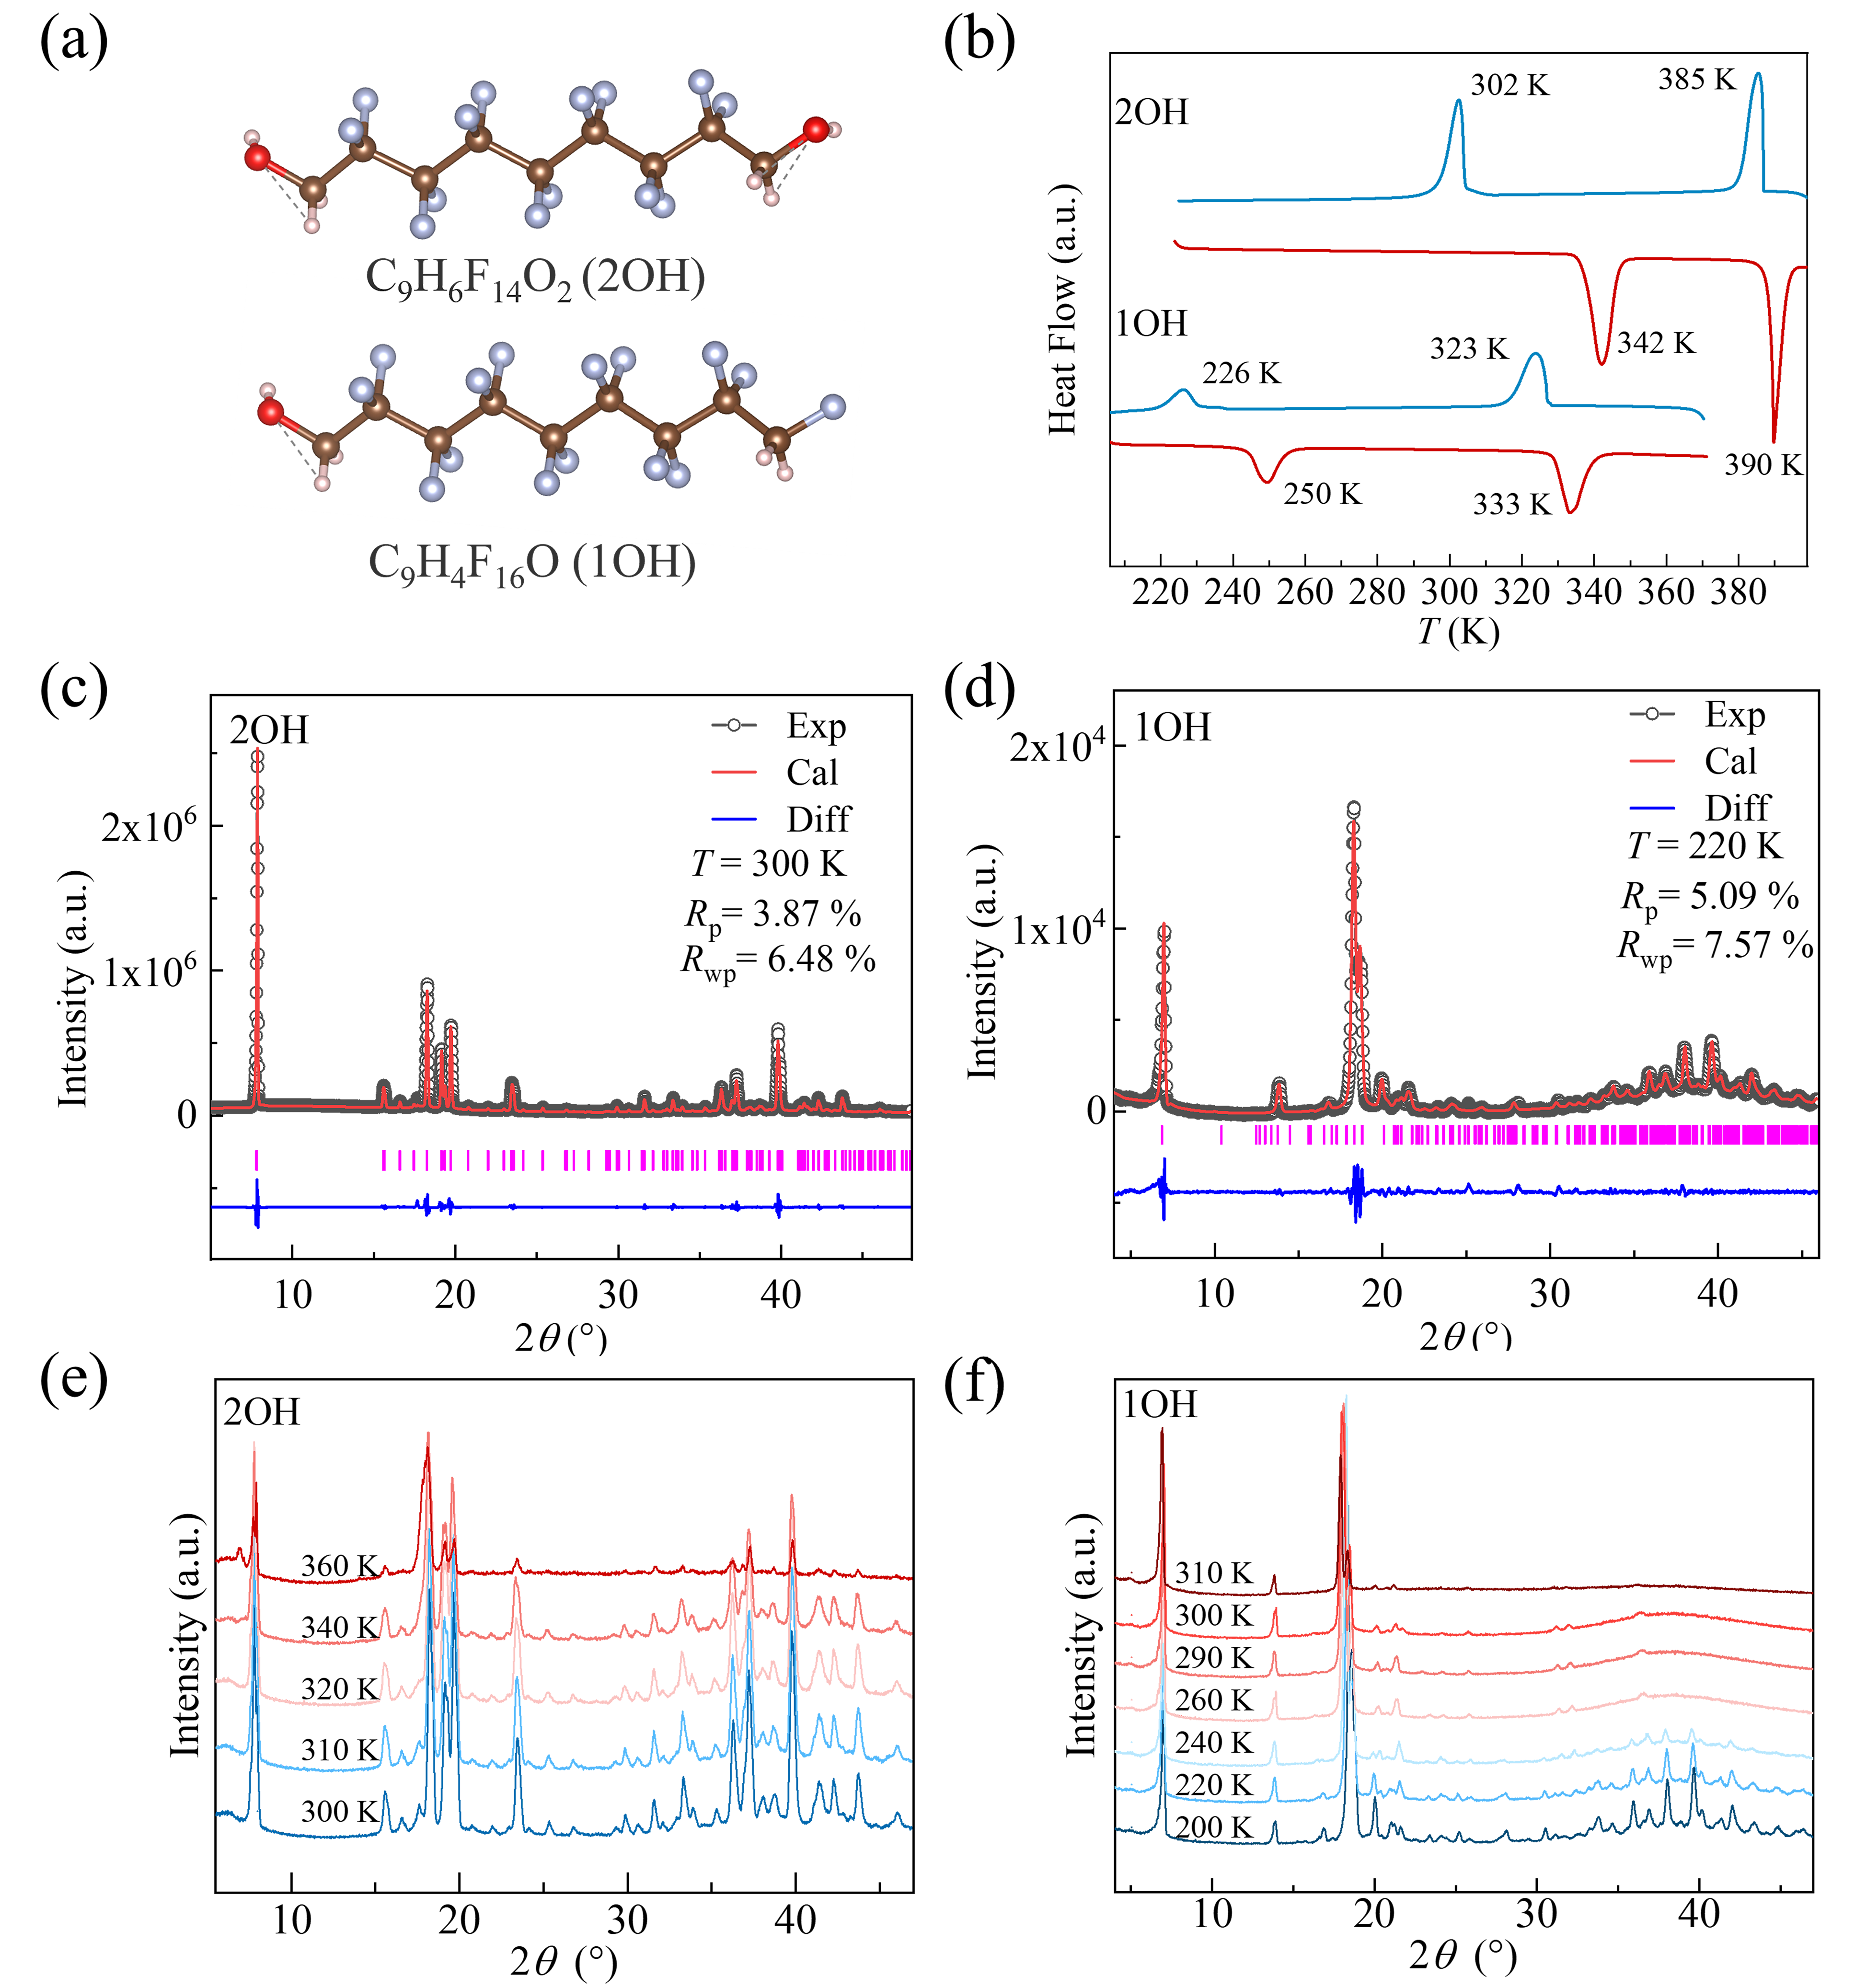
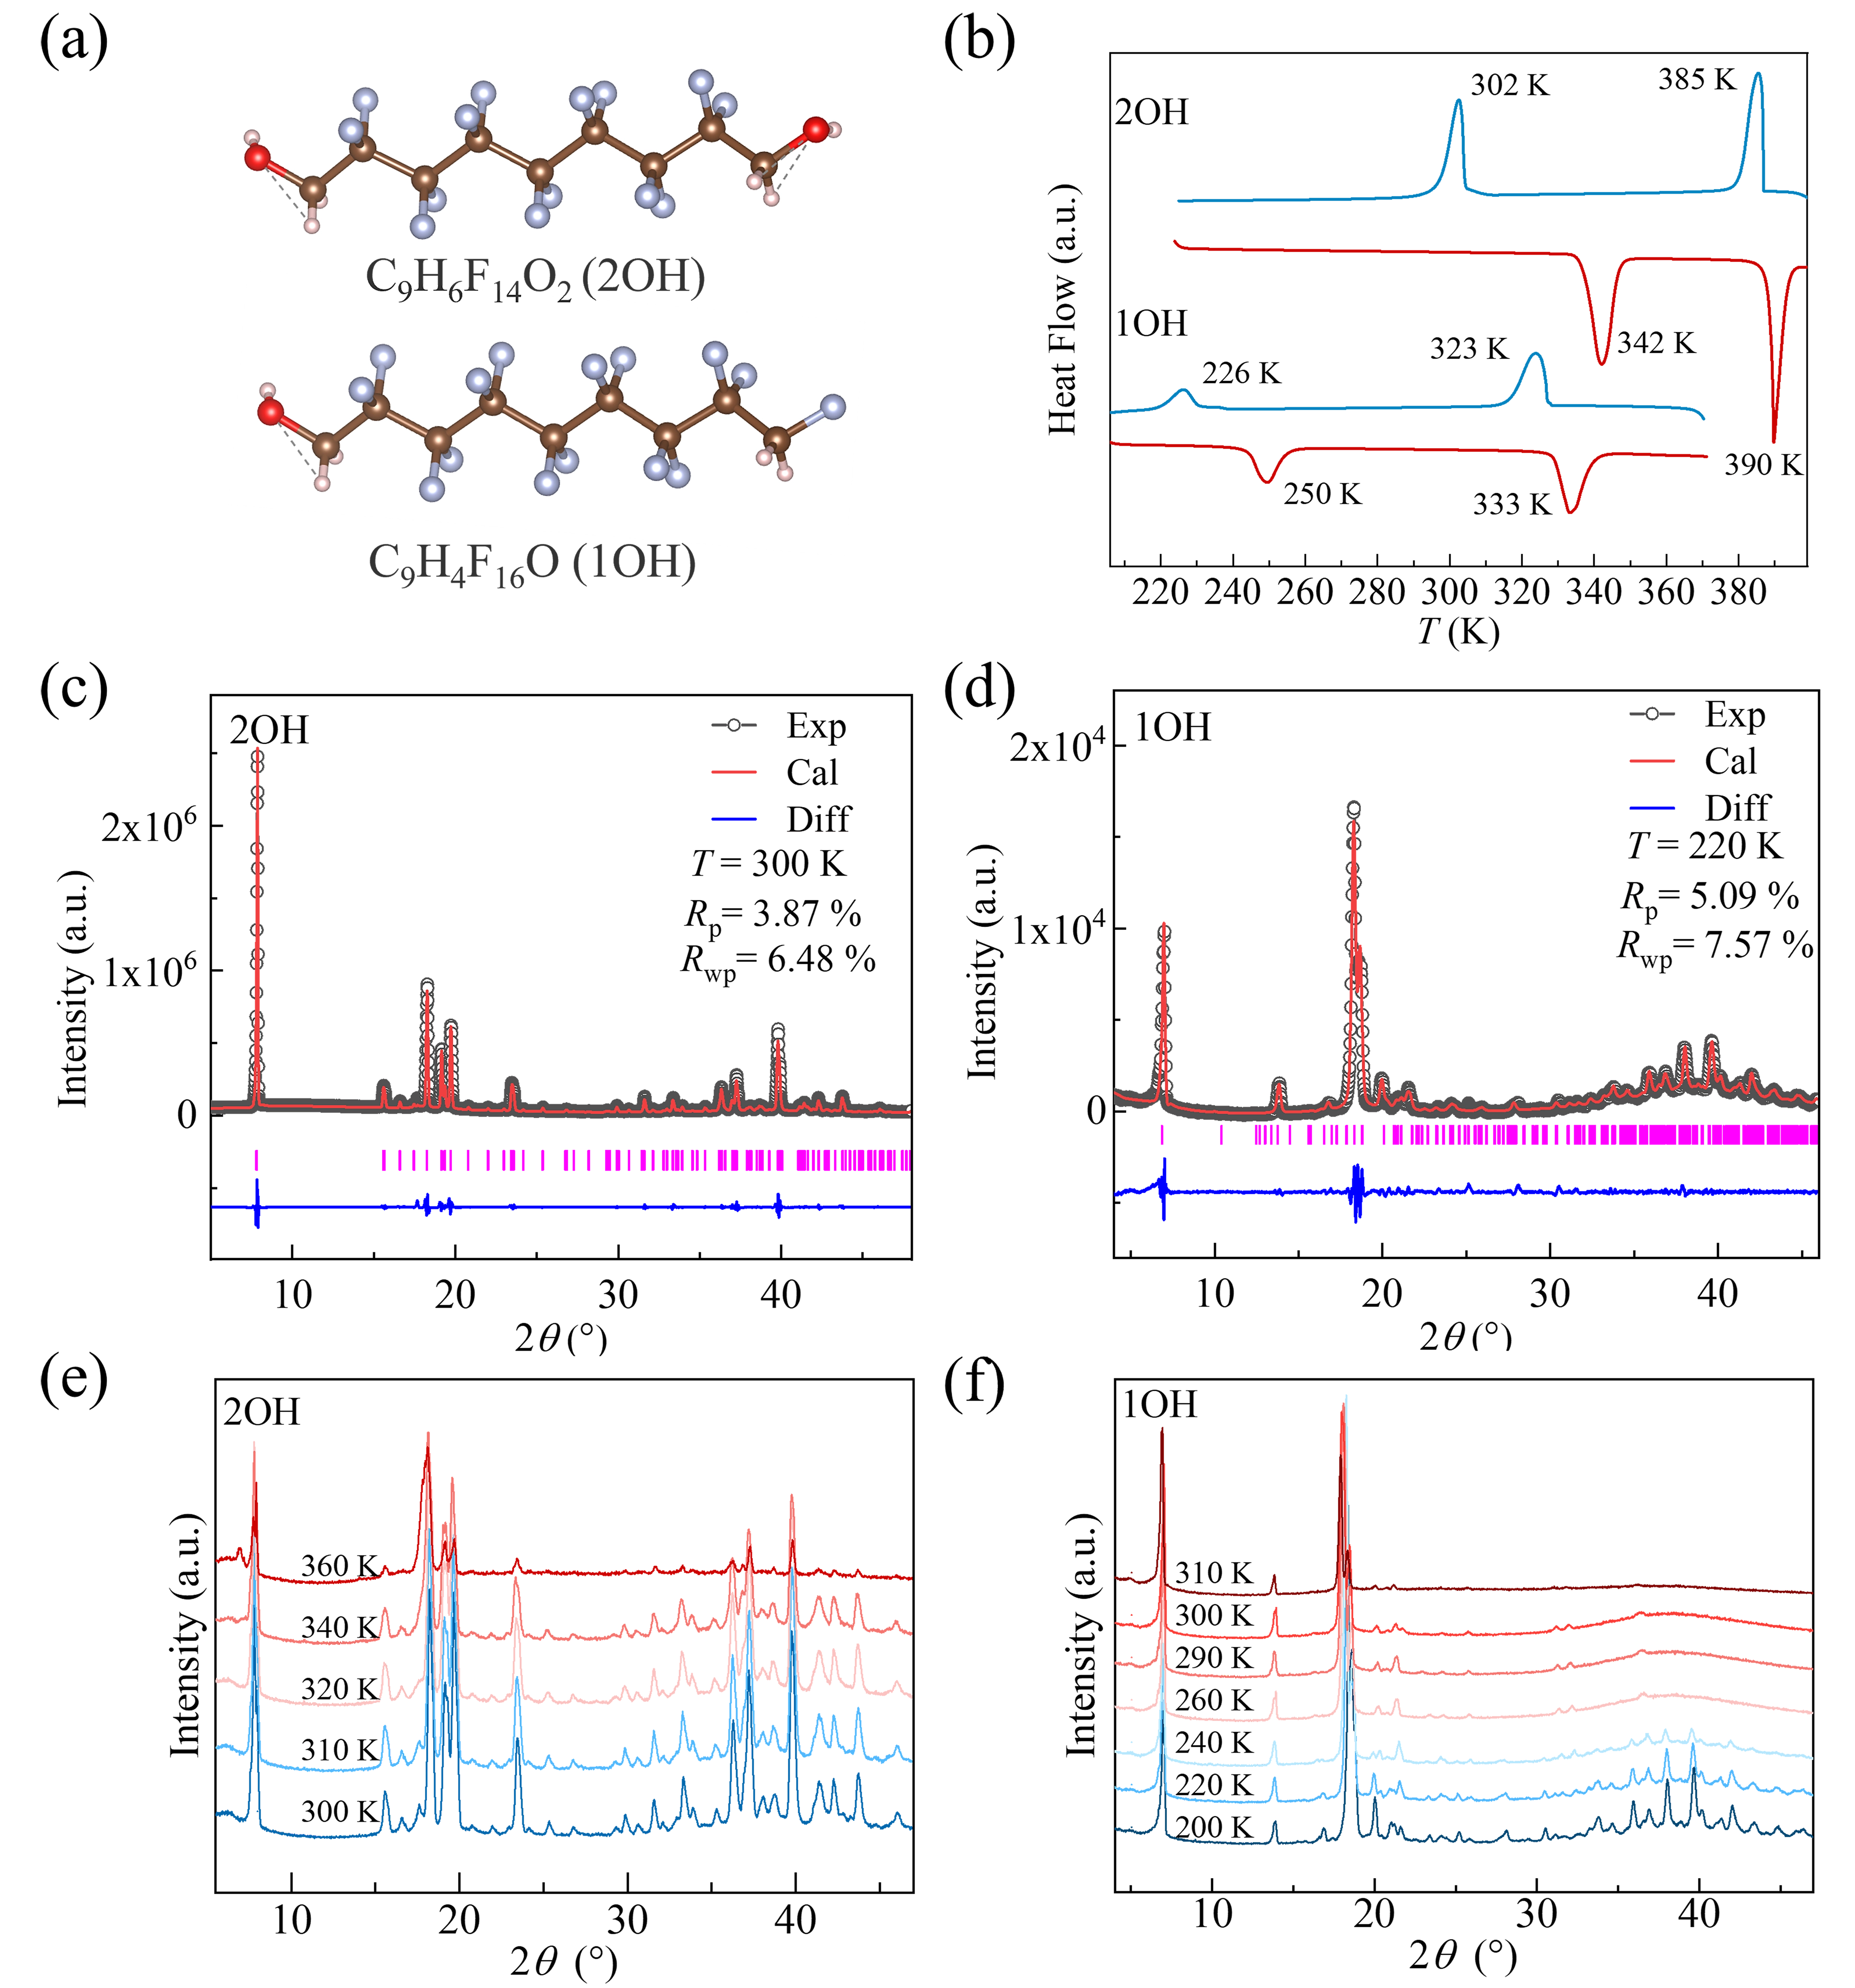
Figure 1. Phase transition behavior and structural characterization of 2OH and 1OH. (a,b) Schematic illustrations of the molecular structures and corresponding DSC thermograms measured at ambient pressure. The XRD pattern refinements for (c) 2OH at 300 K and (d) 1OH at 220 K. Temperature-dependent PXRD patterns for (e) 2OH and (f) 1OH, highlighting the structural evolution across different phase states. PXRD: powder X-ray diffraction; DSC: differential scanning calorimetry; XRD: X-ray diffraction.
To elucidate the structural phases of both compounds, we performed variable-temperature PXRD measurements. At room temperature, 2OH adopts an ordered monoclinic crystal structure with space group Pc[35], and the experimental diffraction pattern is in excellent agreement with the theoretically calculated profile, as confirmed by Rietveld refinement at 300 K with a scan rate of 1 º/min(Figure 1c). In contrast, 1OH is hard to grow as a well-ordered single crystal, precluding direct structural determination by conventional crystallographic methods. Given the close structural analogy between the two molecules, a similar crystal structure is anticipated. However, the reported refinement is preliminary and requires confirmation by single-crystal X-ray diffraction or complementary structural methods. The absence of one hydroxyl group in 1OH weakens the intermolecular hydrogen-bonding network relative to 2OH, which is reflected in the larger unit cell: refinement of the 1OH diffraction pattern was performed using the same monoclinic lattice structure but with a unit cell of approximately twice the volume (a = 13.93 Å, b = 8.93 Å, c = 13.28 Å, β = 112.38 °) compared to that of 2OH (a = 12.15 Å, b = 5.08 Å, c = 11.47 Å, β = 111.19 °). The refinement profile obtained from this approach was reasonable (Figure 1d), indicating that the proposed structural model provides an approximation of the true crystal structure of 1OH.
Temperature-dependent PXRD patterns of 2OH reveal a pronounced broadening of diffraction peaks upon heating above 340 K, indicative of a transition from a long-range-ordered crystal phase to a dynamically disordered plastic crystal phase (Figure 1e). Analogously, as shown in Figure 1f, upon heating towards 260 K, the diffraction patterns of 1OH exhibit a marked reduction in the number of resolvable reflections accompanied by significant peak broadening, which is equally consistent with the onset of a plastic crystal phase. The small difference in Tt is due to certain variations in the temperature control system. Taken together, these observations establish that both compounds undergo order-disorder phase transitions into plastic crystal states, a structural characteristic that is intimately linked to their BCE behaviour.
3.2 Evaluation of BCEs
To directly quantify the BCE performance of both compounds, high-pressure differential scanning calorimetry was employed to characterize the BCE of the two fluoroalcohols across a temperature range of 230-390 K under a series of constant applied pressures. In the two materials, we simultaneously observed that the S-S transition point shifts uniformly with pressure (normal BCE), while the S-L transition point decreases non-linearly (inverse BCE), a phenomenon that may be related to the intrinsic nature of the transitions.
Based on the heat flow curves of 2OH (Figure 2a), the isobaric entropy change ΔSt at the phase transitions was obtained, along with the pressure-induced entropy change ΔSP→P0 (Figure 2b), where P0 denotes ambient pressure and P the applied pressure, following the notation established in previous reports[4,36]. For 2OH, the saturated values of ΔSP→P0 during cooling/heating reach approximately 164.3/153.1 J/kg·K (S-S) and 109.3/103.5 J/kg·K (S-L), both attained at a modest driving pressure of only 40 MPa, underscoring the high-pressure efficiency of this material.
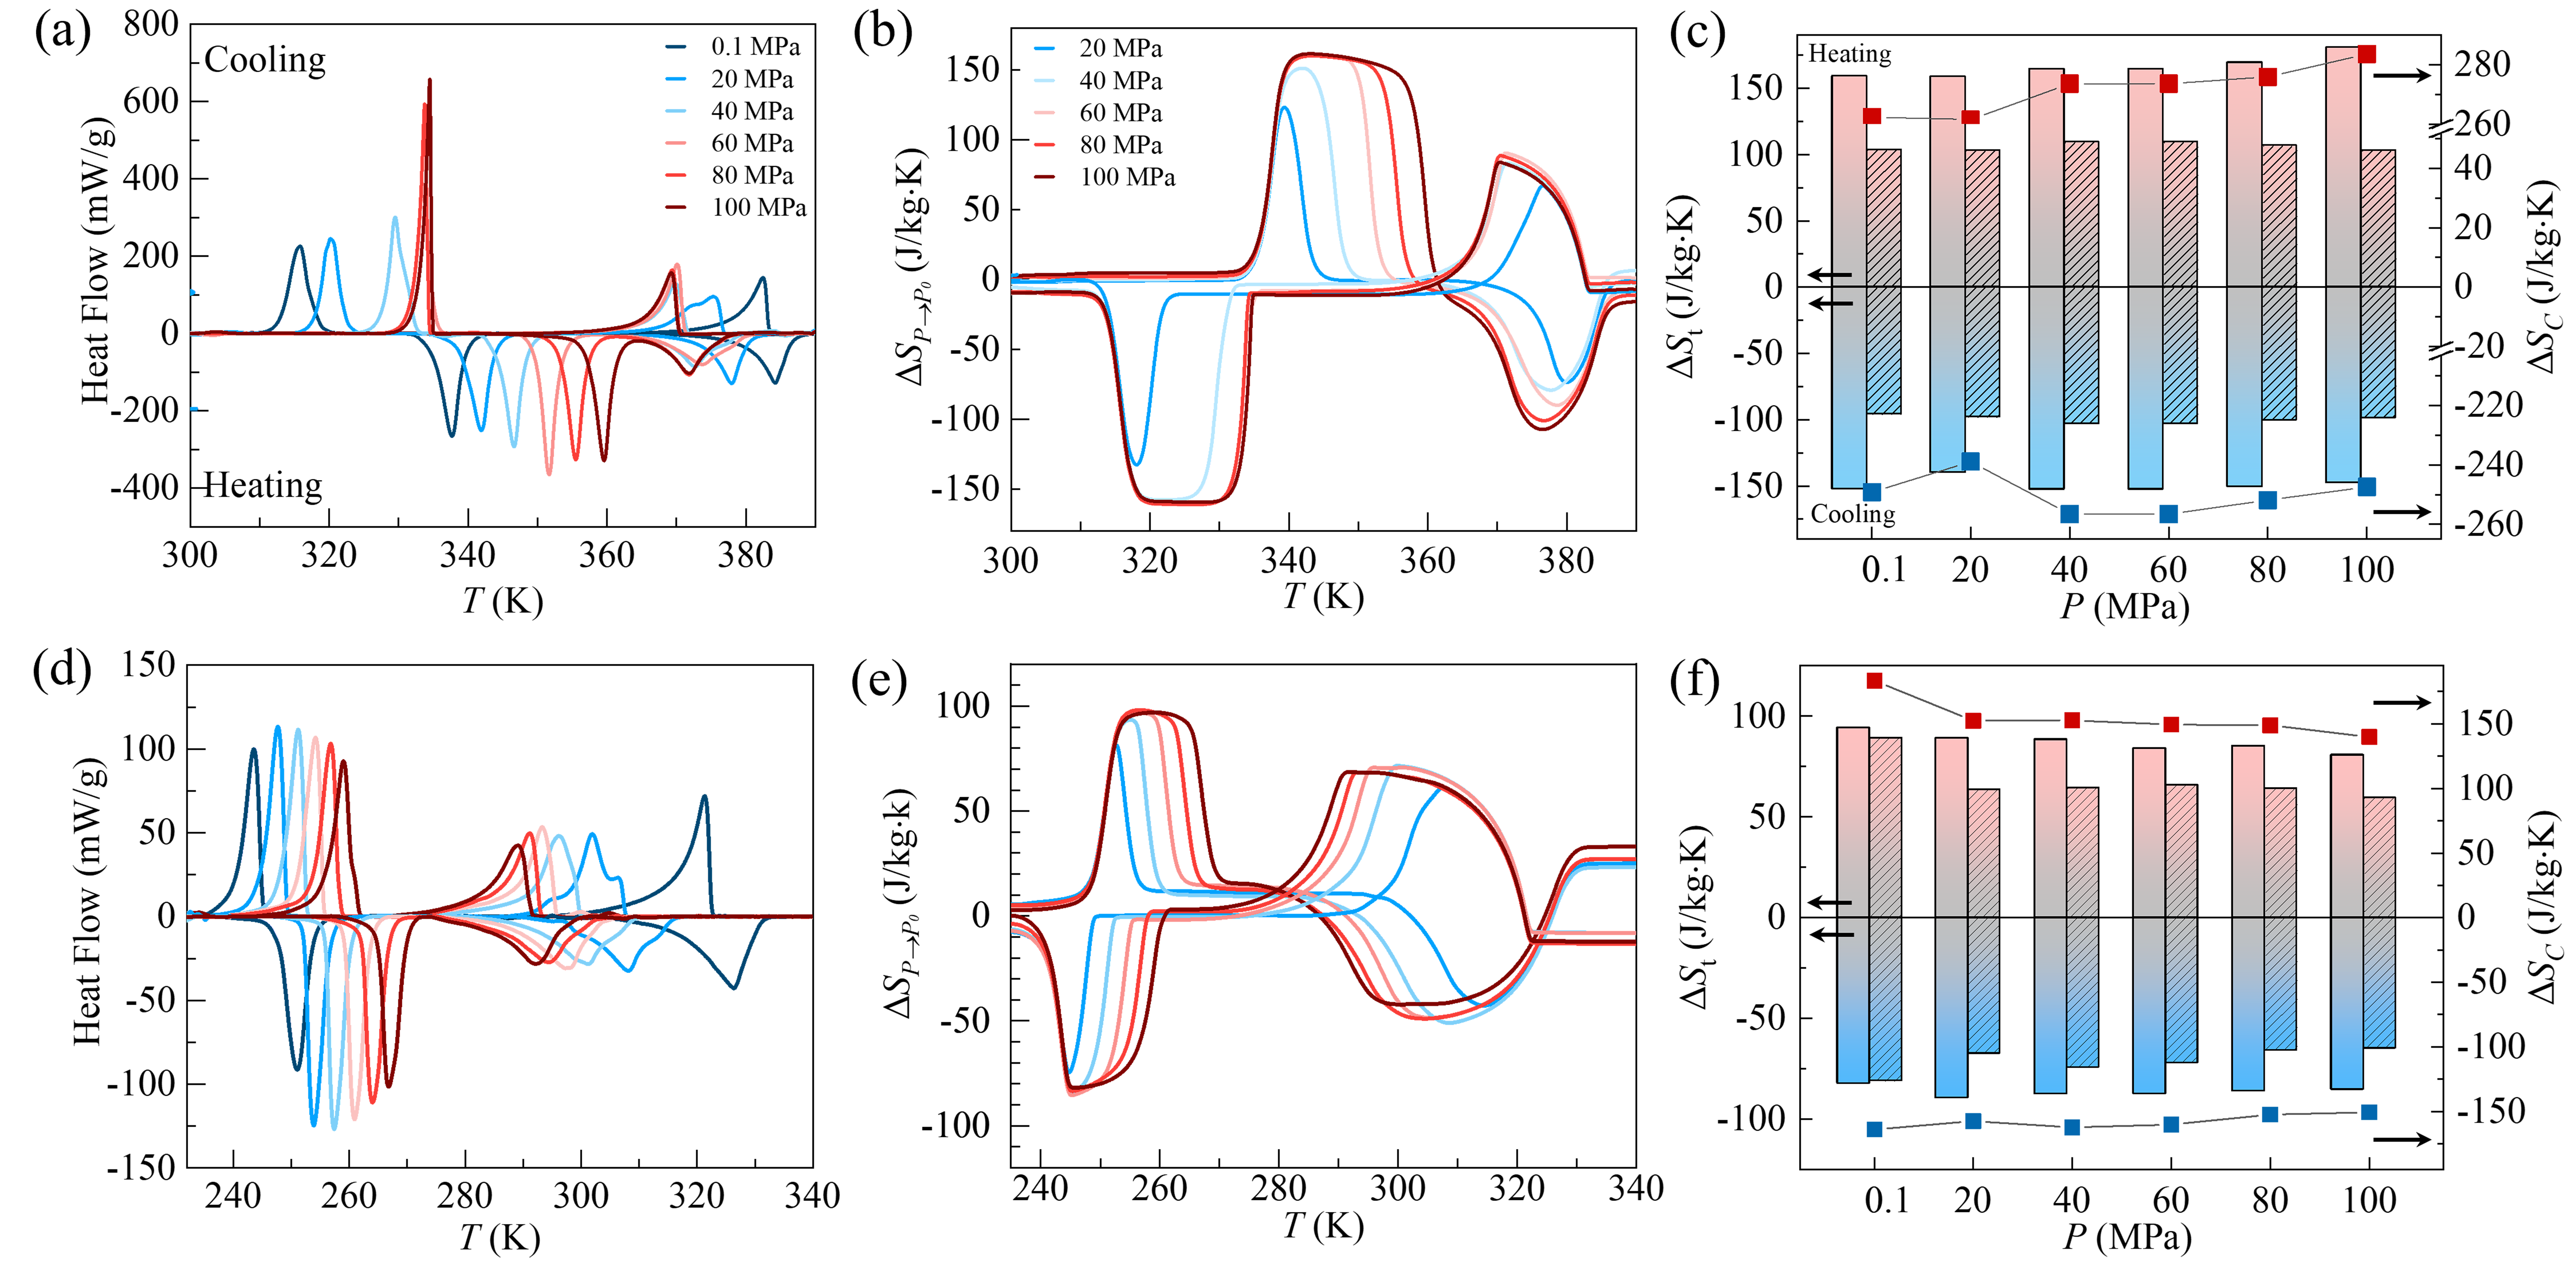
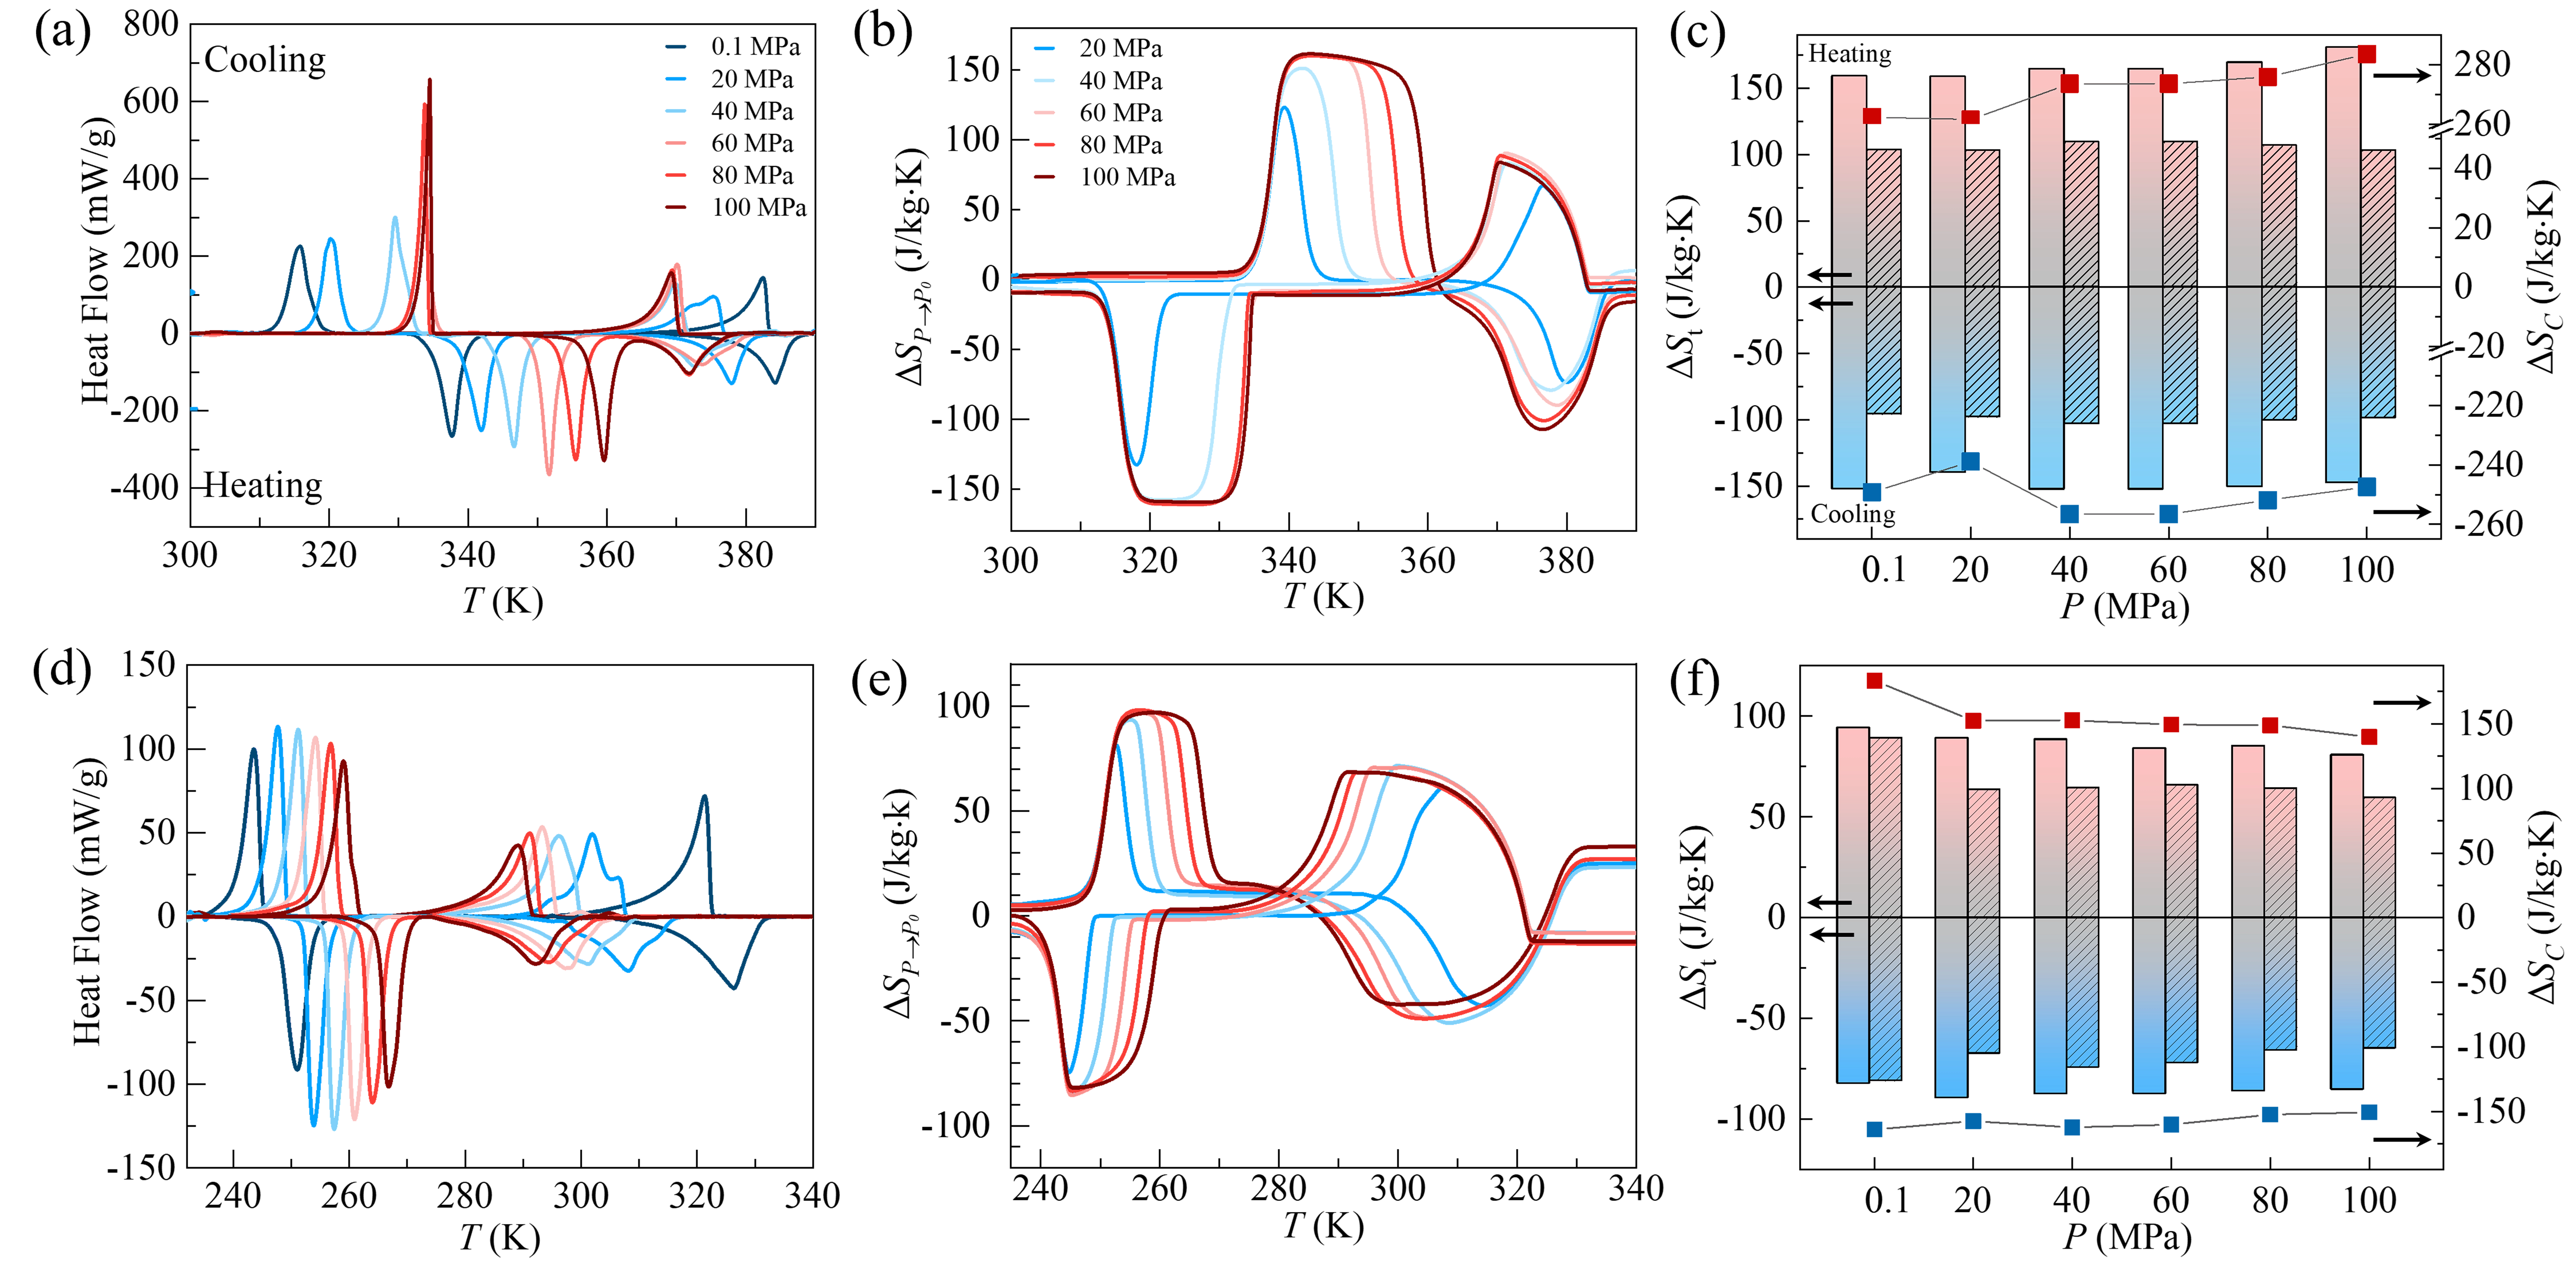
Figure 2. Barocaloric characterization and entropy change analysis of 1OH and 2OH. (a-c) Pressure-dependent DSC thermograms, calculated reversible pressure-induced entropy changes ΔSP→P0 and decomposed contributions to the total entropy change ΔSt for 2OH; (d-f) Corresponding results for 1OH. Red and blue denote heating and cooling, respectively. Striped and square-patterned regions represent the S-L and ΔSC contributions, respectively. DSC: differential scanning calorimetry.
A particularly notable feature emerges upon increasing pressure to 80 MPa, at which point the two transition temperatures converge. To examine the consequences of this convergence, we analyse the pressure dependence of ΔSP for each transition independently. In 2OH, ΔSt of both transitions increases progressively with applied pressure; as a result, the combined entropy change ΔSC summed across both transitions exhibits a substantial enhancement. Specifically, during heating, ΔSC reaches approximately 283.6 J/kg·K at 100 MPa, compared to 262.4 J/kg·K at ambient pressure, representing an enhancement of 21.2 J/kg·K (Figure 2c). It should be noted that an equivalent overlap does not occur during cooling under the same pressure conditions, owing to the large ΔThys associated with the S-S transition.
In contrast to 2OH, 1OH exhibits its BCEs at substantially lower temperatures and is characterized by comparatively reduced ΔSP→P0 across both phase transitions, yet compensates with a great pressure sensitivity dT/dP (evaluated locally fitting the transition-temperature data between each selected pressure point and ambient pressure) in its S-L transition. At an applied pressure of 20 MPa, dT/dP of 1OH reaches up to 0.91 K/MPa, which is nearly three times the corresponding value of 0.34 K/MPa observed in 2OH under identical conditions. Given the nonlinear S-L phase boundary, dT/dP was determined locally at specific pressure points, not via linear regression across the whole pressure range. ΔSP→P0 in 1OH during cooling/heating is approximately 88.3/87.8 J/kg·K (S-S transition) and 64.3/74.6 J/kg·K (S-L transition) at 40 MPa (Figure 2d,e), both of which fall below the corresponding values of 2OH. This reduction is probably attributed to differences in molecular configuration between the two compounds, which modulate the nature and magnitude of the intermolecular interactions governing each transition. Furthermore, in marked contrast to the behaviour observed in 2OH, both ΔSt and ΔSC in 1OH decrease moderately with increasing pressure (Figure 2f). Even at the highest applied pressure of 100 MPa, the two transitions do not overlap; consequently, no entropy enhancement due to transition overlap is observed.
Overall, the two fluoroalcohols display distinct yet complementary phase transition characteristics, each offering a unique combination of operating temperature range, entropy change magnitude, and dT/dP. While the S-S and S-L barocaloric transitions are not yet optimally aligned for single-stage room-temperature refrigeration, particularly in 2OH, these compounds should be viewed as a platform demonstrating coexisting normal and inverse barocaloric responses rather than immediately deployable refrigerants. Nevertheless, the marked transition-temperature shifts between 1OH and 2OH demonstrate strong molecular-structure dependence and provide opportunities for targeted tuning through molecular and crystal engineering.
3.3 Temperature-dependent and high-pressure raman spectroscopy
Raman spectroscopy provides a powerful and molecularly sensitive probe of both lattice dynamics and intramolecular interaction modes, and was therefore employed to track the conformational and structural evolution of both compounds across their respective phase transitions. The pronounced energy difference between trans and gauche conformers enables quantitative assessment of their relative populations during order-disorder and S-L transitions in n-alkane and alcohol systems, probed via longitudinal acoustic modes (LAM) and disordered longitudinal acoustic modes (DLAM) below 600 cm-1[37-39]. Temperature-dependent Raman spectra of 2OH recorded between 300 K and 390 K are presented in Figure 3a,b,c, spanning both the low- and high-wavenumber regions. With increasing temperature, systematic changes in the vibrational modes associated with C-F, C-C-O, C-C, and C-H stretching[35,38-39] are observed, accompanied by a progressive trans-to-gauche conformational conversion. Upon heating to 350 K, the LAM bands at approximately 31, 52, and 149 cm-1 and the DLAM bands at 302 and 384 cm-1 weaken markedly or disappear entirely, suggesting the breakdown of long-range translational order. Concurrently, the bands at 766 and 827 cm-1 (assigned to C-F and C-C-O stretching modes) and the C-H stretching feature near 2,970 cm-1 undergo pronounced broadening, collectively providing unambiguous spectroscopic evidence for the transition from the ordered crystal phase to the disordered plastic crystal phase. Upon further heating to the melting point (390 K), the onset of the S-L transition is marked by a substantial attenuation of all characteristic Raman features, consistent with the loss of both translational and orientational order in the liquid state.
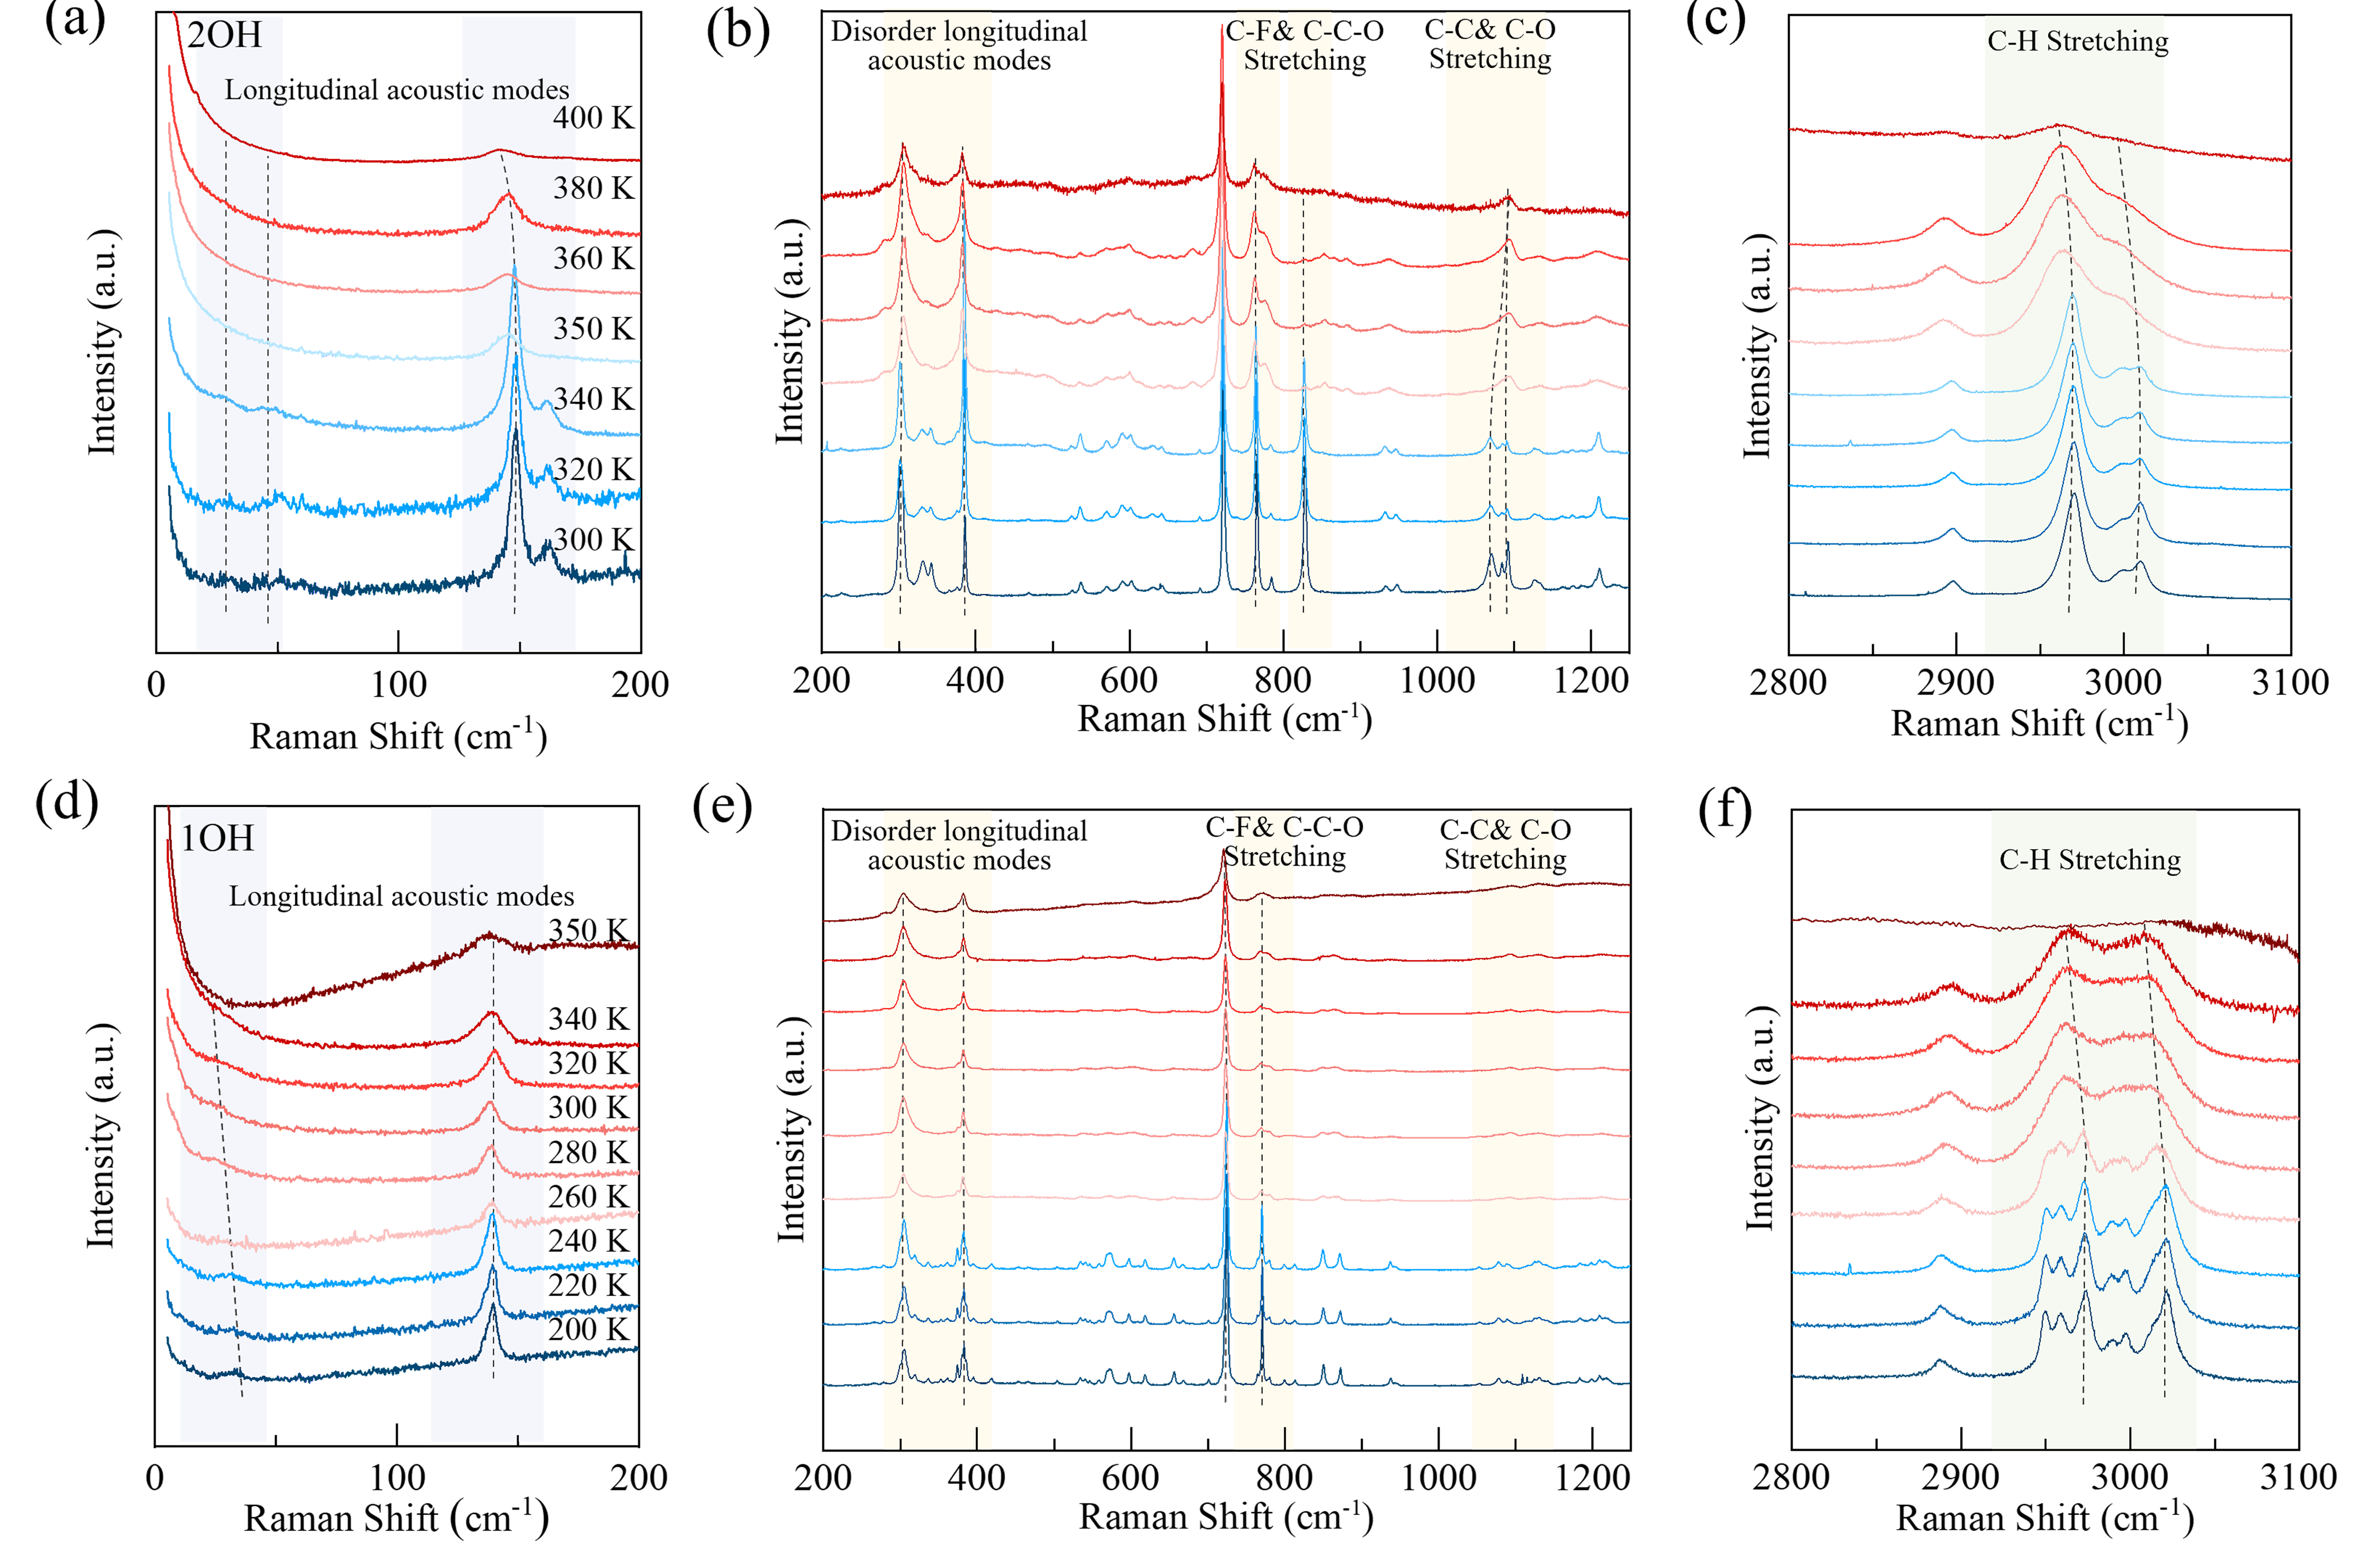
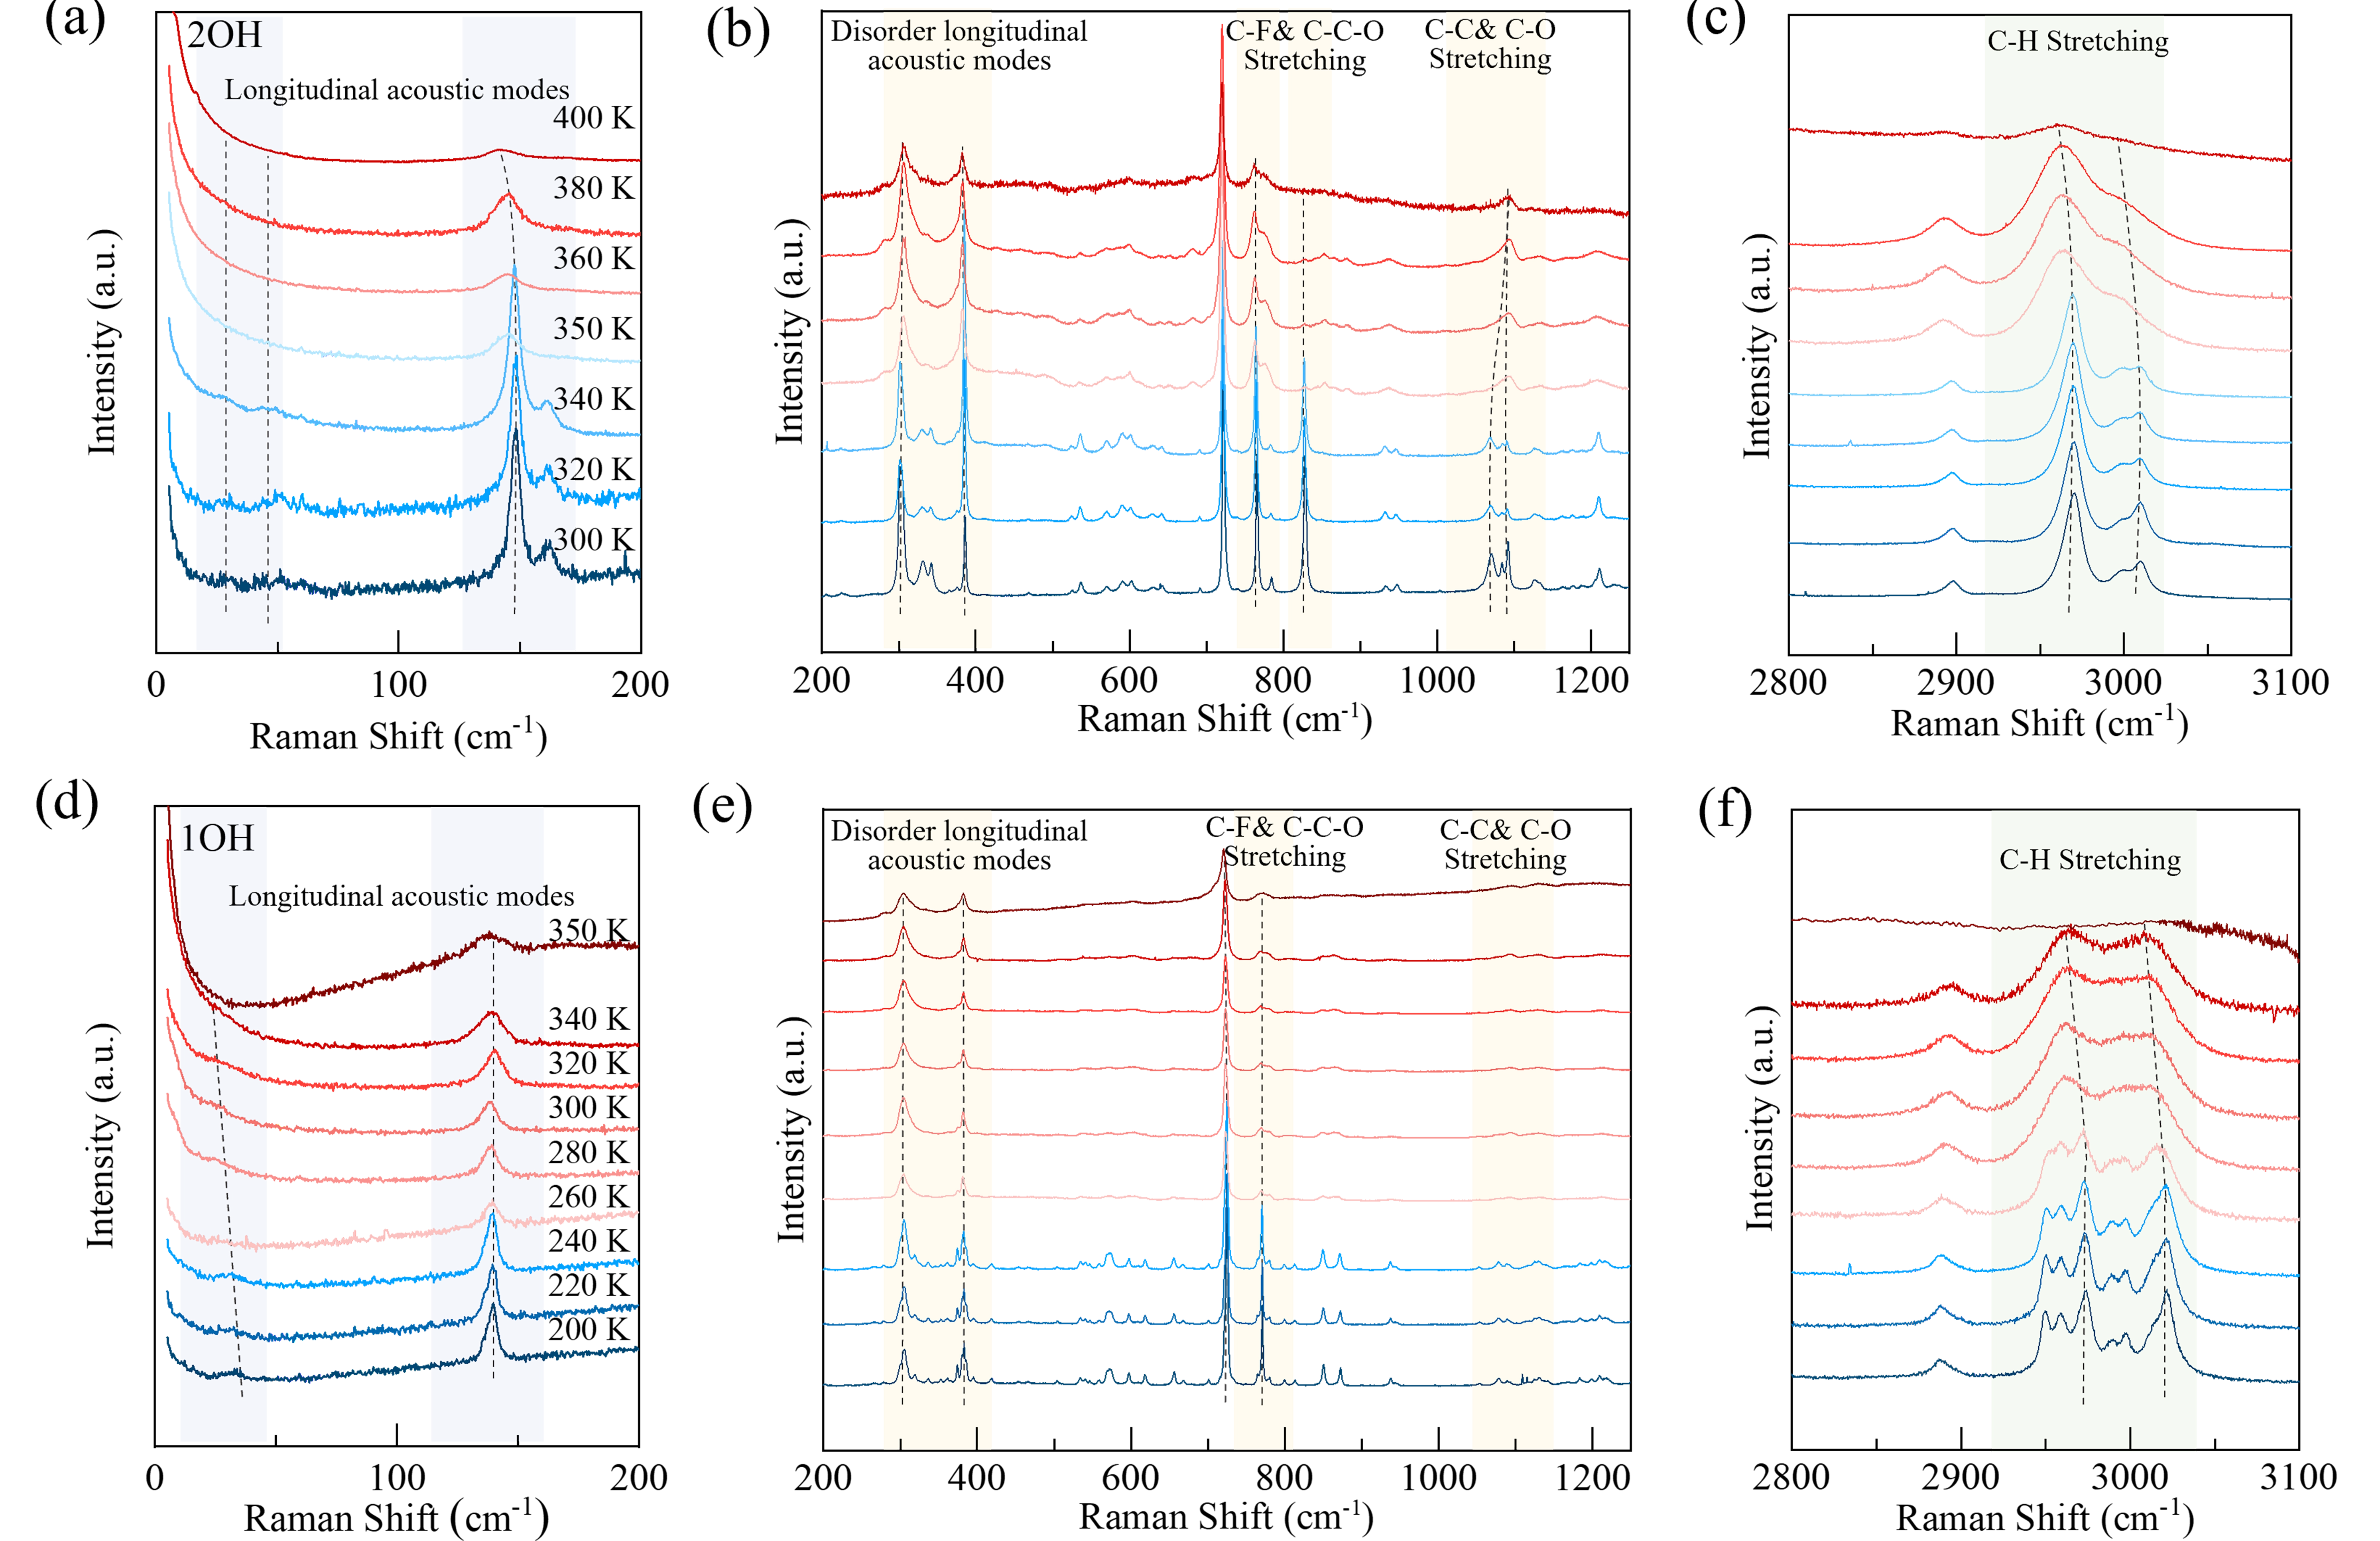
Figure 3. Temperature-dependent Raman spectra and conformational analysis of 2OH and 1OH. (a-c) Raman spectra of 2OH collected at various temperatures within the (a) ultra low and (b,c) high-wavenumber regions, highlighting the vibrational mode evolution during phase transitions; (d-f) Corresponding temperature-dependent Raman spectra for 1OH in the (d) ultra low and (e,f) high-wavenumber ranges.
Given the close structural relationship between 2OH and 1OH, the Raman spectra share many common features. For 1OH, heating to 260 K triggers pronounced broadening and attenuation of the majority of characteristic peaks (Figure 3d,e,f), marking the onset of the order-disorder transition to the plastic crystal phase. This process occurs at temperatures approximately 90 K lower than in 2OH, in accordance with the reduced intermolecular hydrogen-bonding strength. Upon further heating to 350 K, the residual features in both the low- and high-wavenumber regions are almost entirely suppressed, consistent with the completion of the S-L phase transition and the formation of the liquid phase.
Having established the temperature-driven phase behaviour of both samples, we focused subsequent in situ pressure-dependent Raman measurements on 1OH, which exhibits markedly greater dT/dP (Figure 2) and a larger temperature interval between its two phase transitions, facilitating their independent investigation. At room temperature, in-situ optical photos acquired during pressurization (Figure S1) provide direct visual evidence of a S-L transition as the applied pressure is increased from 0 to 130 MPa. Spectroscopically, this transition is manifested in the progressive weakening and eventual disappearance of the LAM bands at 26 and 138 cm-1 upon compression to 80 MPa and 130 MPa, respectively (Figure 4a), which is a signature fully consistent with the inverse BCE identified by high-pressure DSC. In the high-wavenumber region (2,850-3,100 cm-1), only a gradual decrease in overall intensity is observed, with no significant spectral reorganization apparent in the 200-1,250 cm-1 range (Figure 4b,c), indicating that the local molecular bonding environment is largely preserved across the S-L transition. Strikingly, upon further compression to 300 MPa, a new set of sharp peaks emerges at 16, 34, 775, and 847 cm-1, indicating the coexistence of liquid and ordered crystal phases. Complete solidification into the ordered crystal phase is achieved at 400 MPa with LAM mode strengthening, demonstrating that sufficiently high pressure can re-establish long-range crystal order even above the ambient-pressure melting point.
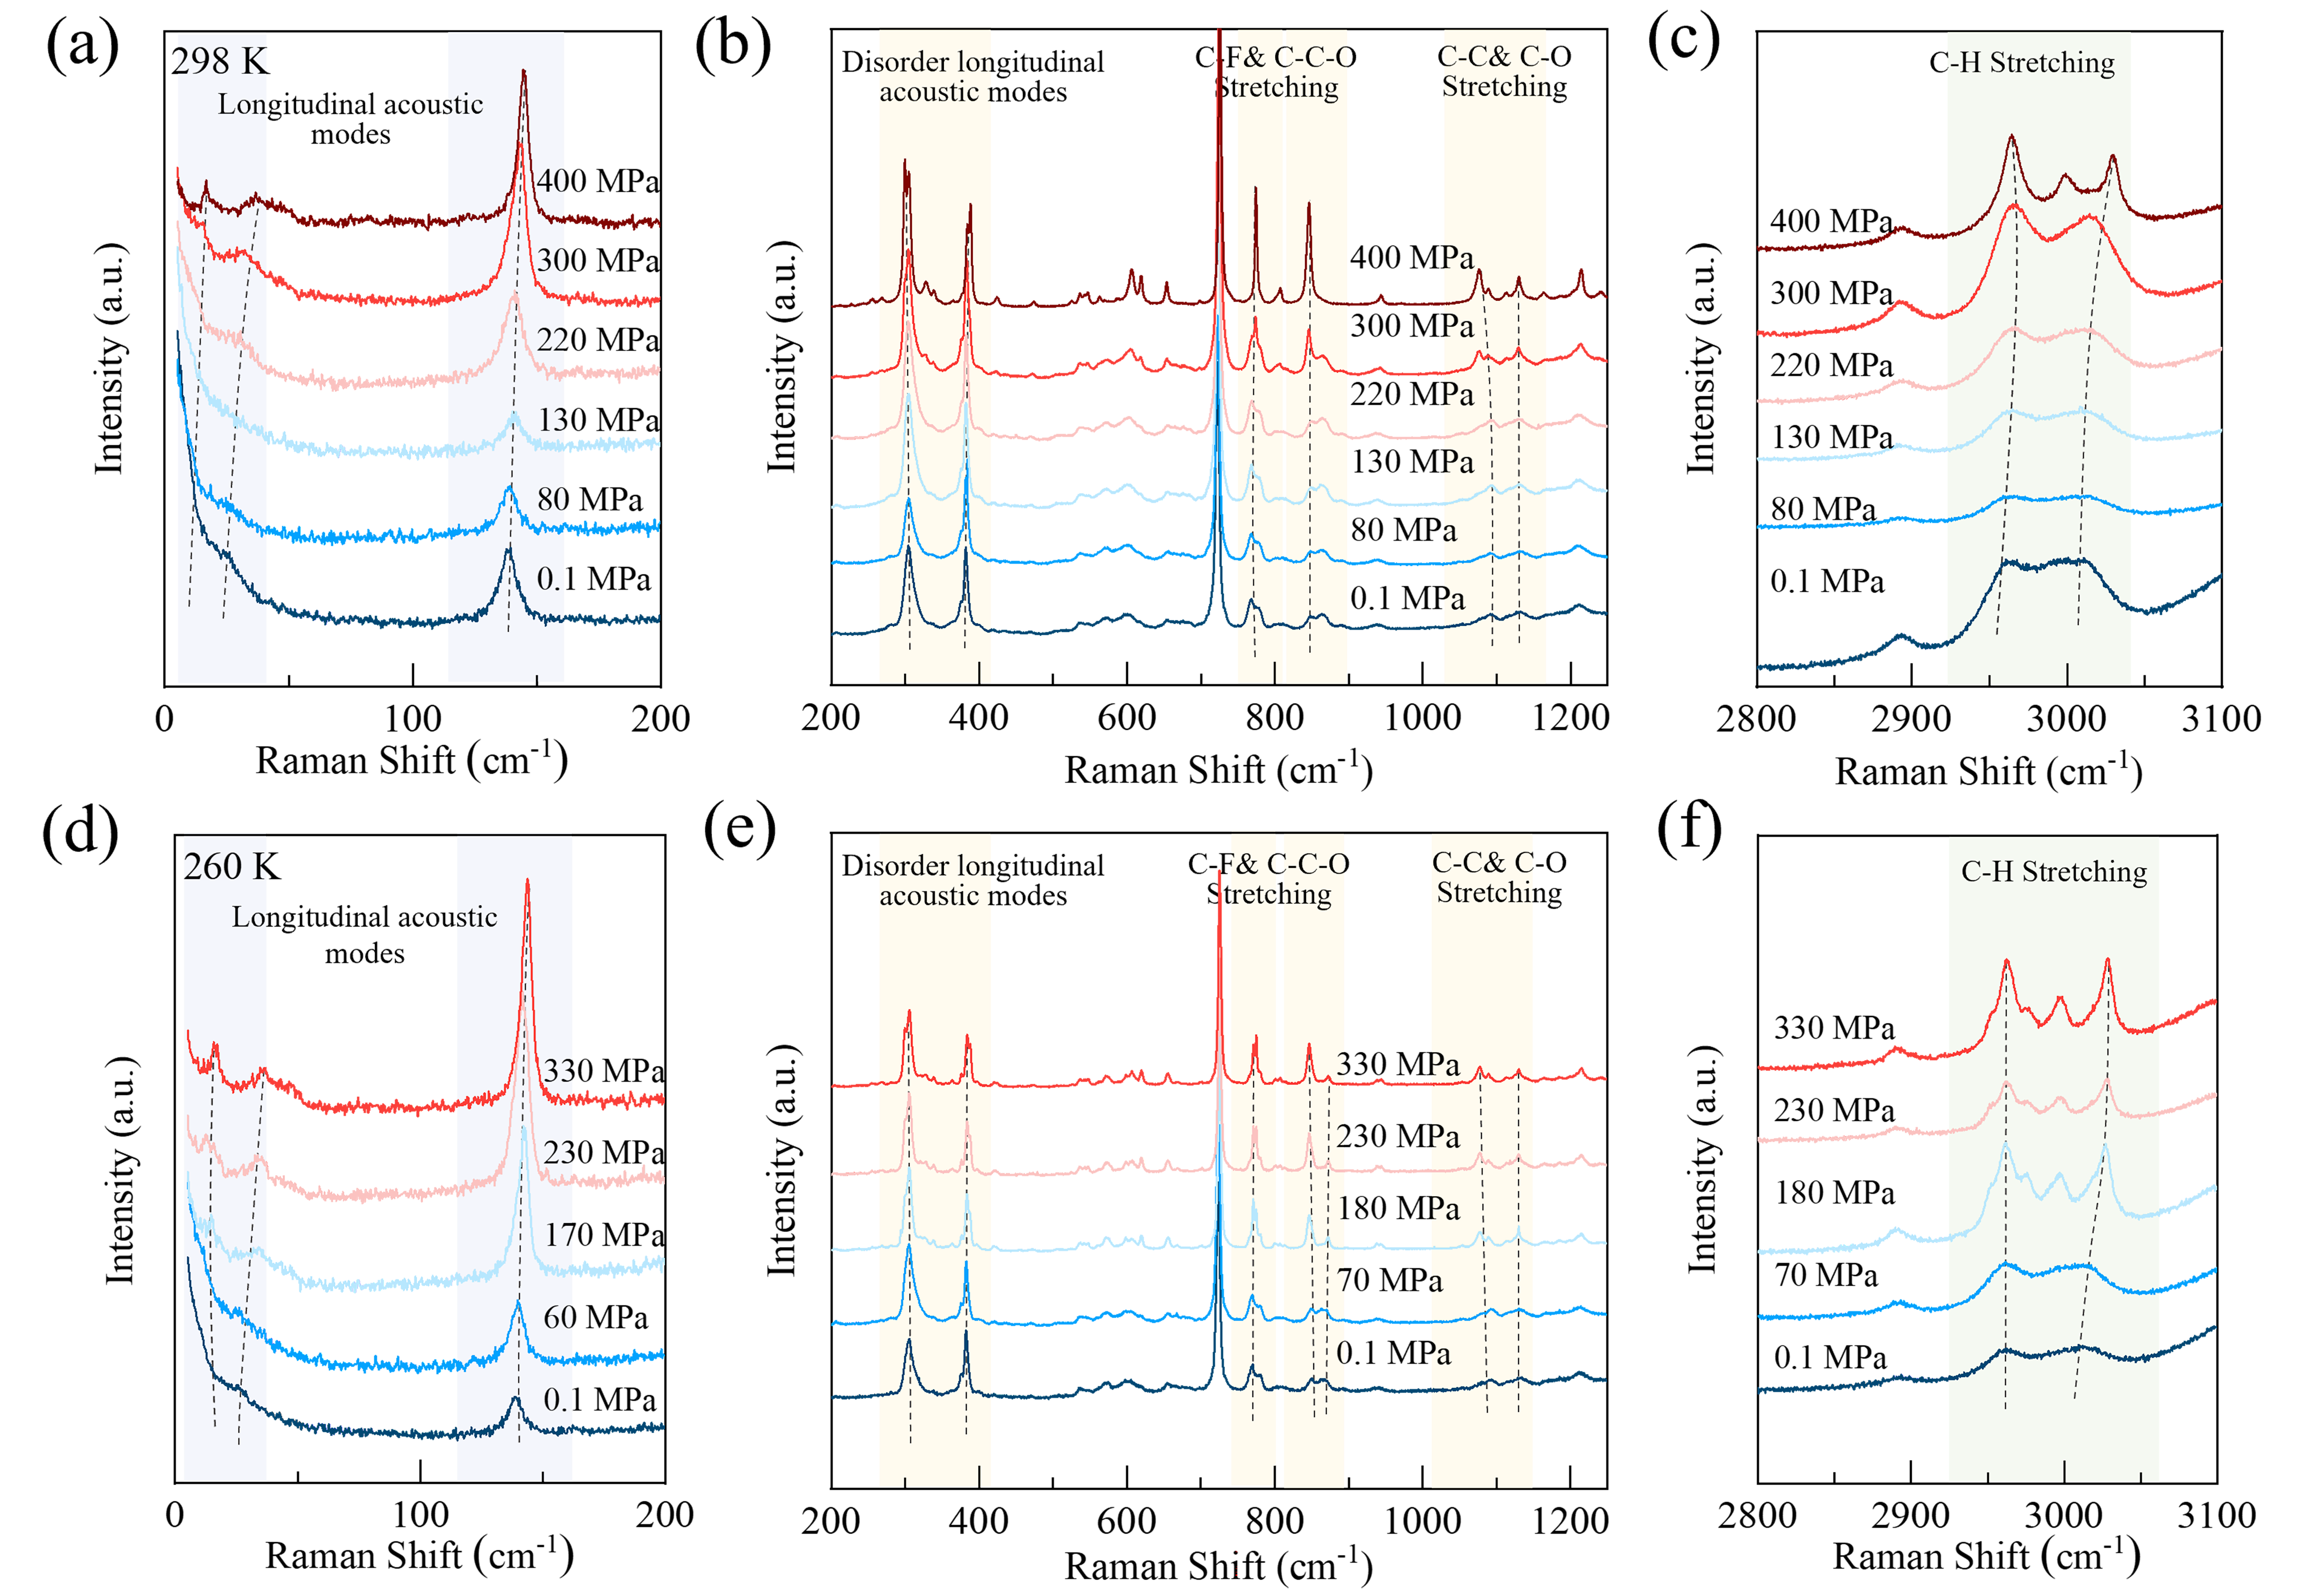
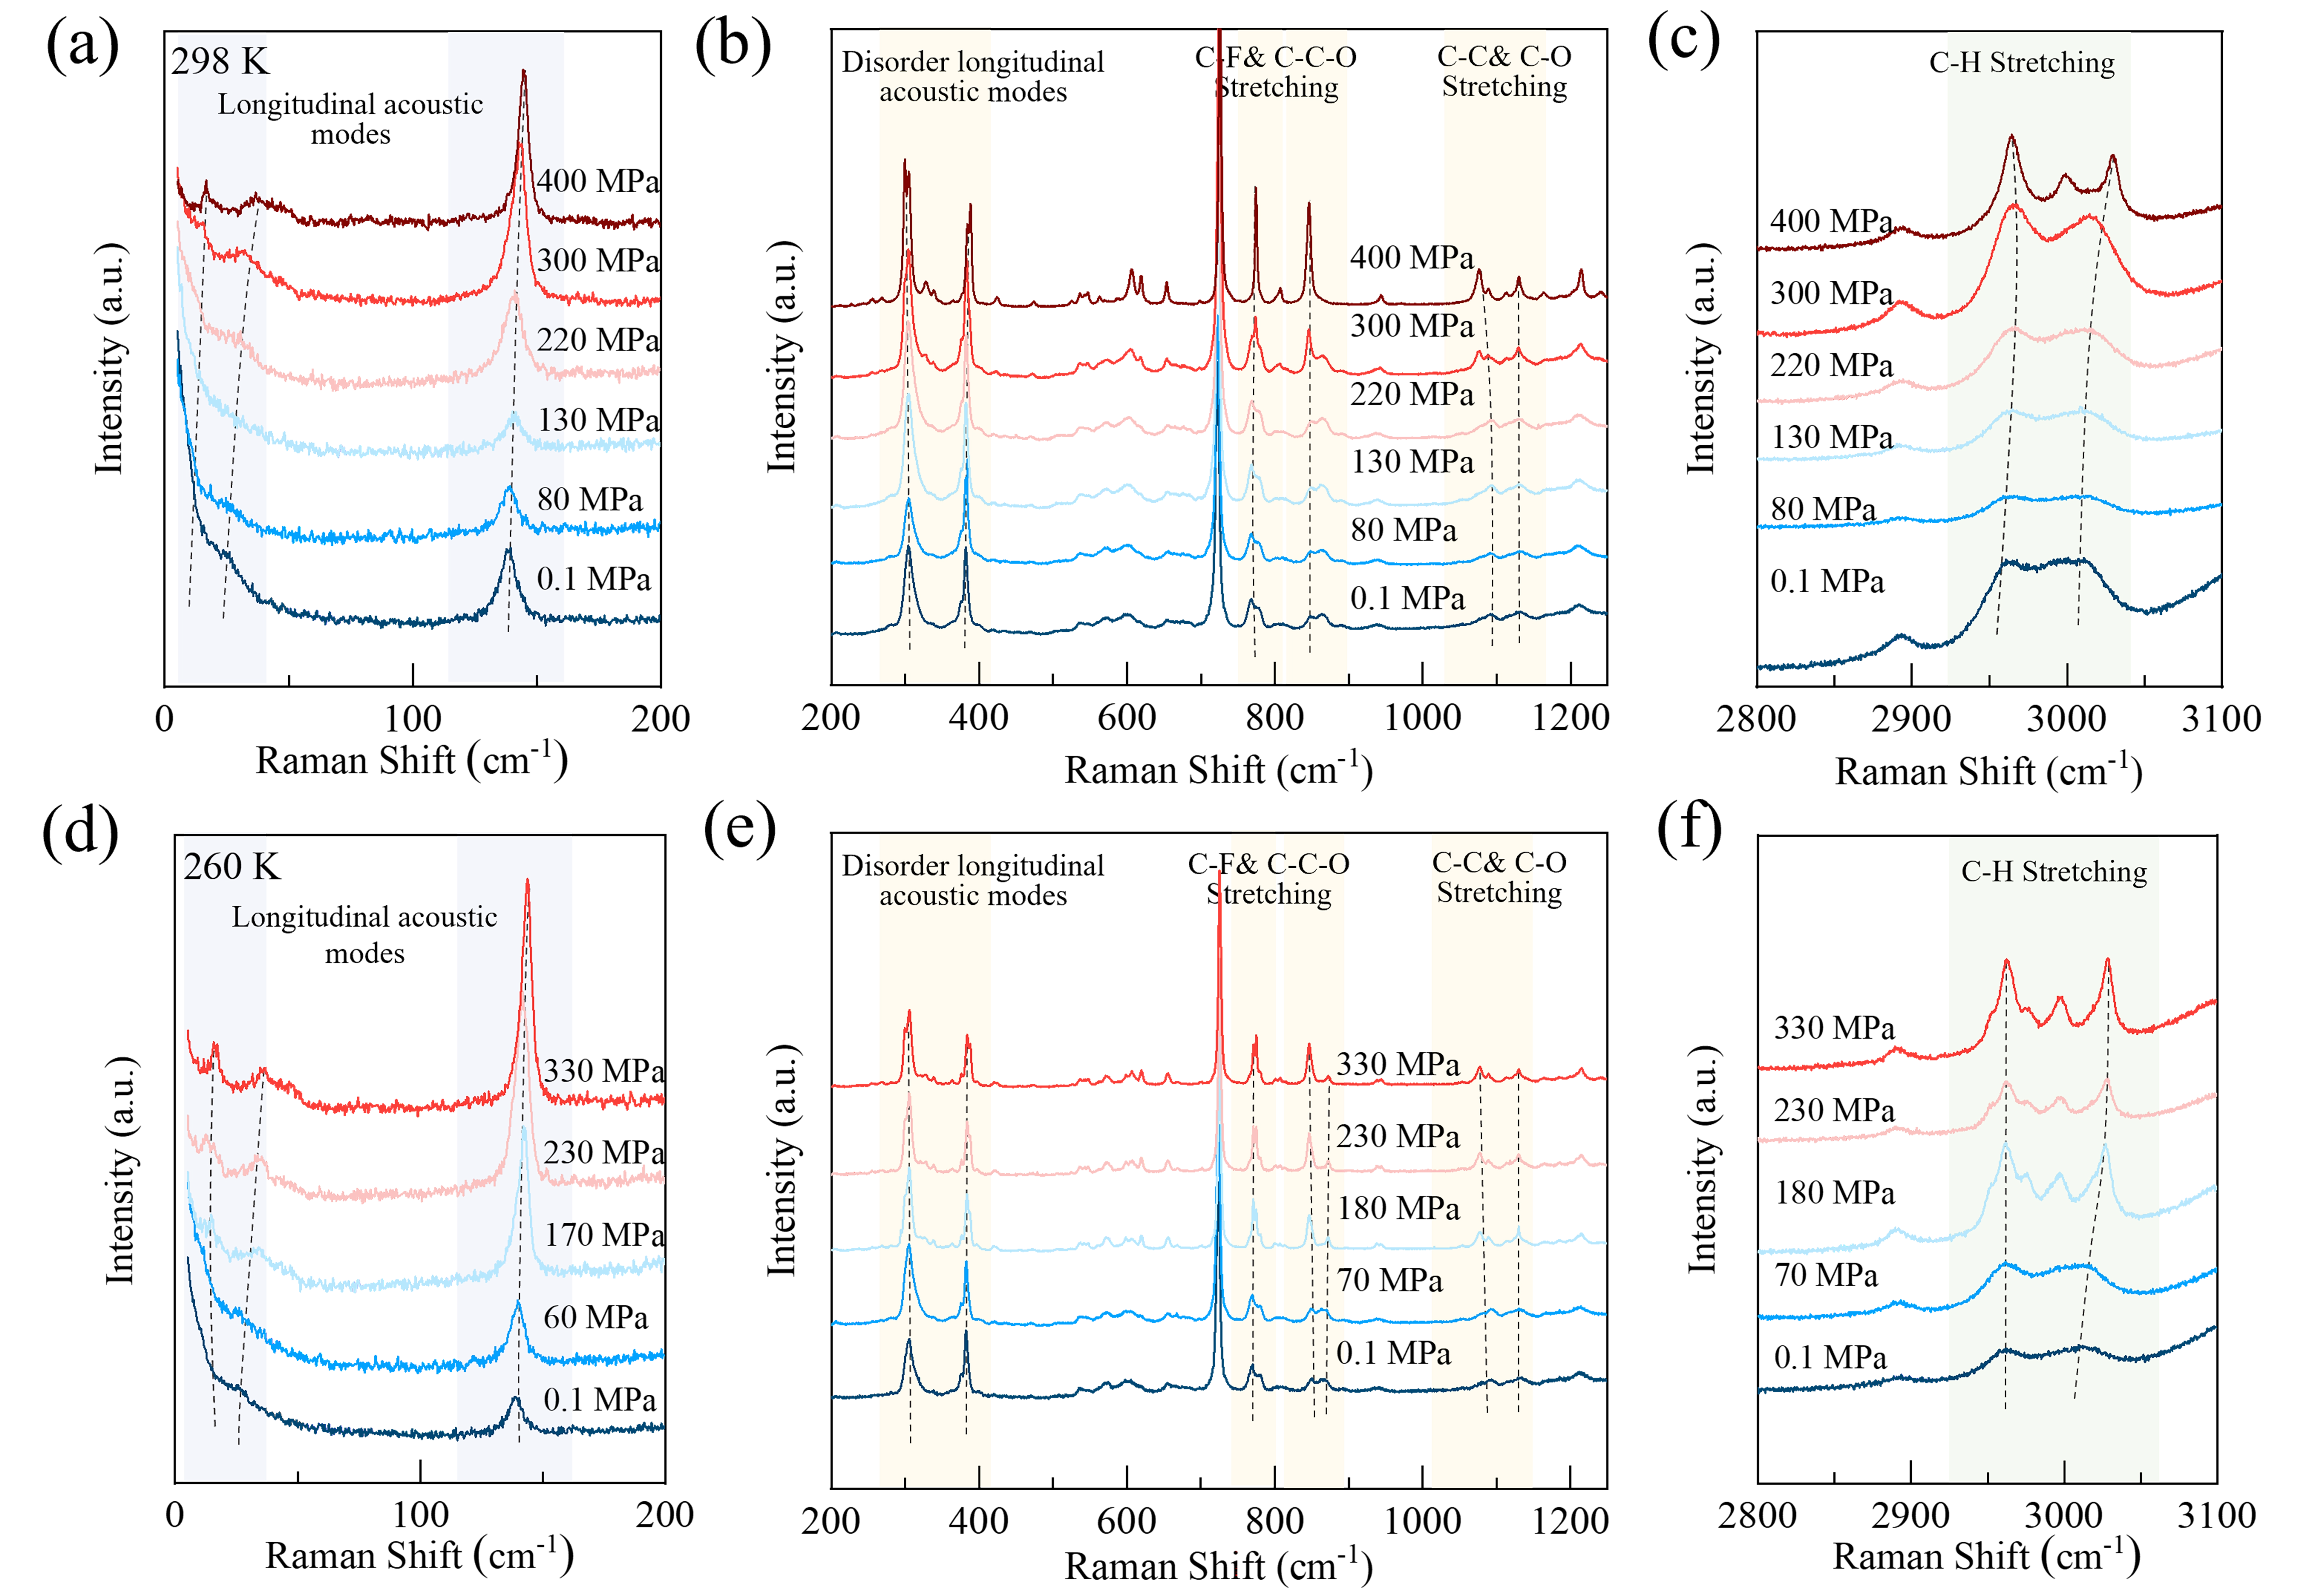
Figure 4. Pressure-dependent Raman spectra of the multiphase transitions in 1OH. (a-c) For the plastic-liquid-ordered crystal phase transition, pressure-dependent Raman spectra are collected at 298 K in distinct wavenumber regions; (d-f) For the plastic-ordered crystal phase transition are obtained at 260 K.
To probe the pressure-driven behavior of the S-S transition, measurements were conducted at reduced temperatures of 285 K and 260 K, where 1OH resides in its plastic crystal phase at ambient pressure (Figure S2 and Figure 4d,e,f). At both temperatures, pressure drives a direct transformation from the disordered plastic crystal phase to the ordered crystal, with the transition pressure decreasing from 450 MPa at 285 K to 330 MPa at 260 K, which is consistent with the negative slope of the S-S phase boundary in the pressure-temperature (P-T) phase diagram. Throughout this process, the characteristic Raman peaks sharpen progressively and their intensities increase with rising pressure, reflecting the restoration of both translational and orientational molecular order. This behavior is unambiguously indicative of a normal BCE, in which the application of pressure stabilizes the more ordered, higher-density crystal phase at the expense of the disordered plastic crystal phase (Figure 4d,e,f).
Analogous behaviour is revealed by pressure-dependent Raman spectra of 2OH at three representative temperatures (Figure S3). At 375 K (below the ambient-pressure melting point), pressure from 0 to 270 MPa drives a sequential plastic crystal-liquid-ordered crystal transformation, captured unambiguously by the non-monotonic evolution of the LAM band (~140 cm-1): progressive broadening upon pressure-induced melting, followed by marked sharpening upon re-solidification. At lower temperatures (365 K and 350 K), the compression path no longer intersects the melting boundary, and 2OH instead undergoes a direct plastic crystal-ordered crystal transition, evidenced by monotonic peak sharpening. This temperature-dependent switching between sequential and direct pathways reflects the strong thermodynamic coupling between temperature and pressure in governing phase stability. Notably, the pressure required to complete the plastic-ordered crystal transition decreases from 365 K to 350 K, consistent with the positive slope of the solid-solid phase boundary in the P-T phase diagram.
Collectively, the pressure-dependent Raman spectra presented here provide a comprehensive, molecularly resolved picture of the structural transformations undergone by both 2OH and 1OH under elevated pressures. By independently varying temperature and pressure, distinct phase regimes of liquid, plastic crystal, and ordered crystal can be selectively accessed and interconverted, demonstrating a high degree of external control over the order-disorder structures of these perfluorinated alcohols. According to the Clausius-Clapeyron relation, the positive slopes of the S-S phase boundaries for both materials indicate a positive volume change (ΔV > 0) across the S-S transition. In contrast, the negative slopes of their S-L phase boundaries imply a negative volume change (ΔV < 0), indicating volume contraction upon melting. This thorough mechanistic understanding of lattice dynamics, conformational order, and phase transformation establishes a framework for the rational design of BCE molecular materials with tunable phase-switching characteristics.
3.4 Temperature-pressure diagram and pressure sensitivity performance
Building upon the isobaric heat flow data presented in Figure 2a, d and the pressure-dependent Raman spectra in Figure 4, comprehensive P-T phase diagrams were constructed for both compounds, as shown in Figure 5a,b. A striking feature of both phase diagrams is the pronounced nonlinearity of the P-T curves associated with the inverse S-L transition, in marked contrast to the linear behavior characteristic of the normal S-S transition in conventional BCE materials. This nonlinearity is particularly acute at low pressures, giving rise to exceptionally steep slopes and hence anomalously high dT/dP in the vicinity of 20 MPa.
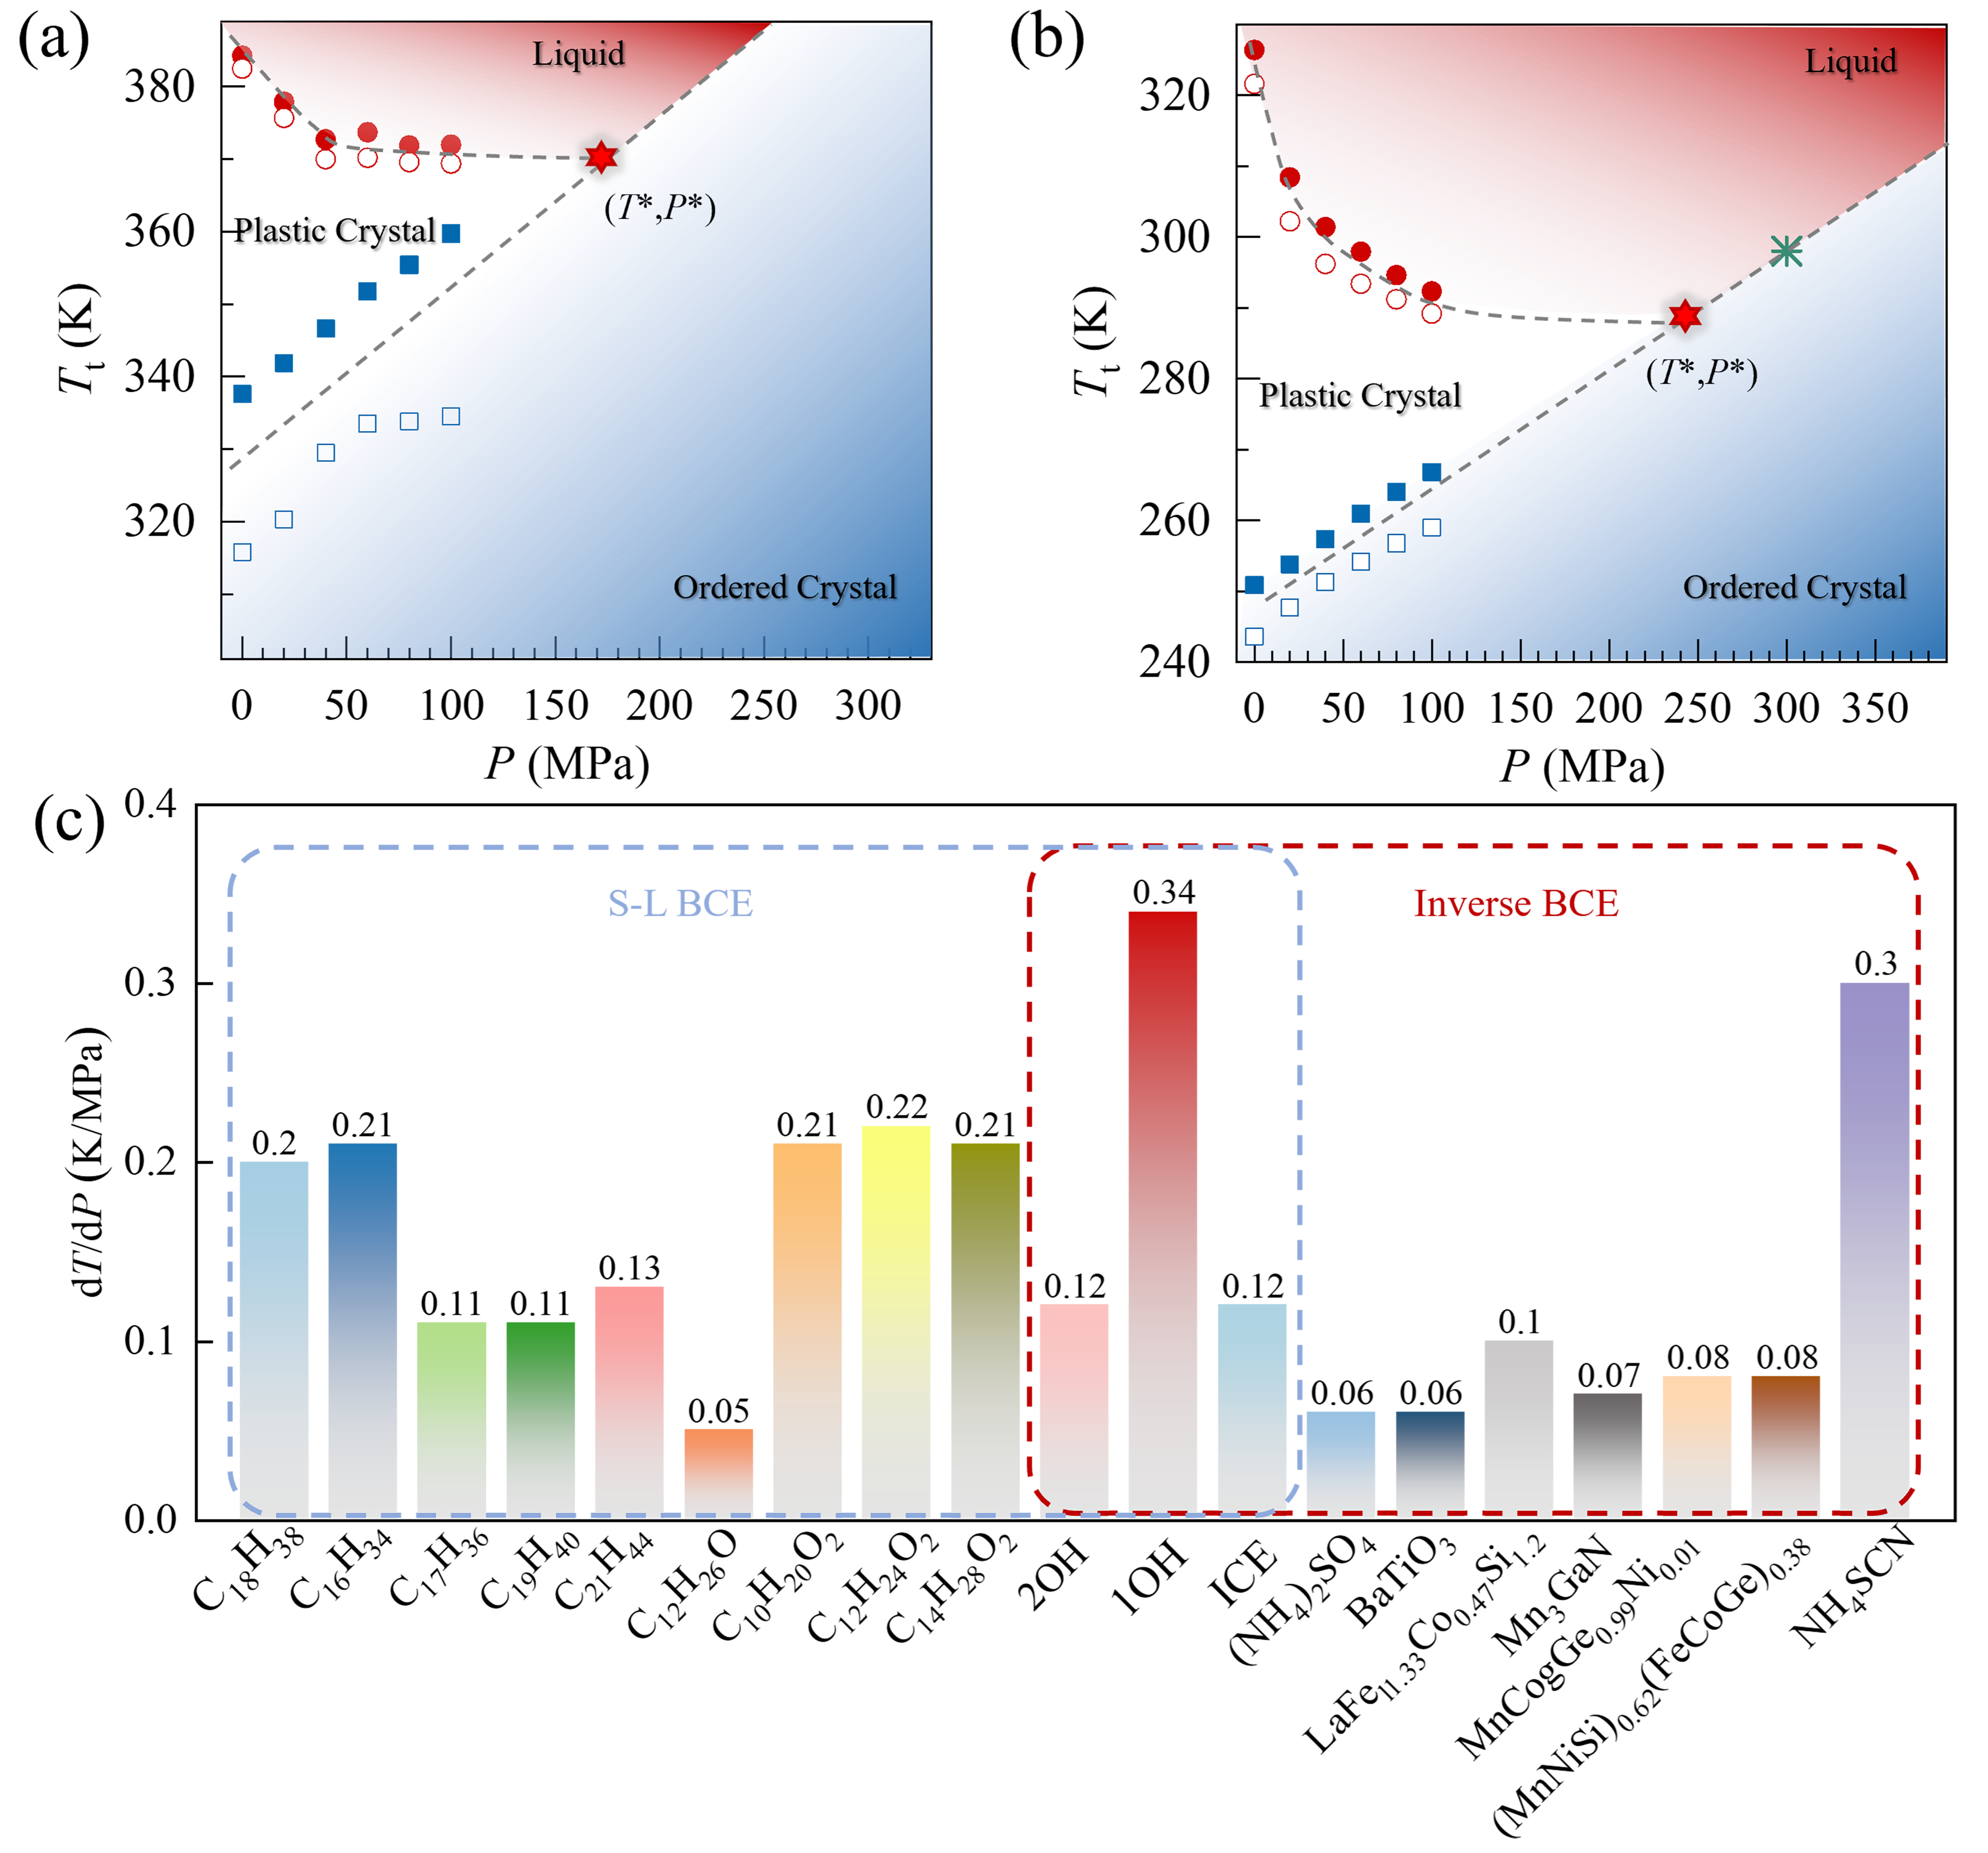
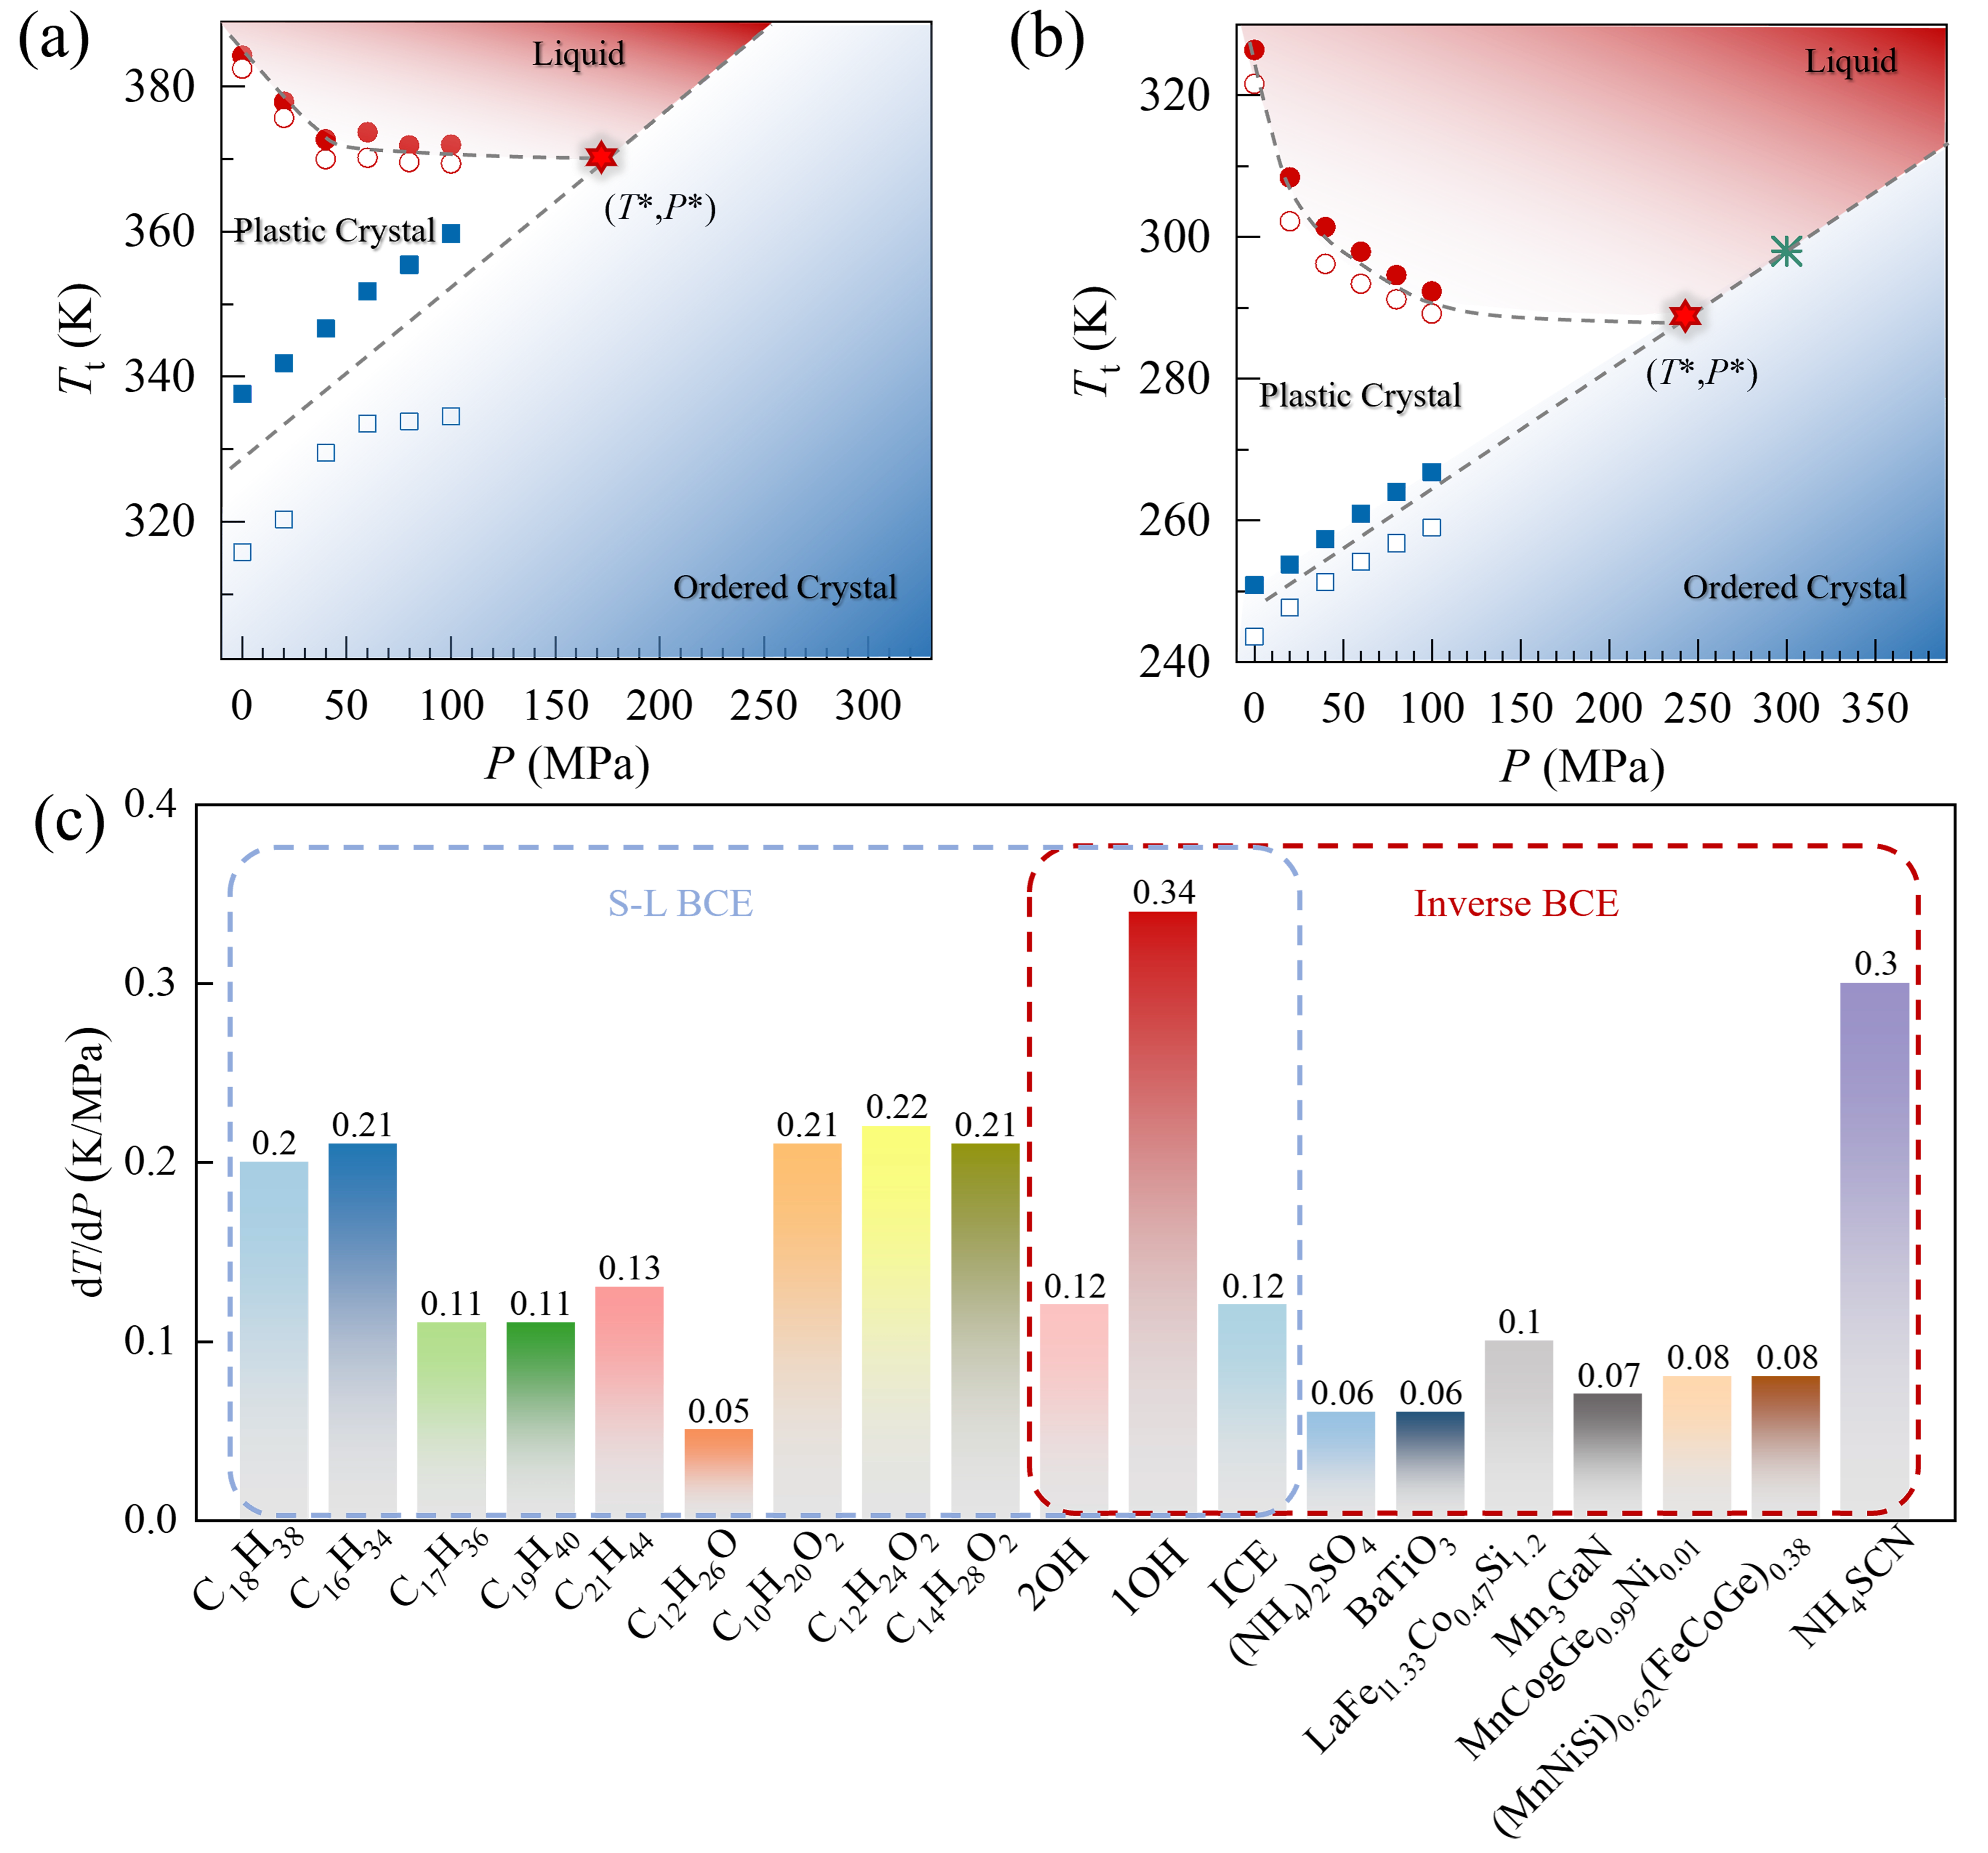
Figure 5. Phase diagrams and pressure sensitivity performance. (a,b) P-T phase diagrams for (a) 2OH and (b) 1OH, showing the phase boundaries (the gray dotted lines based on the DSC curves) among the ordered crystal, plastic crystal, and liquid phases. Square and circle dots represent the experimental Tt as a function of pressure derived from high-pressure DSC curves, while the solid-liquid coexisting phase identified by Raman spectra is marked with a green asterisk; (c) Comparison of dT/dP between the present materials and other representative BCE materials involving S-L and inverse BCE transitions (from left to right: C18H38, C16H34[38], C17H36, C19H40, C21H44[30], C12H26O[34], C10H20O2, C12H24O2, C14H28O2[40], 2OH, 1OH, ice[29], (NH4)2SO4[27], BaTiO3[26], LaFe11.33Co0.47Si1.2[41], Mn3GaN[42], MnCoGe0.99Ni0.01[43], (MnNiSi)0.62(FeCoGe)0.38[44], NH4SCN[28]). DSC: differential scanning calorimetry; BCE: barocaloric effect.
The maximum pressure accessible in the high-pressure DSC experiments (100 MPa) is insufficient to drive the S-S and S-L phase boundaries into coincidence within the experimentally accessible temperature window. Extrapolation of the respective P-T curves places the triple points (T*, P*) at which the ordered crystal, plastic crystal and liquid of a substance coexist for 2OH and 1OH at approximately 174 MPa and 243 MPa, respectively. The phase states identified by quasi-static in situ high-pressure Raman spectroscopy are broadly consistent with those inferred from high-pressure DSC measurements, with closer agreement observed for the heating DSC traces. The discrepancy between the Raman-derived phase boundaries and the cooling DSC traces is plausibly attributable to kinetic hysteresis associated with supercooling during cooling. Crucially, by extending the pressure range well beyond the DSC limit, the Raman measurements capture additional phase transition features, including the re-entrant crystallization behavior discussed above that substantially enrich the high-pressure phase diagrams of both compounds and provide a more complete picture of the pressure-induced ordering landscape in these molecular systems.
Additionally, the S-L transition in this class of materials demonstrates excellent pressure sensitivity, particularly under low-pressure conditions, as evidenced by DSC curves and phase diagrams. To quantitatively evaluate this feature, dT/dP of the present materials was compared with that of other representative barocaloric materials involving S-L and inverse transitions[26-30,34,38,40-44]. Given the intrinsically nonlinear nature of the S-L phase boundary, the pressure sensitivity, dT/dP, increases substantially in the low-pressure regime. To ensure a meaningful comparison with previously reported barocaloric materials, however, we compare dT/dP values evaluated at 100 MPa, a pressure range that is broadly consistent with those used for the reference systems. At 100 MPa, dT/dP reaches 0.12 K/MPa for 2OH and 0.34 K/MPa for 1OH (Figure 5c). Notably, the apparent low-pressure sensitivity of 1OH reaches 0.91 K/MPa at 20 MPa. Although this value is exceptionally high, its cycling stability at low pressure requires further verification. We therefore do not include the 20 MPa result in the cross-material comparison in Figure 5c and Table S1. These results establish fluorinated materials as a high-performance material platform for barocaloric energy conversion, and by tuning the molecular structure, composition, confinement, and operating pressure, it may become possible to position the normal and inverse transitions in separate, application-relevant temperature windows and to selectively exploit either response mode.
4. Conclusion
Barocaloric cooling represents one of the most compelling solid-state alternatives to conventional vapour-compression refrigeration, yet the vast majority of BCE materials reported to date are restricted to a single caloric mechanism, fundamentally limiting their operational versatility and application scope. In this work, we demonstrate that perfluorinated alcohols constitute a uniquely bifunctional barocaloric platform, in which the S-S transition delivers a high-performance normal BCE while the S-L transition manifests a rare inverse BCE, which was previously documented only in ice. Critically, the temperature windows of these two transitions can be systematically tuned by varying the number of hydroxyl (-OH) groups, enabling their natural alignment with distinct thermal regimes: heat storage and refrigerator cycles both within a single material system and without recourse to external compositional engineering. The 1OH compound, in particular, exhibits exceptional dT/dP of 0.34 K/MPa at 100 MPa for its inverse S-L transition, establishing the highest-pressure sensitivity reported to date among all S-L transition-based and inverse BCE material systems. Beyond their outstanding performance metrics, these materials reveal a broader design principle: that molecular fluorination, in concert with hydroxyl-group engineering, provides a powerful and generalizable strategy for simultaneously accessing normal and inverse caloric effects within a unified molecular framework. In the future, elucidating the microscopic origins of the crossover from normal to inverse BCE behavior at the S-L boundary and exploiting this crossover to engineer materials with on-demand switchable caloric responses represent a particularly fertile direction for future investigation. We anticipate that this work will stimulate broader exploration of perfluorinated molecular systems as a rich and largely untapped reservoir of multifunctional caloric materials.
Supplementary materials
The supplementary material for this article is available at: Supplementary materials.
Author contributions
Li L: Conceptualization, data curation, investigation, methodology, visualization, writing-original draft.
Wang H, Fan X, Wang Y, Zhang K: Methodology, formal analysis.
Li B: Conceptualization, writing-review & editing, supervision, funding acquisition.
Conflicts of interest
Bing Li is an Editorial Board Member of Thermo-X. The other authors declare no conflicts of interest.
Ethical approval
Not applicable.
Consent to participate
Not applicable.
Consent to publication
Not applicable.
Availability of data and materials
The data that support the findings of this study are available from the corresponding author upon reasonable request.
Funding
The work conducted in the in the Institute of Metal Research was supported by the National Natural Science Foundation of China (Grant No. 52425107), Key Research Program of Frontier Sciences of Chinese Academy of Sciences (Grant No. ZDBS-LY-JSC002) and Liaoning Revitalization Talents Program-Leading Talents (Grant No. XLYC2502032). Li Lingli acknowledges the support of the Natural Science Foundation of Liaoning Province (Grant No. 2025-BS-0156).
Copyright
© The Author(s) 2026.
References
-
1. Stern PC, Janda KB, Brown MA, Steg L, Vine EL, Lutzenhiser L. Opportunities and insights for reducing fossil fuel consumption by households and organizations. Nat Energy. 2016;1(5):16043.[DOI]
-
3. Forman C, Muritala IK, Pardemann R, Meyer B. Estimating the global waste heat potential. Renew Sustain Energy Rev. 2016;57:1568-1579.[DOI]
-
4. Li B, Kawakita Y, Ohira-Kawamura S, Sugahara T, Wang H, Wang J, et al. Colossal barocaloric effects in plastic crystals. Nature. 2019;567(7749):506-510.[DOI]
-
5. Zhang K, Liu Y, Gao Y, Zhang Z, Wang H, Li W, et al. Extreme barocaloric effect at dissolution. Nature. 2026;649(8099):1180-1185.[DOI]
-
6. Qian K, Lin S, Zhang Z, Li B, Peng Y, Li Y, et al. Highly efficient mechanocaloric cooling using colossal barocaloric plastic crystals. Cell Rep Phys Sci. 2024;5(6):101981.[DOI]
-
7. Seredyuk M, Li R, Znovjyak K, Zhang Z, Valverde-Muñoz FJ, Li B, et al. Reversible colossal barocaloric effect of a new FeII molecular complex with low hysteretic spin crossover behavior. Adv Funct Mater. 2024;34(30):2315487.[DOI]
-
9. Zhang K, Li L, Ji T, Zhang Z, Qi J, Yu D, et al. Colossal barocaloric materials. Annu Rev Mater Res. 2026;56:109-134.[DOI]
-
11. Zhang K, Song R, Qi J, Zhang Z, Zhang Z, Yu C, et al. Colossal barocaloric effect in carboranes as a performance tradeoff. Adv Funct Mater. 2022;32(20):2112622.[DOI]
-
13. Gao YH, Wang DH, Hu FX, Huang QZ, Song YT, Yuan SK, et al. Low pressure reversibly driving colossal barocaloric effect in two-dimensional vdW alkylammonium halides. Nat Commun. 2024;15:1838.[DOI]
-
16. Li J, Barrio M, Dunstan DJ, Dixey R, Lou X, Tamarit JL, et al. Colossal reversible barocaloric effects in layered hybrid perovskite (C10H21NH3)2MnCl4 under low pressure near room temperature. Adv Funct Mater. 2021;31(46):2105154.[DOI]
-
17. Gao Y, Liu H, Hu F, Song H, Zhang H, Hao J, et al. Reversible colossal barocaloric effect dominated by disordering of organic chains in (CH3-(CH2)n-1-NH3)2MnCl4 single crystals. NPG Asia Mater. 2022;14:34.[DOI]
-
21. Lünser K, Kavak E, Gürpinar K, Emre B, Atakol O, Stern-Taulats E, et al. Elastocaloric, barocaloric and magnetocaloric effects in spin crossover polymer composite films. Nat Commun. 2024;15:6171.[DOI]
-
23. Li F, Niu C, Xu X, Li M, Wang H. The effect of defect and substitution on barocaloric performance of neopentylglycol plastic crystals. Appl Phys Lett. 2022;121(22):223902.[DOI]
-
25. Zeng M, Escorihuela-Sayalero C, Ikeshoji T, Takagi S, Kim S, Orimo SI, et al. Colossal reversible barocaloric effects in a plastic crystal mediated by lattice vibrations and ion diffusion. Adv Sci. 2024;11(26):2306488.[DOI]
-
26. Stern-Taulats E, Lloveras P, Barrio M, Defay E, Egilmez M, Planes A, et al. Inverse barocaloric effects in ferroelectric BaTiO3 ceramics. APL Mater. 2016;4(9):091102.[DOI]
-
29. Xiong T, Jiang R, Lin J, Zhou T, Shi G, Liu K, et al. Colossal barocaloric effect of water-ice phase transition. J Mater Sci Technol. 2026;259:44-51.[DOI]
-
30. Zhang Z, Li F, Xiong T, Zhang Z, Li B, Tong P, et al. Colossal barocaloric effects at triple-phase points. Energy Environ Mater. 2025;8(5):e70021.[DOI]
-
32. Petříček V, Dušek M, Palatinus L. Crystallographic computing system JANA2006: General features. Z Kristallogr Cryst Mater. 2014;229(5):345-352.[DOI]
-
33. Barnett JD, Block S, Piermarini GJ. An optical fluorescence system for quantitative pressure measurement in the diamond-anvil cell. Rev Sci Instrum. 1973;44(1):1-9.[DOI]
-
35. Ai Y, Gu ZX, Wang P, Tang YY, Chen XG, Lv HP, et al. Biodegradable ferroelectric molecular plastic crystal HOCH2(CF2)7CH2OH structurally inspired by polyvinylidene fluoride. Adv Mater. 2024;36(35):2405981.[DOI]
-
37. Soutzidou M, Masters AJ, Viras K, Booth C. The LAM-1 band in the low-frequency Raman spectra of even and odd monosubstituted n-alkanes. Phys Chem Chem Phys. 1999;1(3):415-419.[DOI]
-
39. Kuzmin VV, Kuznetsov SM, Novikov VS, Ustynyuk LU, Ivchenko PV, Nikolaeva GY, et al. Raman signatures of alkyl chain length: Comparative analysis of 1-alkanols and normal alkanes. Results Chem. 2024;7:101293.[DOI]
-
40. Xiong T, Lin J, Zhou T, Shi G, Ye T, Pan X, et al. Colossal barocaloric effect of phase-change fatty acids. Appl Phys Lett. 2024;125(6):061903.[DOI]
-
41. Mañosa L, González-Alonso D, Planes A, Barrio M, Tamarit JL, Titov IS, et al. Inverse barocaloric effect in the giant magnetocaloric La-Fe-Si-Co compound. Nat Commun. 2011;2:595.[DOI]
-
44. Samanta T, Lloveras P, Us Saleheen A, Lepkowski DL, Kramer E, Dubenko I, et al. Barocaloric and magnetocaloric effects in (MnNiSi)1-x(FeCoGe)x. Appl Phys Lett. 2018;112(2):021907.[DOI]
Copyright
© The Author(s) 2026. This is an Open Access article licensed under a Creative Commons Attribution 4.0 International License (https://creativecommons.org/licenses/by/4.0/), which permits unrestricted use, sharing, adaptation, distribution and reproduction in any medium or format, for any purpose, even commercially, as long as you give appropriate credit to the original author(s) and the source, provide a link to the Creative Commons license, and indicate if changes were made.
Publisher’s Note
Science Exploration remains a neutral stance on jurisdictional claims in published
maps
and institutional affiliations. The views expressed in this article are solely those
of
the author(s) and do not reflect the opinions of the Editors or the publisher.
Share And Cite


Science Exploration Style
Li L, Wang H, Fan X, Wang Y, Zhang K, Li B. Combined normal and inverse barocaloric effect materials. Thermo-X. 2026;2:202628. https://doi.org/10.70401/tx.2026.0029
Tips
Copy completed.
Submit a Manuscript
Author Instructions
Cite this Article
Article Metrics
0
View
0
Download
Cited
Article Updates

 Get citation
Science Exploration Style

Li L, Wang H, Fan X, Wang Y, Zhang K, Li B. Combined normal and inverse barocaloric effect materials. Thermo-X. 2026;2:202628. https://doi.org/10.70401/tx.2026.0029
copy
Share Link
copy