Engineering interfacial thermal conductance across BAs/Epoxy boundaries via surface termination control and covalent bridging

*Correspondence to:
Ruiqiang Guo, Thermal Science Research Center, Shandong Institute of Advanced Technology, Jinan 250103, Shandong, China.
E-mail: ruiqiang.guo@iat.cn
Thermo-X. 2027;3:202633. 10.70401/tx.2026.0036
Received: July 14, 2026Accepted: October 05, 2026Published: October 09, 2026
Abstract
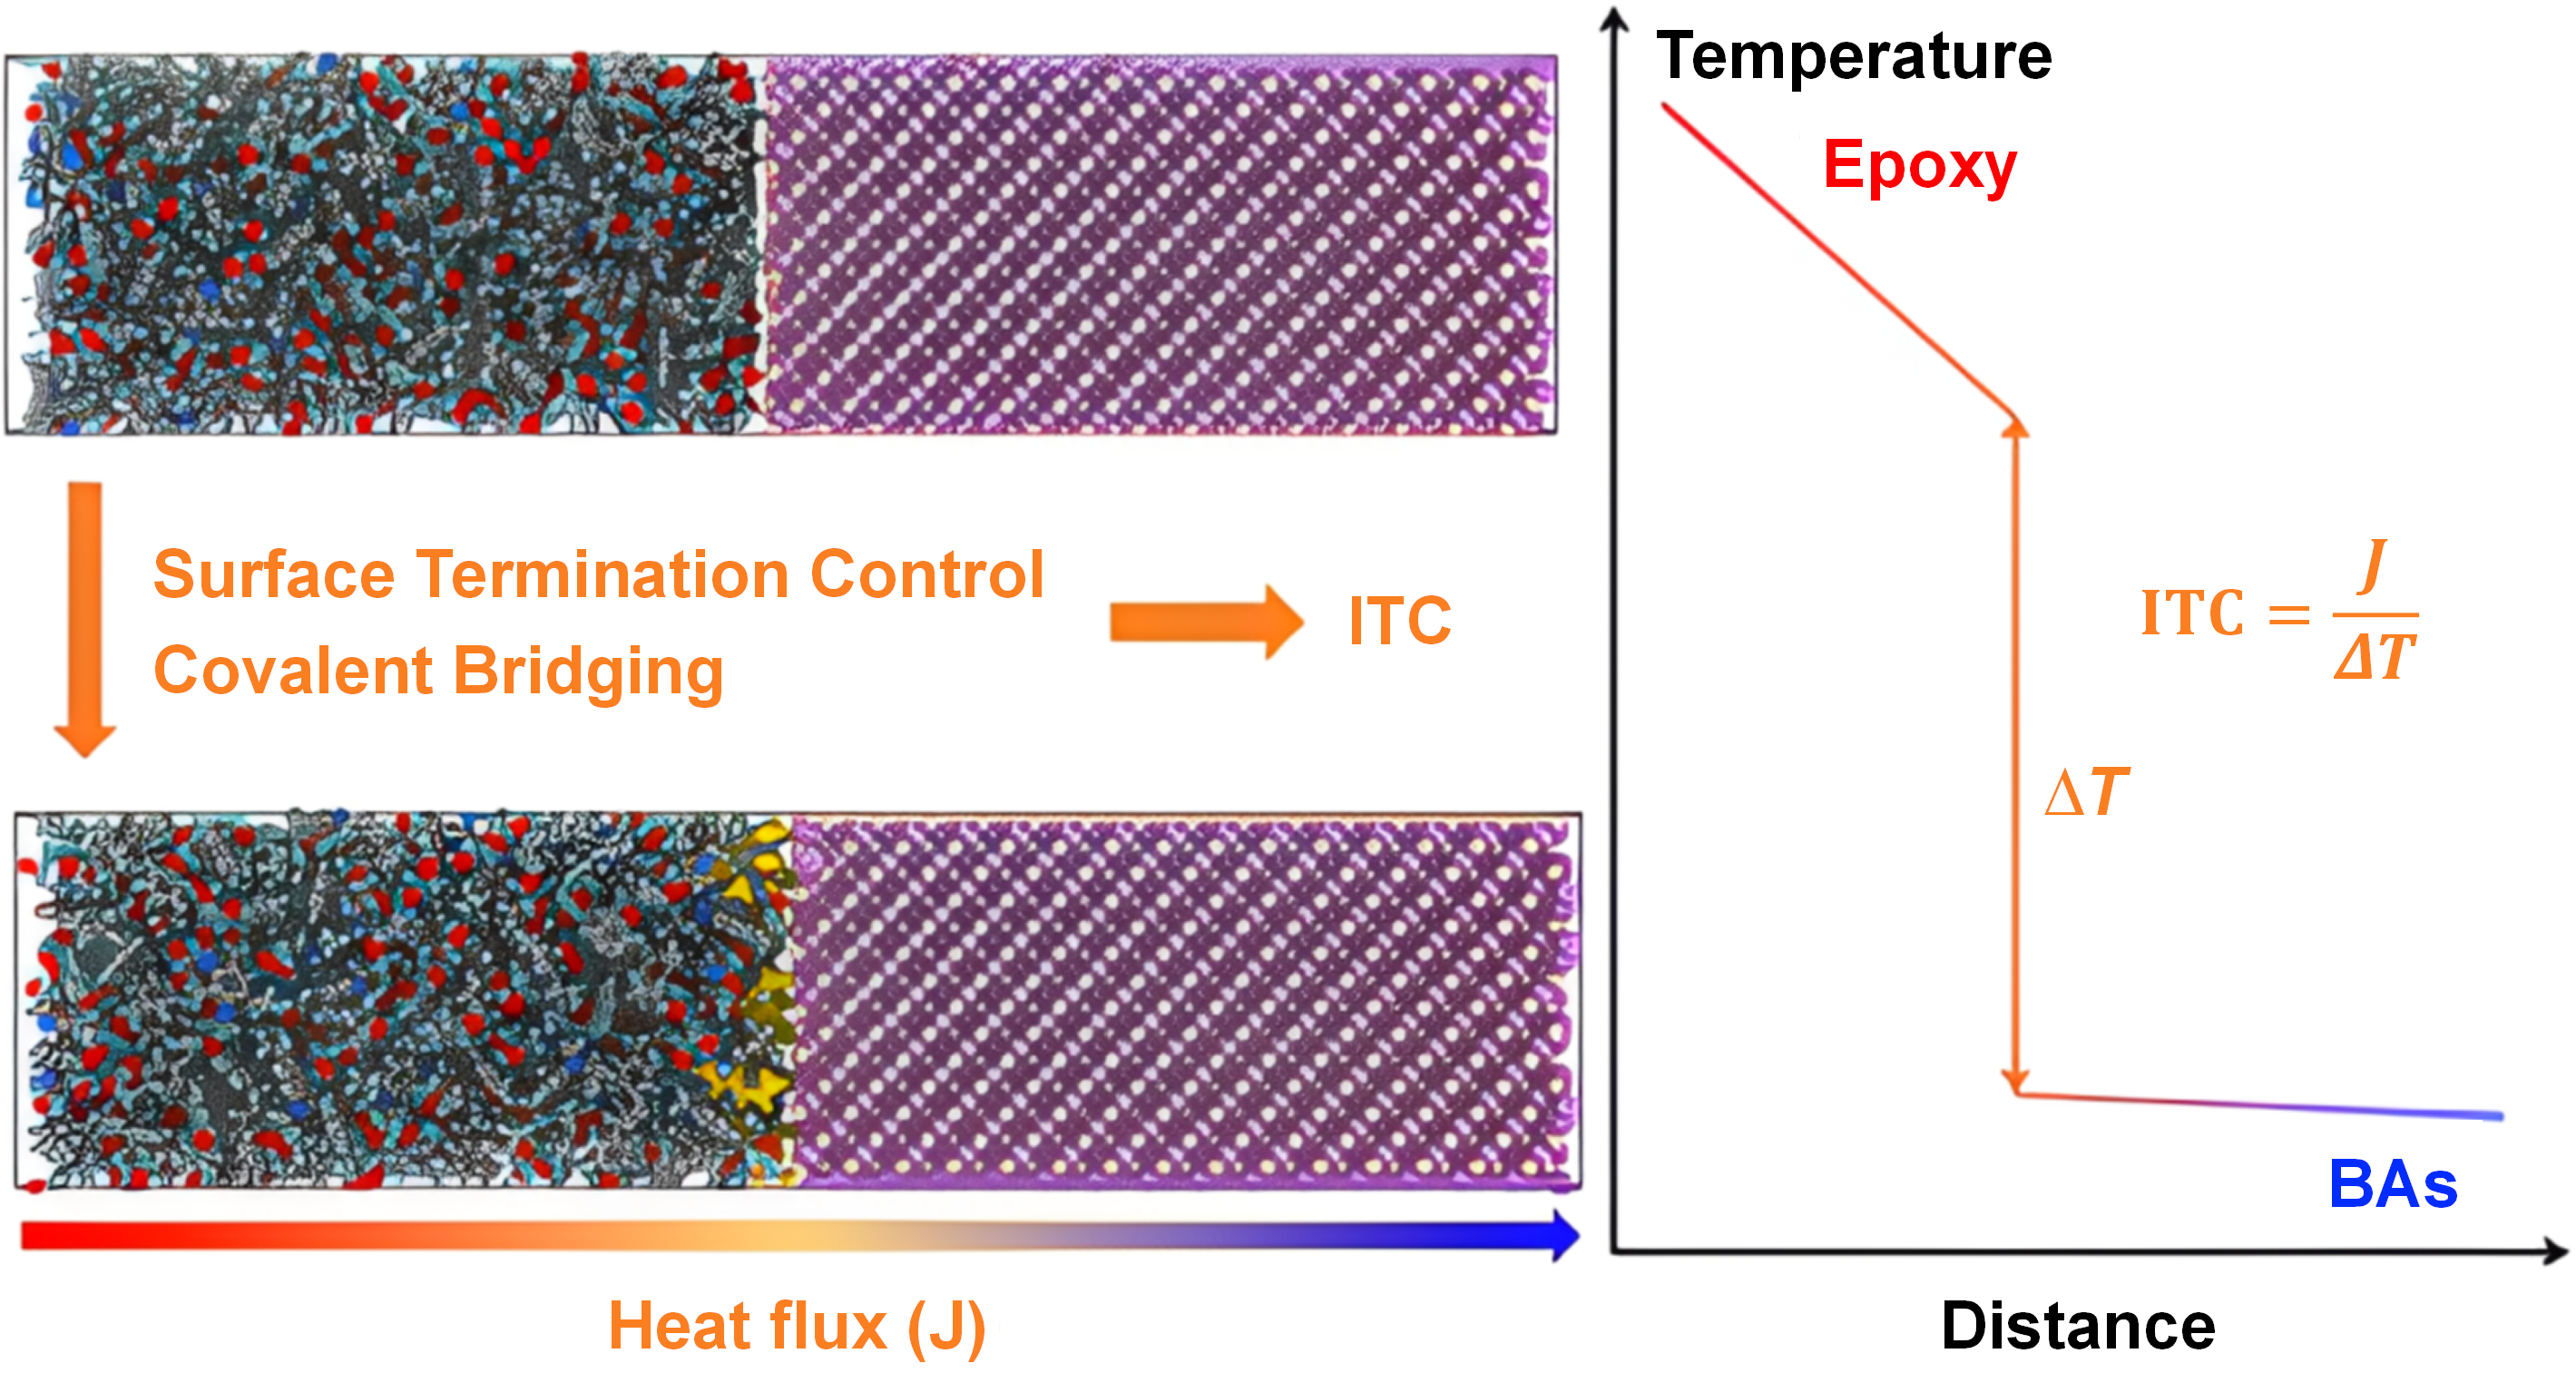
Cubic boron arsenide (BAs) is a promising filler for polymer-based thermal interface materials owing to its ultrahigh intrinsic thermal conductivity and electrically insulating nature. However, the interfacial thermal conductance (ITC) between BAs and polymer matrices has not been systematically quantified. Heat transport across BAs/epoxy interfaces was investigated by molecular dynamics simulations for five low-index surface terminations, and the calculated ITC varies by a factor of 1.72 among them. B-terminated interfaces systematically exhibit higher ITC than their As-terminated counterparts. The molecular functionalization of the surface shows that aminopropoxy functionalization at 16% coverage increases the ITC to 277 MW m-2 K-1, nearly twice that of the pristine B-terminated interface. Spectral analysis indicates that surface-bound functional groups act as vibrational bridges between BAs and epoxy, while covalent cross-linking with the epoxy network further strengthens the existing interfacial heat-transfer channels. The area-normalized interfacial coupling stiffness reveals that the termination dependence of ITC is governed by the strength of the cross-interface vibrational coupling. This work provides systematic quantitative data for BAs/polymer interfaces and shows that surface termination control and covalent functionalization can be combined to improve interfacial thermal conductance.
Graphical Abstract
Keywords
Boron arsenide, interfacial thermal conductance, molecular dynamics, surface functionalization, thermal interface materials
1. Introduction
Efficient heat dissipation is a central requirement for modern power electronics and radiofrequency devices, driving the search for materials that combine high thermal conductivity with electrical insulation[1]. Cubic boron arsenide (BAs) is one such material. First-principles calculations predicted an intrinsic lattice thermal conductivity (κ) as high as ~2,200 W m-1 K-1 when only three-phonon scattering was considered[2], a value rooted in the large acoustic-optical frequency gap that strongly suppresses three-phonon scattering channels. The inclusion of four-phonon processes subsequently revised this prediction downward to ~1,400 W m-1 K-1[3], and single-crystal experiments confirmed κ ≈ 1,000 ± 90 W m-1 K-1[4-6], surpassed only by diamond and the basal plane of graphite, with recent measurements on high-purity crystals further exceeding 2,100 W m-1 K-1[7] and on isotope-enriched crystals reaching ~1,500 W m-1 K-1[8]. Unlike two-dimensional high-κ materials such as graphene and hexagonal boron nitride, whose thermal conductivity is highly anisotropic and dominated by the in-plane direction, cubic BAs offers isotropic heat conduction. Moreover, unlike metallic graphene, BAs is a semiconductor with a bandgap of ~1.5 eV[4], making it effectively electrically insulating, which is a practical requirement for the thermal interface materials (TIMs) applications[9]. Refined predictions of phonon anharmonicity and temperature-dependent thermal conductivity have further established the thermal physics of BAs[10,11].
BAs has also been integrated into practical thermal management solutions. Kang et al. fabricated GaN-on-BAs high-electron-mobility transistors that gave a thermal boundary conductance of 250 MW m-2 K-1, lowering device-level hot-spot temperatures by ~60 K relative to diamond substrates under the same power density[12,13], and multiscale simulations traced this performance to well-matched lattice vibrations[1]. For polymer-matrix composites, Cui et al. showed that BAs microcrystal-polymer composites reach 21 W m-1 K-1 while remaining as compliant as soft tissue, reducing LED hot-spot temperatures by 45 K[14]. BAs/epoxy underfill composites have also been demonstrated, with effective κ rising from 0.250 to 0.416 W m-1 K-1 with filler loading[15], and BAs-based aramid nanofiber composites have further extended BAs fillers to flexible thermally conductive and electromagnetic-interference-shielding materials[16]. All of these studies, however, report macroscopic effective thermal conductivity and do not isolate the interfacial contribution from the bulk response, which is the quantity that ultimately limits composite performance when the filler has such high intrinsic κ.
At filler-matrix boundaries, a Kapitza resistance limits the effective thermal conductivity of polymer-matrix composites[17,18]. Models that include this resistance term predict lower composite κ than those that neglect it, and the discrepancy grows as the filler-to-matrix conductivity ratio increases[17,19,20], which is precisely the regime where BAs-filled polymers operate. Recent reviews of polymer-based TIMs have likewise identified interfacial thermal resistance (ITR) as one of the central obstacles to improving the overall thermal conductivity[21,22]. Several strategies have been developed to address this issue. Self-assembled monolayers grafted onto semiconductor surfaces enhance the interfacial thermal conductance (ITC) by up to 507% through improved vibrational coupling[23], and hierarchical hydrogen-bond networks boost graphene/polymer ITC by 6.22-fold[24]. Crystallographic-orientation engineering provides a third route, as different crystal facets and surface terminations present distinct atomic arrangements and binding sites, leading to systematic ITR variations at both semiconductor/organic and metal/ceramic interfaces[25,26].
To date, interfacial thermal transport involving BAs has been studied almost exclusively for inorganic interfaces. Wei et al. reported a thermal boundary conductance of 200-300 MW m-2 K-1 at the BAs/Si boundary from nonequilibrium molecular dynamics[27], and the GaN/BAs interfaces characterized by Kang et al.[12] and Wu et al.[1], together with the recently measured Ga2O3/BAs interfacial thermal conductance[28], provide additional inorganic-semiconductor data points. At BAs/polymer boundaries, however, neither the quantitative ITC nor the governing mechanisms have been established, despite BAs/epoxy composites already being fabricated for flexible TIMs[14] and underfill applications[15]. This knowledge gap is particularly critical because B and As atoms in the zinc-blende structure of cubic BAs exhibit drastically different surface chemistries. Different crystallographic orientations may therefore expose surface terminations with different surface chemistry, and how the interactions between these terminations and the epoxy network affect interfacial bonding and heat transport remains unclear at the molecular level.
Relying solely on non-covalent interfacial interactions is often insufficient to overcome the massive acoustic mismatch between a rigid inorganic crystal and a soft amorphous polymer. To further enhance phonon transmission across BAs/polymer interfaces, introducing strong chemical bonds at the interfaces is anticipated to be effective based on previous observations[29]. Covalent functionalization offers a targeted route to construct robust molecular thermal bridges that directly couple the distinct vibrational densities of states of the two phases. However, how the structural features of these molecular bridges (such as terminal cross-linking reactivity) govern interfacial phonon transmission in the BAs system remains an open question.
In this work, we used molecular dynamics simulations to study thermal transport across BAs/epoxy interfaces, a model system representative of BAs-based TIM composites. We first quantified the pristine ITC across five surface terminations of three principal crystal planes: (100)-B, (100)-As, (110), (111)-B, and (111)-As, revealing the fundamental role of surface termination in interfacial phonon coupling. Building upon the optimal (100)-B platform, we further engineered the boundary by anchoring five organic functional species at varying coverages (2%-16%). By analyzing the interface energy, interfacial coupling stiffness, vibrational density of states, and spectral heat conductance (SHC), we unraveled the synergistic enhancement mechanisms of surface termination and covalent bridging in governing interfacial heat transport.
2. Computational Methods
2.1 Construction of BAs/epoxy composite structures
Molecular dynamics simulations in this work were performed using the Large-scale Atomic/Molecular Massively Parallel Simulator (LAMMPS, 17 February 2022)[30] and GPUMD 4.1[31]. We built the amorphous cross-linked epoxy system from 130 molecules of diglycidyl ether of bisphenol F (DGEBF) and 65 molecules of diethyltoluenediamine (DETDA), as shown in Figure 1a. We modeled the epoxy network with the General Amber Force Field (GAFF), which provides bonded parameters for bonds, angles, dihedrals, and impropers, as well as Lennard-Jones (LJ) parameters for van der Waals interactions[32]. Atomic partial charges were computed using the AM1-BCC method in AmberTools (23)[33], and the resulting charges were used to describe Coulombic interactions. Initial topology files were generated with Moltemplate (2023-2-06)[34].
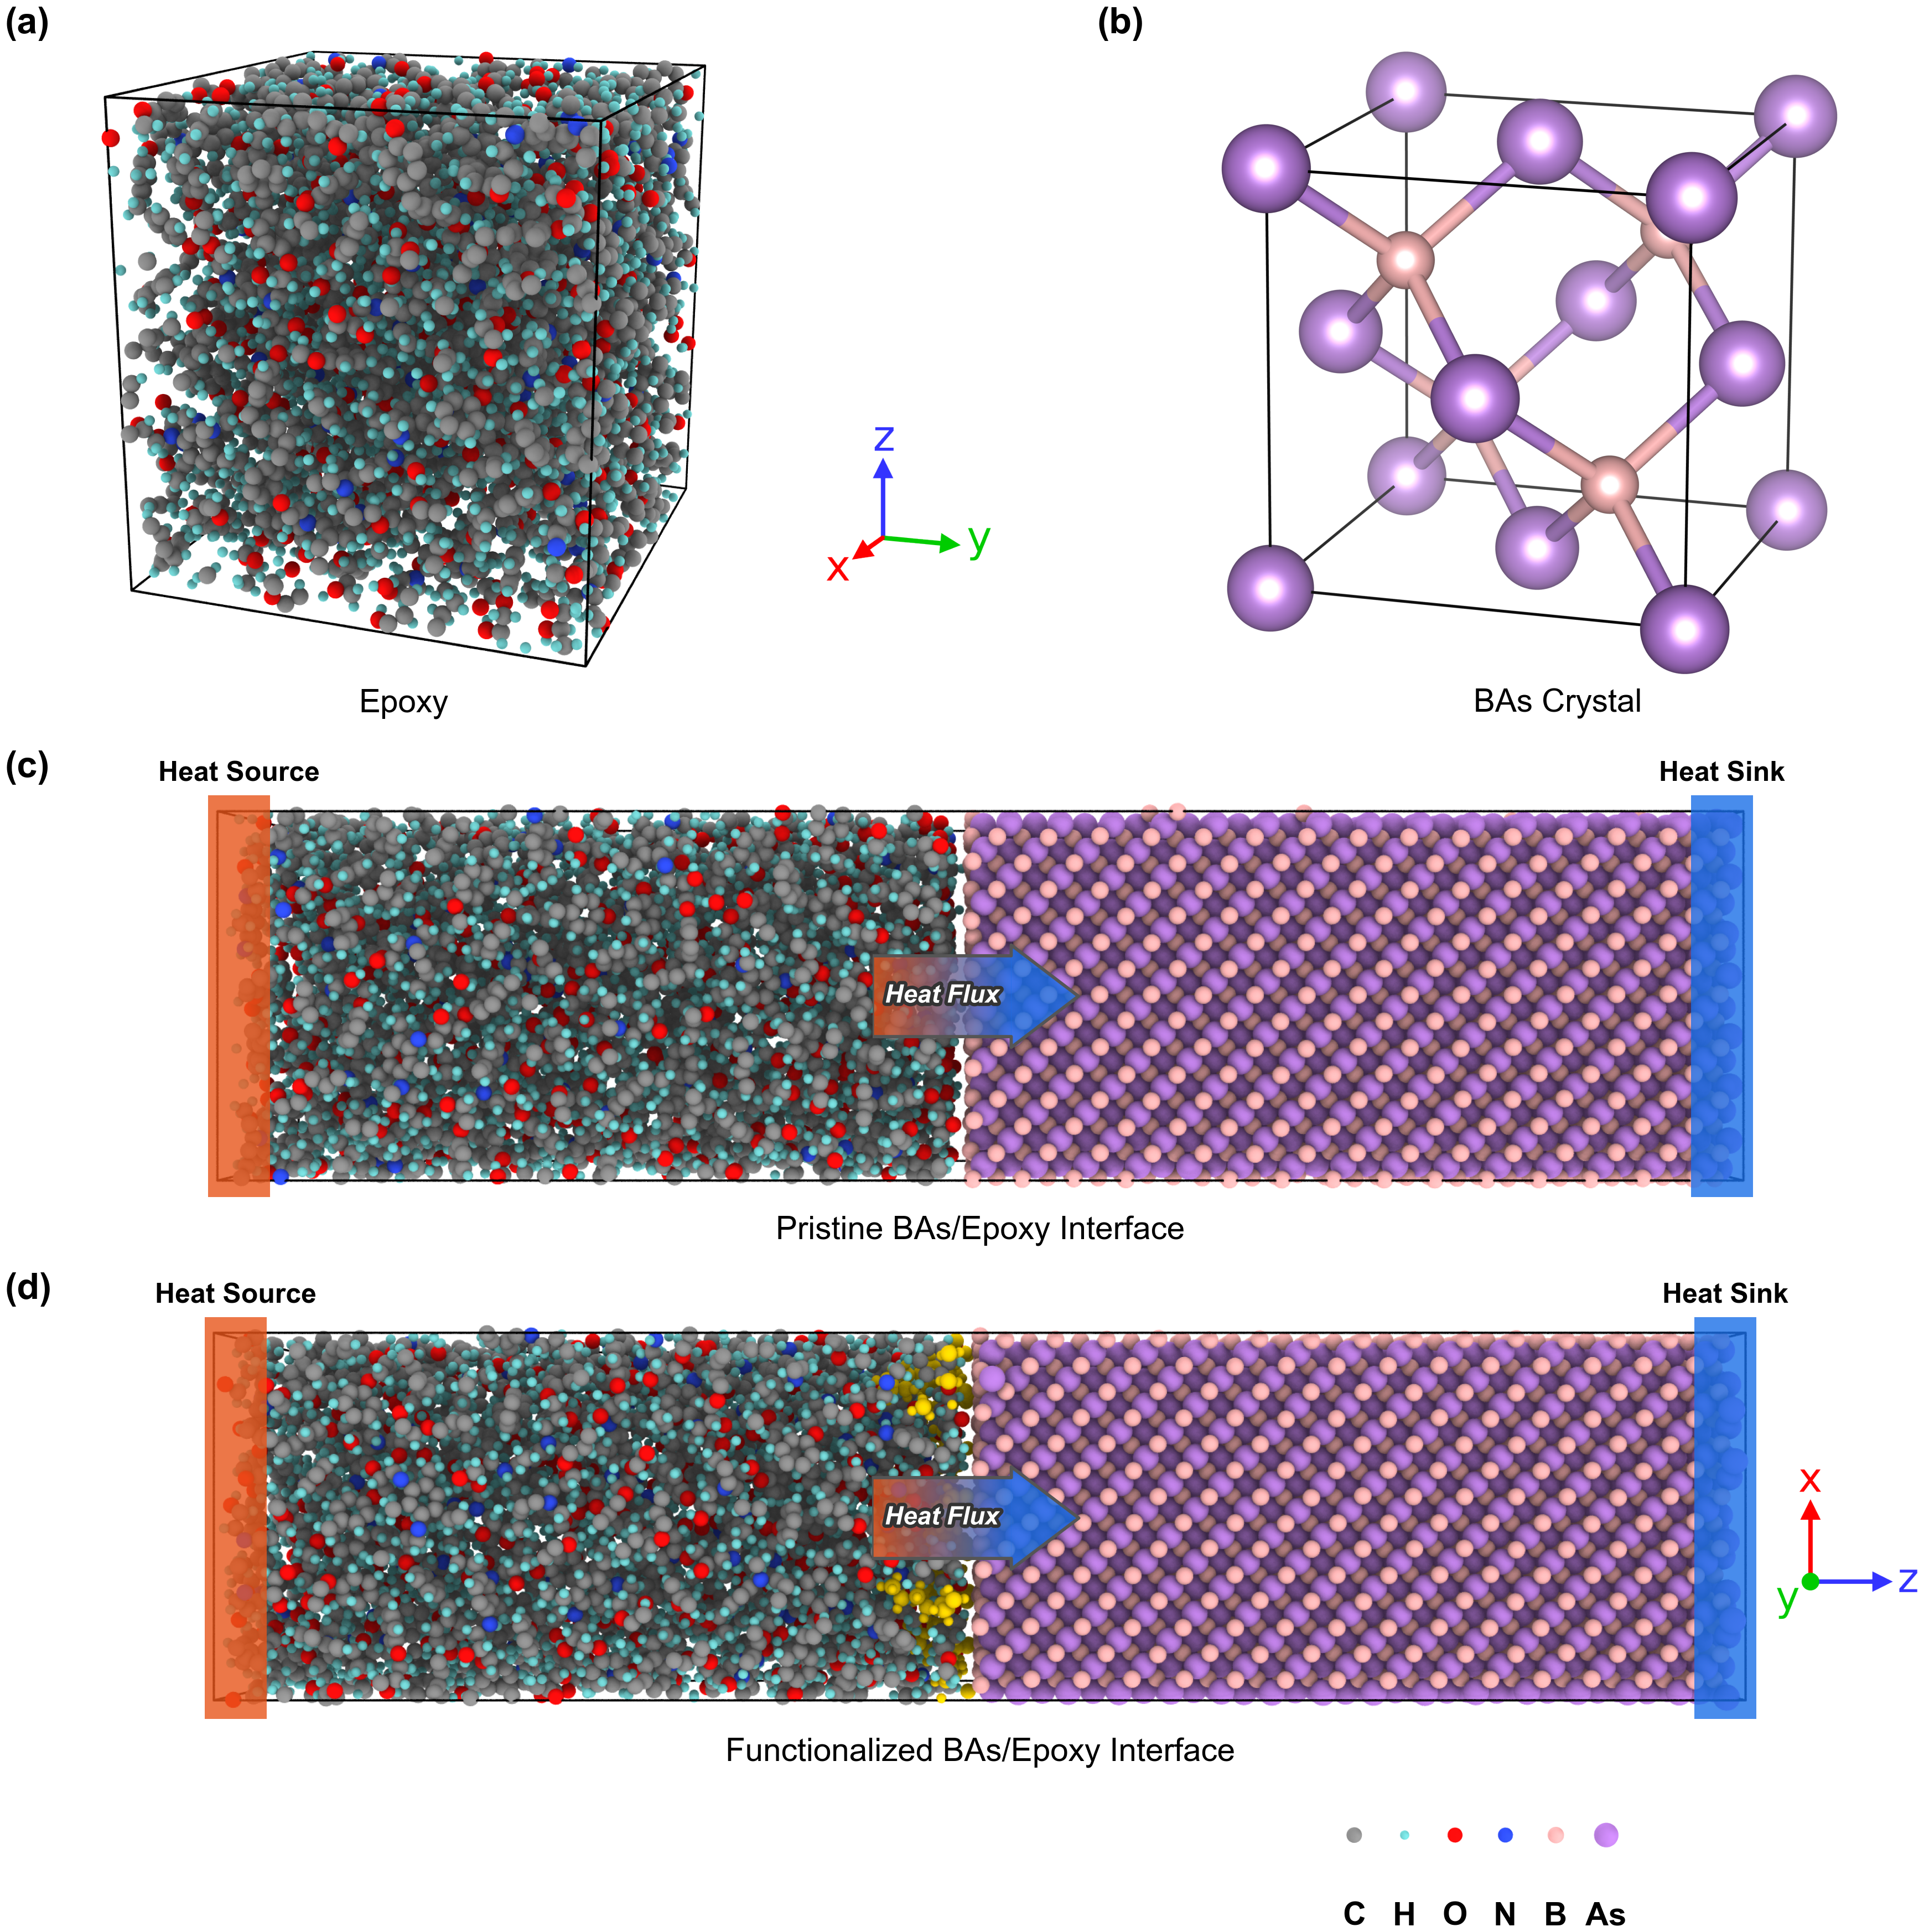
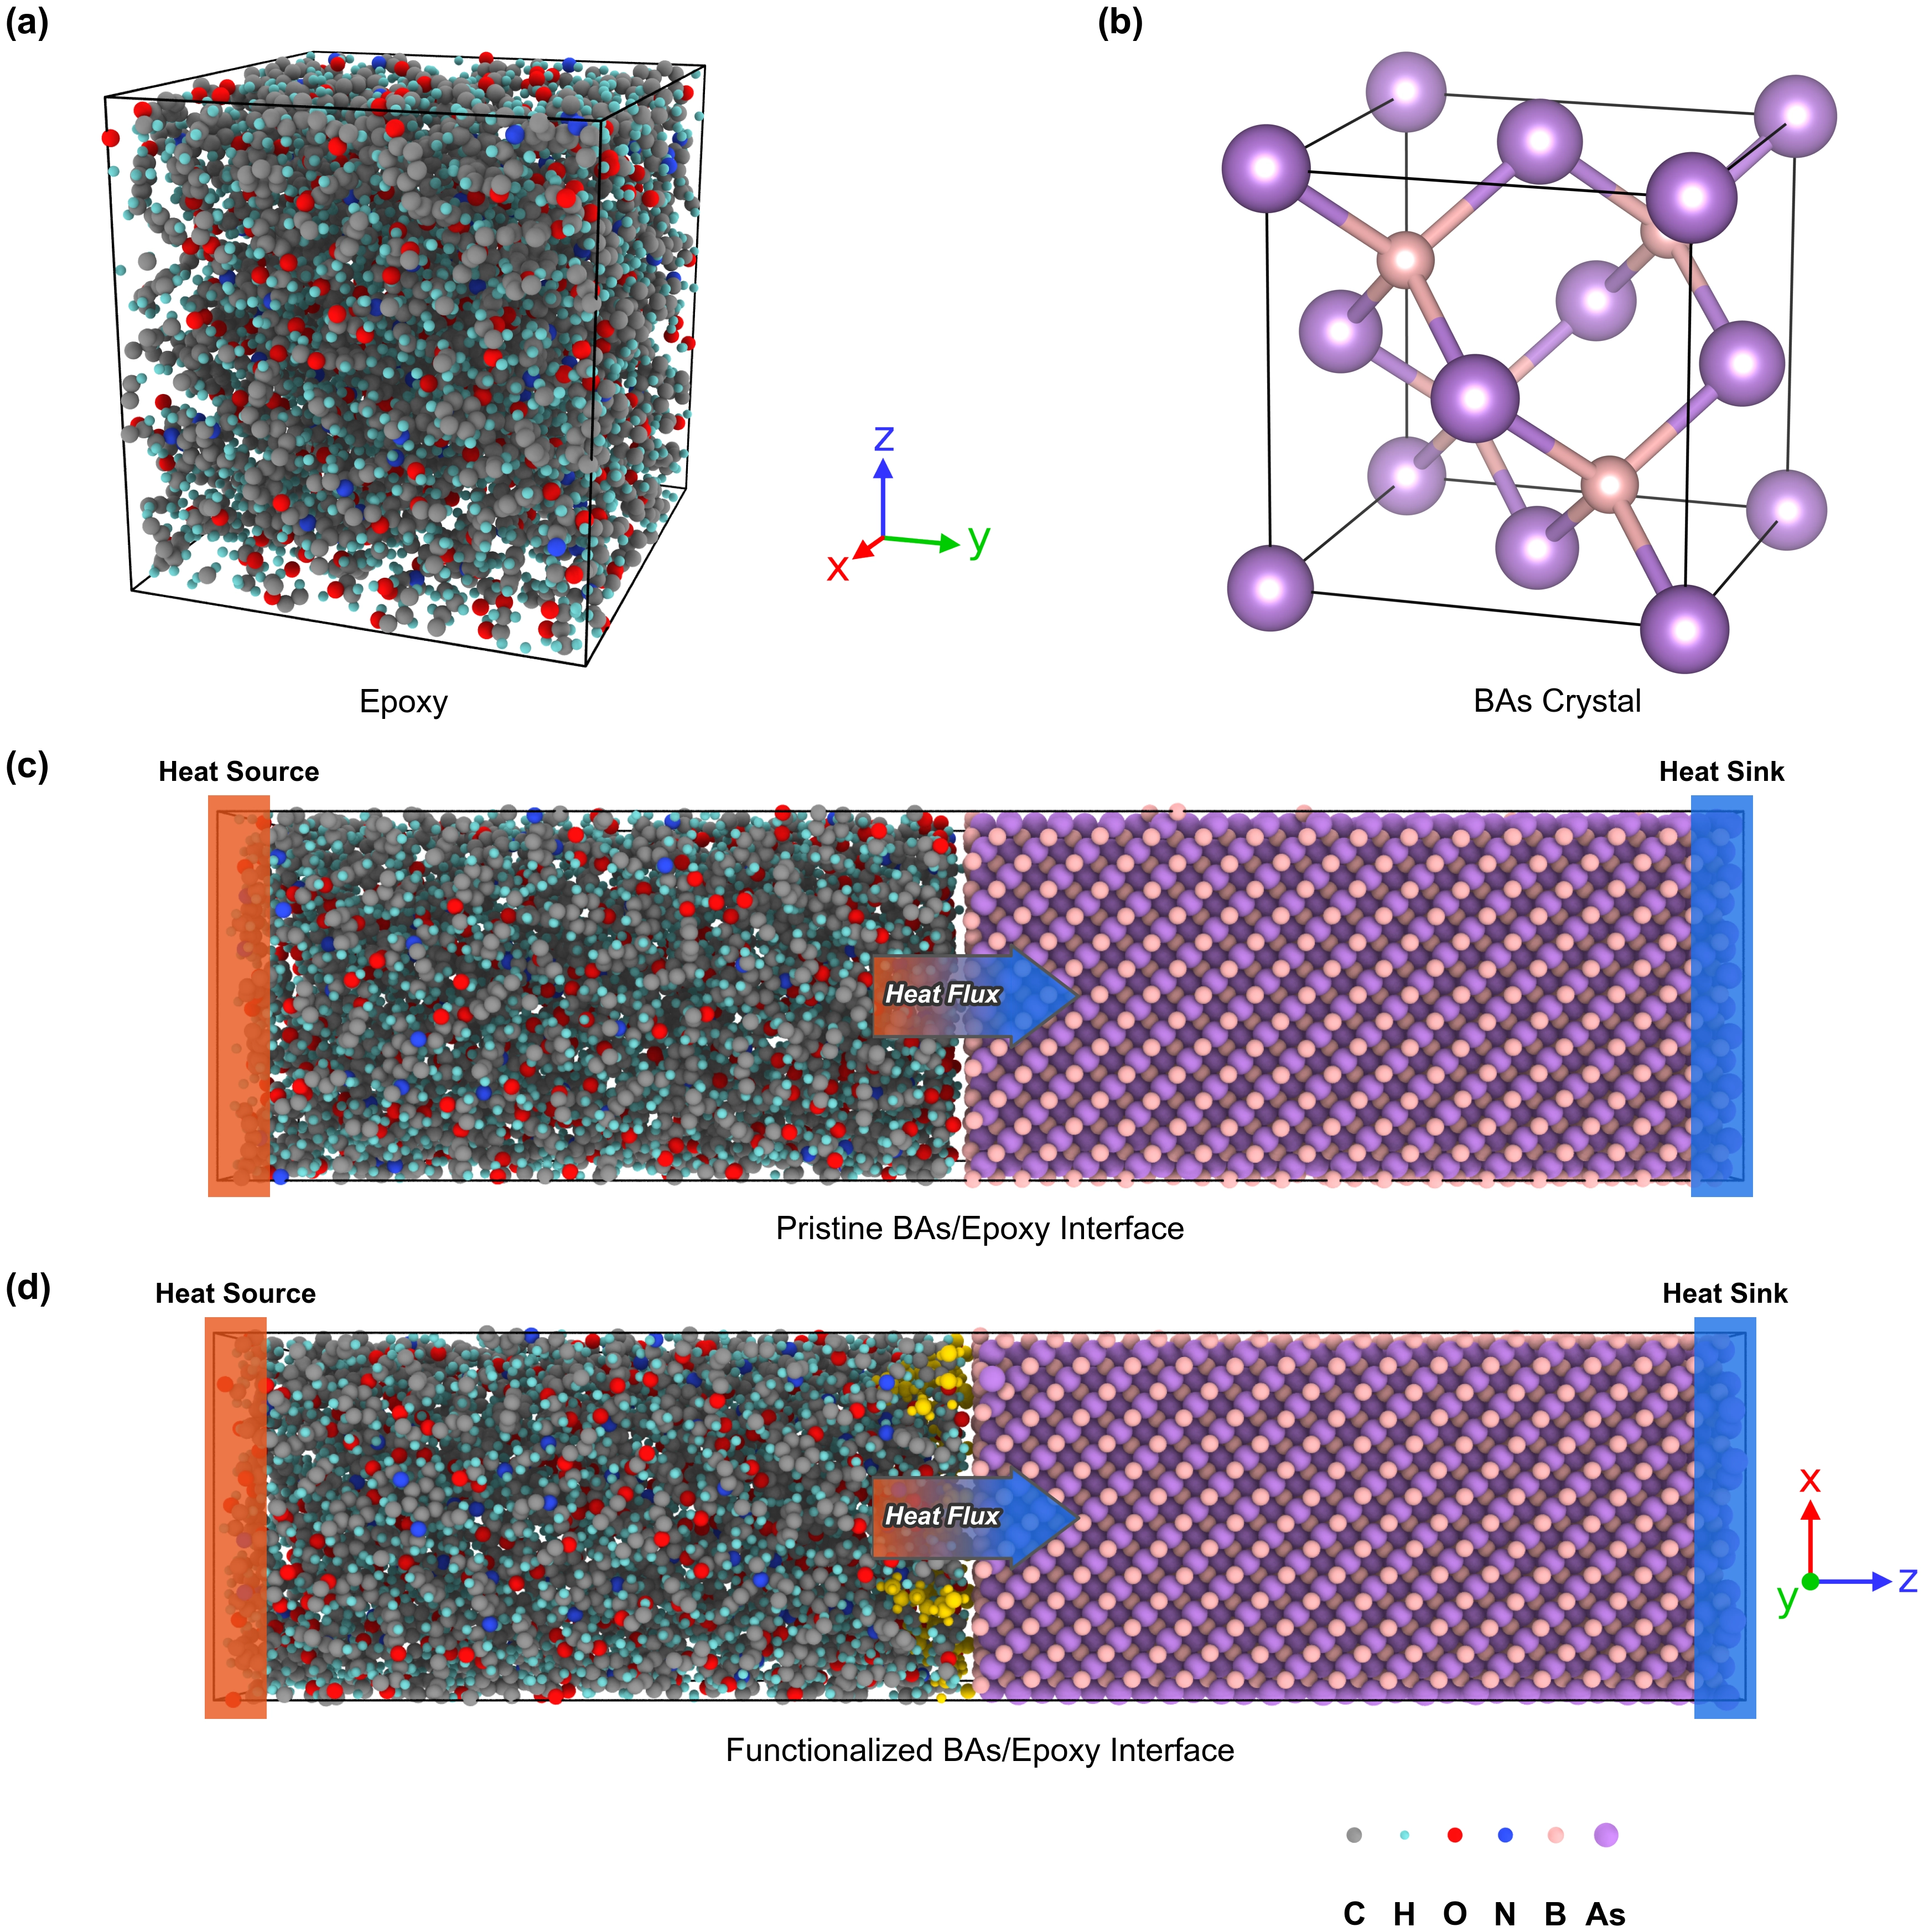
Figure 1. Atomic configurations of the BAs/epoxy composite system. (a) Pure cross-linked epoxy resin (DGEBF/DETDA); (b) Bulk BAs crystal in the zinc-blende structure; (c) Pristine BAs (100)-B/epoxy interface; (d) Functionalized BAs (100)-B/epoxy interface with -OC8H17 groups at 16% coverage, shown here as a representative long-chain alkoxy species. The -OC8H17 groups are highlighted in yellow for clarity. Cartesian axes are indicated in (b) and (d). BAs: boron arsenide; DGEBF: diglycidyl ether of bisphenol F; DETDA: diethyltoluenediamine.
We cross-linked the system using the fix bond/react command in LAMMPS[35], which models epoxy-amine curing reactions, including primary amine addition, secondary amine addition, and etherification, through a distance-based progressive cutoff algorithm. The cross-linking simulation followed a progressive-cutoff scheme with a target cross-linking degree of 80%. After cross-linking, we annealed the system from 900 K to 300 K under NPT to relieve residual stress. The equilibrated density of 1.145 g/cm3 agreed with reported values of ~1.1-1.2 g/cm3 for cross-linked epoxy[36,37], confirming that the model captures the polymer packing correctly.
As shown in Figure 1b, the BAs crystal has a zinc-blende structure with a space group of
We constructed the BAs/epoxy interface by placing the cross-linked epoxy block adjacent to the BAs slab along the z-direction, as shown in Figure 1c. A hybrid pair style was used to describe the interfacial system. The internal interactions within BAs were modeled using the Tersoff potential[39,40], whereas the organic epoxy network was described by lj/charmm/coul/long. The nonbonded interactions between BAs and epoxy were represented by LJ and Coulombic terms. The LJ parameters for B and As were adopted from the parameterization reported by Mayo et al.[41], and cross-interactions between the BAs slab and the epoxy network were generated using the Lorentz-Berthelot combining rules, with σ calculated as the arithmetic mean and ε as the geometric mean[36]. The partial charges of B and As were derived from the Universal Force Field (UFF) charge-equilibration scheme[42], yielding small but nonzero values of + 0.02 e for B and -0.02 e for As. Thus, the BAs-epoxy interfacial interaction includes both van der Waals contributions and electrostatic contributions associated with the partial charge difference between B and As. Long-range electrostatics were treated using the particle-particle particle-mesh solver developed by Hockney, Goel, and Eastwood[43] with an accuracy of 10-4. Periodic boundary conditions were applied in the x-y plane. The final system contained approximately 14,000 atoms and had a total z height of about 139 Å. The assigned charges and LJ parameters are summarized in Table 1.
Table 1. Atomic parameters for B and As atoms used in the BAs-epoxy cross-interactions.
| Atom | Charge (e) | ε (kcal/mol) | σ (Å) |
| B | +0.02 | 0.095 | 3.5814 |
| As | -0.02 | 0.410 | 3.6972 |
BAs: boron arsenide.
For functionalized interfaces, the epoxy was assembled onto a BAs surface pre-modified with anchoring functional groups (Figure 1d). Five organic functional groups were investigated to be anchored to B atoms on the (100)-B surface via B-O covalent bonds. The selected species include a hydroxyl group (-OH), two pure alkoxy groups of different chain lengths (-OC4H9 and -OC8H17), and two aminoalkoxy (-OC3H6NH2 and -OC7H14NH2). Two variables were targeted in this molecular set: alkyl chain length and the presence of a terminal amine. Alkoxy anchoring through B-O bonds follows the covalent functionalization chemistry established for hydroxyl and alkoxy groups on h-BN surfaces[44]. To the best of our knowledge, no experimental study has yet demonstrated the equivalent B-O grafting chemistry on BAs, and the functionalized interfaces investigated here are therefore regarded as a computational exploration of the analogous anchoring chemistry on BAs. The aminoalkoxy species allow evaluation of covalent cross-linking with the epoxy matrix. We set coverages to 2%, 4%, 8%, and 16%, defined as the fraction of the B atoms in the first atomic layer of the BAs(100)-B surface that carry anchored groups, yielding a total of 20 functionalized configurations. The B-O covalent bonds formed between BAs surface boron atoms and functional-group oxygen atoms were described by the UFF[42], while the rest of the organic functional groups retained their GAFF parameters. This hybrid approach provided robust periodic-table force field parameters suitable for modeling B-O covalent bonds at ceramic/organic interfaces.
We performed density functional theory (DFT) calculations using the Vienna Ab initio Simulation Package (VASP, 6.3.2)[45] with the exchange-correlation interaction described by the Perdew-Burke-Ernzerhof functional[46], the ion-electron interaction treated using the projector augmented wave method[47], and dispersion interactions included through the DFT-D3 dispersion corrections[48]. A plane-wave cutoff of 500 eV was used throughout. We optimized the geometry of the BAs primitive cell with an 11 × 11 × 11 Monkhorst-Pack k-point mesh, a force convergence criterion of 0.005 eV/Å, and an electronic self-consistency threshold of 10-7 eV. Phonon dispersion relations were computed via density functional perturbation theory (DFPT)[49] using a 3 × 3 × 3 supercell with a 5 × 5 × 5 k-point mesh, electronic convergence tightened to 10-8 eV, and post-processing through Phonopy (2.38.0)[50]. These DFT results serve as reference data for validating the empirical potentials described below.
BAs was described by the Tersoff three-body potential[39,40],
where fC is a cutoff function of the distance rij between i-th and j-th atoms,
and bij is a many-body bond-order parameter that modulates the attractive pair interaction according to the local coordination environment,
Here, ξij is the effective coordination number and θijk is the angle between bonds ij and ik. The prefactor χ strengthens or weakens heteropolar bonds[39]. The BAs parametrization by Benkabou et al.[40] was adopted, with all parameters listed in Table 2.
Table 2. Tersoff potential parameters for BAs from Benkabou et al.[40].
| Parameter | Value | Unit |
| A | 3,469.00 | eV |
| B | 320.00 | eV |
| λ1 | 3.10 | Å-1 |
| λ2 | 1.60 | Å-1 |
| β | 1.10 × 10⁻⁶ | - |
| n | 0.72 | - |
| c | 100,390.00 | - |
| d | 16.217 | - |
| h | -0.59825 | - |
| R | 2.395 | Å |
| D | 0.15 | Å |
BAs: boron arsenide.
To assess the accuracy of this empirical potential, we also computed BAs phonon dispersion using the Tersoff parametrization with Phonopy[50], obtaining force constants via the frozen-phonon method with a 10 × 10 × 10 supercell. We determined the equilibrium lattice constant, bulk modulus, and its pressure derivative by fitting the energy-volume curve to the third-order Birch-Murnaghan equation of state[27].
2.2 Thermal conductivity calculations
The thermal conductivities of BAs and pure epoxy were computed separately via the Green-Kubo relation[51,52] from equilibrium molecular dynamics (EMD) simulations:
where V is the system volume, T is the temperature, kB is the Boltzmann constant, Jα is the α component of the heat current, and ⟨J (τ) · J (0)⟩ is the heat current autocorrelation function (HCACF) of time τ. The bracket denotes an ensemble average. Standard virial-based heat flux in LAMMPS is known to be inaccurate for many-body potentials such as Tersoff[53,54]. EMD calculations for BAs were therefore performed with GPUMD 4.1[31], which implements the full many-body heat flux formulation of Fan et al.[54]. Two supercell sizes were used to assess finite-size effects: 5 × 5 × 5 (1,000 atoms) and 7 × 7 × 7 (2,744 atoms). At each temperature (300, 500, 700, or 900 K), 12 independent simulations were performed. Each simulation was divided into an equilibration phase and a production phase. The equilibration phase proceeded through three sequential stages: NPT equilibration at 0 bar for 200 ps, NVT equilibration for 200 ps, and NVE equilibration for 1 ns, all at a time step of 1.0 fs. The production phase was then conducted under the NVE ensemble, with the HCACF sampled every 10 steps using correlation lengths of 2 ns (300 K), 1 ns (500 K), 600 ps (700 K), or 500 ps (900 K). For the epoxy, the standard virial heat flux formulation was directly applicable since GAFF is predominantly a two-body force field, and the κ of the epoxy was computed in LAMMPS. Twelve production trajectories each began with NPT equilibration at 1 atm for 1 ns, followed by NVT equilibration for 250 ps and NVE equilibration for 2.5 ns at 300 K with a time step of 0.5 fs. The production runs were carried out under NVE with the HCACF sampled every 10 steps and a correlation length of 1 ns, yielding a total of 240 correlation windows. The final κ was obtained by averaging the plateau region between 10 and 500 ps[55].
As shown in Figure 1c,d, ITC was calculated via Langevin-driven NEMD. Langevin thermostats[56] were applied at both ends of the system along the z-direction to maintain a hot zone at 380 K and a cold zone at 220 K, both with a damping constant of 150 fs. Each thermostat zone spanned three bins (~8.4 Å each), with atoms in the central region evolving freely under NVE. The simulation cell was periodic in all three directions, and the outermost atomic layers at both z ends were held fixed, so no atomic exchange occurs across the z boundary. The temperature profile was collected by dividing the system into 50 slabs along z. The steady-state heat flux J was obtained from the cumulative energy exchange at the Langevin reservoirs. ITC (G) was computed as[27],
where ΔTinterface is the temperature discontinuity at the interface extracted from the steady-state profile. The ITR is R = 1/G. The NEMD simulation began with energy minimization, followed by NVT equilibration of the transport region at 300 K for 500 ps using a Nosé-Hoover thermostat[57,58] with a temperature damping constant of 50 fs, Langevin pre-equilibration for 1.5 ns, and finally a production run for 2 ns. A velocity-Verlet integration scheme with a time step of 0.5 fs was used throughout. Each interfacial configuration was simulated with 10 independent trajectories generated with distinct velocity seeds, and the reported ITC values and error bars represent the standard error of the mean across these trajectories. The ten trajectories of each configuration start from the same energy-minimized structure but are assigned distinct initial velocity seeds and Langevin random-force seeds and are equilibrated independently, so each production run begins from an independently equilibrated initial configuration. To assess the contribution of electrostatic interactions, we performed charge-removal control simulations, in which the interface configuration and all simulation parameters were kept unchanged, only the charges of B and As were set to zero while the epoxy charges were retained, and the simulations started from NPT and NVT equilibration and proceeded through Langevin pre-equilibration and NEMD production in the same way as the original systems, with ten independent trajectories for each of the five pristine interfaces.
To quantify BAs-epoxy adhesion, we calculated the interface energy[59,60] by:
where Ainterface is the cross-sectional area, Etotal is the potential energy of the complete interface system, and EBAs and Eepoxy are the energies of the isolated fragments extracted from the equilibrium configuration. In this definition, a negative Eint indicates a thermodynamically stable interfacial binding, whereas a positive value suggests unfavorable contact. All energy terms were evaluated on interface models by averaging over 30 snapshots collected during NVE production runs at 300 K.
2.3 Vibrational and spectral analysis
The vibrational density of states (VDOS, g(ω)) was obtained from the Fourier transform of the velocity autocorrelation function (γ(t))[29]:
here ω is the frequency, vi(t) denotes the velocity of the i-th particle at time t, and the brackets signify an ensemble average.
Velocity trajectories were collected from separate NVE simulations. Atoms were partitioned into three regions based on distance from the interface, comprising BAs within ~5 Å, epoxy, and functional groups. Area-normalized VDOS were then computed for each region. The degree of phonon spectral overlap between two components was quantified by the correlation factor S[24],
where S ∈ [0,1], with larger values indicating better spectral matching.
The interfacial spectral heat current (q(ω)) was calculated by the many-body spectral decomposition method of Sääskilahti et al.[61],
where
Beyond the spectral decomposition, the same type of force constants was used to quantify the static coupling strength of the interface. Following the cross-interface force-coupling descriptor of Liu et al.[62], we define the area-normalized interfacial coupling stiffness KA as:
where L and R denote the atom sets of the organic side and the BAs side in the interfacial region, the summation runs over all cross-material atom pairs,
All atomic structure renderings were generated using OVITO 3.11.0[63] through its Python scripting interface.
3. Results and Discussion
3.1 Potential validation and bulk properties
We first assessed the accuracy of the Tersoff potential with the BAs parametrization of Benkabou et al.[40]. The same Tersoff parametrization was previously validated by Wei et al.[27] for BAs phonon dispersion and elastic properties with comparable accuracy. As shown in Figure S1a, our computed phonon dispersion reproduces the acoustic branches of the DFPT reference[49] well and captures the large acoustic-optical frequency gap characteristic of high-κ BAs[2], confirming that the dominant heat-carrying modes are well described. The optical branches, however, lie noticeably above the DFPT values, a deviation also reported by Wei et al.[27] for the same potential. The energy-volume curve in Figure S1b, fitted to a Birch-Murnaghan equation of state[27], gives α0 = 4.777 Å, consistent with the experimental value of 4.77 Å[40]. The fitted bulk modulus B0 = 148 GPa is likewise close to the experimental ~152 GPa[40], and B′0 = 4.24. The deviations are small enough for reliable dynamical calculations, with the lattice constant and bulk modulus both within 3% of the experimental values. As reported previously, the optical phonons contribute little to the lattice thermal conductivity of BAs because their group velocities are small and the wide acoustic-optical gap strongly suppresses acoustic-optical scattering channels[2]. And thus, the dominant heat carriers are acoustic phonons, which are well reproduced, indicating that this empirical potential provides an acceptable description for BAs-based thermal transport simulations. Beyond the bulk properties, the surface energies of the five low-index surfaces, the surface reconstruction of the B-terminated faces, and the interaction between a DGEBF molecule and the BAs(100)-B surface have further been examined with this potential and compared with DFT calculations, as detailed in the Supplementary materials.
Bulk BAs thermal conductivity was computed via the Green-Kubo EMD method[51,52] using GPUMD[31]. At 300 K, the 5 × 5 × 5 and 7 × 7 × 7 supercells yield κ = 1,127.9 ± 121.1 and 1,030.0 ± 122.1 W m-1 K-1, respectively (Figure 2). The ~10% difference is attributed to a finite-size effect, as longer-wavelength phonons are more strongly constrained by periodic boundaries in the smaller cell. As temperature rises, κ decreases following the κ ∝ T-1 scaling expected when Umklapp scattering dominates[4], and above 700 K the two supercell sizes converge to within 2%. The full convergence curves are provided in Figure S2.
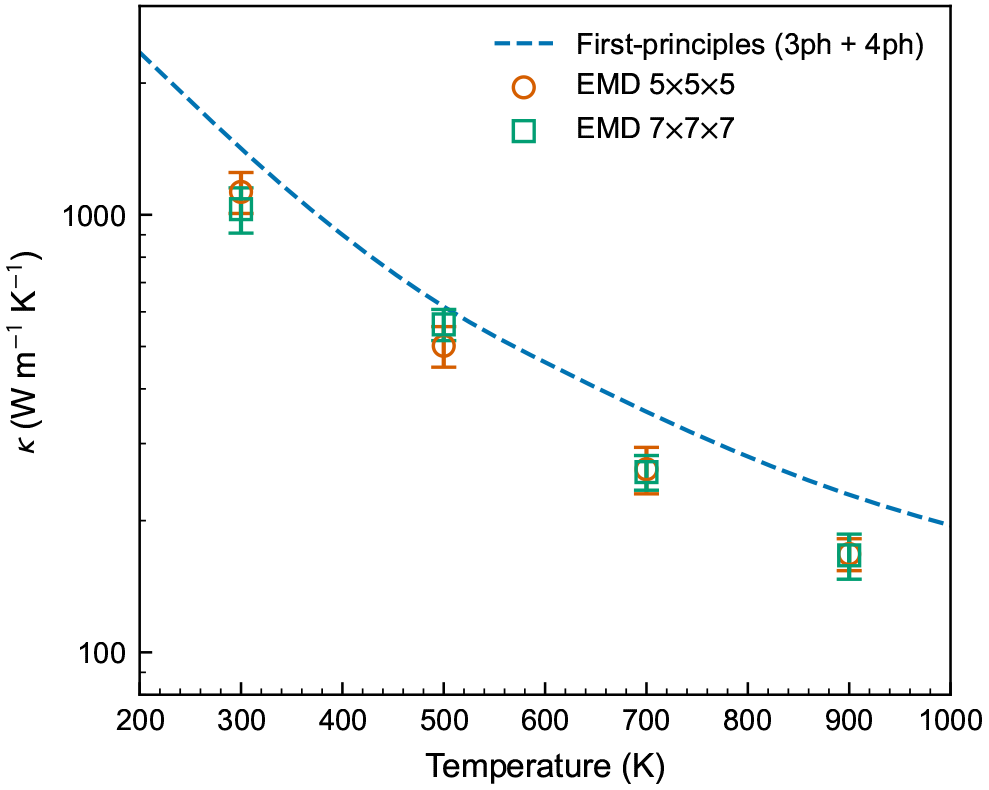
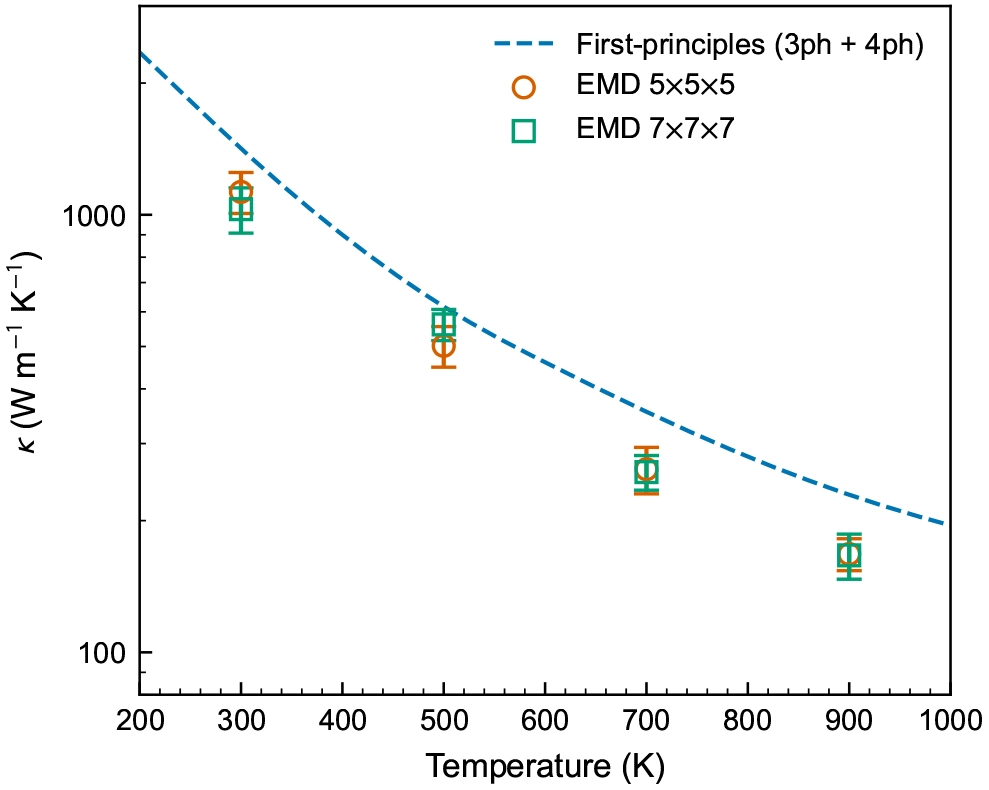
Figure 2. Thermal conductivity of bulk BAs as a function of temperature. The dashed line represents first-principles calculations from Feng et al.[3]. Open symbols denote EMD results from this work: 5 × 5 × 5 supercell (circles) and 7 × 7 × 7 supercell (squares). Error bars represent the standard error of the mean. BAs: boron arsenide; EMD: equilibrium molecular dynamics.
The 300 K EMD results (~1,030-1128 W m-1 K-1) fall below both the three-phonon prediction of Lindsay et al. (~2,200 W m-1 K-1)[2] and the three-plus-four-phonon calculation of Feng et al. (~1,400 W m-1 K-1)[3], and lie slightly above the experimental measurement of 1,000 ± 90 W m-1 K-1 by Li et al.[4]. To quantify the deviations at individual temperatures, Figure S3 shows the deviation of the EMD κ from the first-principles reference (Feng et al.) as a function of temperature for both supercell sizes. The deviation grows from about -20% to -27% at 300 K to about -30% at 700-900 K and remains within about 30% at all temperatures. This trend can be understood from the frequency distribution of the potential error, as vibrational modes of higher frequency become more strongly thermally populated at higher temperatures, and it is exactly in this frequency range that the Tersoff parametrization deviates most strongly from the DFPT reference (Figure S1a). The growth of the deviation with temperature therefore has a clearly identified, frequency-localized origin. They are also lower than the EMD results of Wei et al. obtained with the same Tersoff potential using LAMMPS[27]. This discrepancy arises because GPUMD implements the full many-body heat flux formulation[54], whereas the standard virial-based heat flux in LAMMPS tends to overestimate κ for many-body potentials[53,54]. While classical MD utilizing a uniform average atomic mass inherently neglects both quantum statistical effects and mass-disorder-induced isotope scattering (natural B contains ~20% 10B and ~80% 11B), the resulting theoretical baseline is highly self-consistent[4]. We note that all interfacial NEMD simulations in this work were performed within the 220-380 K temperature window (shaded region in Figure S3), which is adjacent to the temperature range of best agreement with the experimental and first-principles references and is far from the high-temperature regime where the deviation grows. Since the present study focuses on relative ITC enhancements across different interface configurations, the systematic baseline robustly supports our comparative conclusions.
For the cross-linked epoxy, the EMD approach gave κ = 0.284 ± 0.006 W m-1 K-1 at 300 K (Figure S4), within the experimentally reported range of 0.2 to 0.3 W m-1 K-1 for epoxy resins including EPON-862/DETDA[36]. Consequently, the intrinsic thermal conductivities of BAs and epoxy differ by more than three orders of magnitude. In a macroscopic BAs/epoxy composite, this extreme transport disparity dictates that heat dissipation will be bottlenecked by the ITR, underscoring the critical need to understand how crystallographic orientation and surface chemistry govern heat transfer across this boundary.
3.2 Pristine BAs/Epoxy interfaces: Crystallographic-orientation and surface-termination dependence
With the force fields validated and bulk properties established, we now turn to the central question of this study: how thermal transport across the BAs/epoxy interface depends on crystallographic orientation and surface termination. Five pristine interfaces formed by three principal crystallographic planes were examined: (100)-B, (100)-As, (110), (111)-B, and (111)-As, where the (100) and (111) planes present both B- and As-terminated variants and the (110) plane contains B and As atoms in the same plane.
The calculated ITC values span a considerable range, from 74 MW m-2 K-1 on (111)-As to 128 MW m-2 K-1 on (100)-B, corresponding to a 1.72-fold variation, as shown in Figure 3a. On the (100) and (111) planes, B-terminated faces consistently yield higher ITC than As-terminated ones. The difference is 60% on the (100) plane, where (100)-B yields 127.6 MW m-2 K-1 versus 79.7 MW m-2 K-1 for (100)-As, and 22% on (111), where (111)-B gives 90.9 MW m-2 K-1 versus 74.2 MW m-2 K-1 for (111)-As. The (110) surface, on which B and As atoms are coplanar, gives an intermediate ITC of 88.9 MW m-2 K-1. ITC therefore depends systematically on the surface termination. To identify the microscopic origin of this dependence, we analyze the interfacial thermodynamic adhesion, the electrostatic interactions, and the interfacial coupling stiffness in turn.
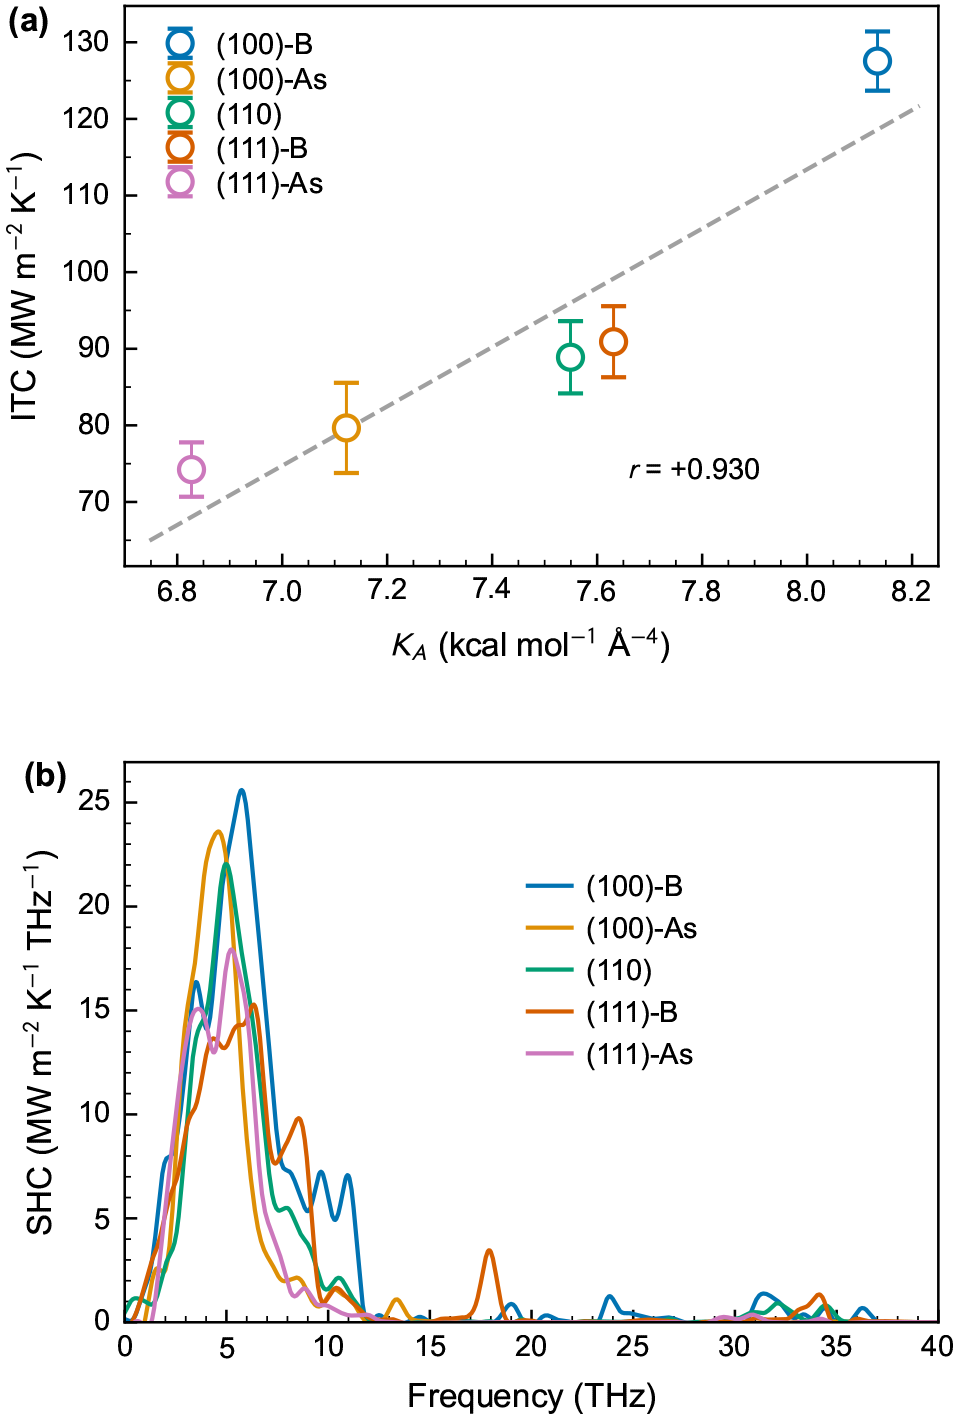
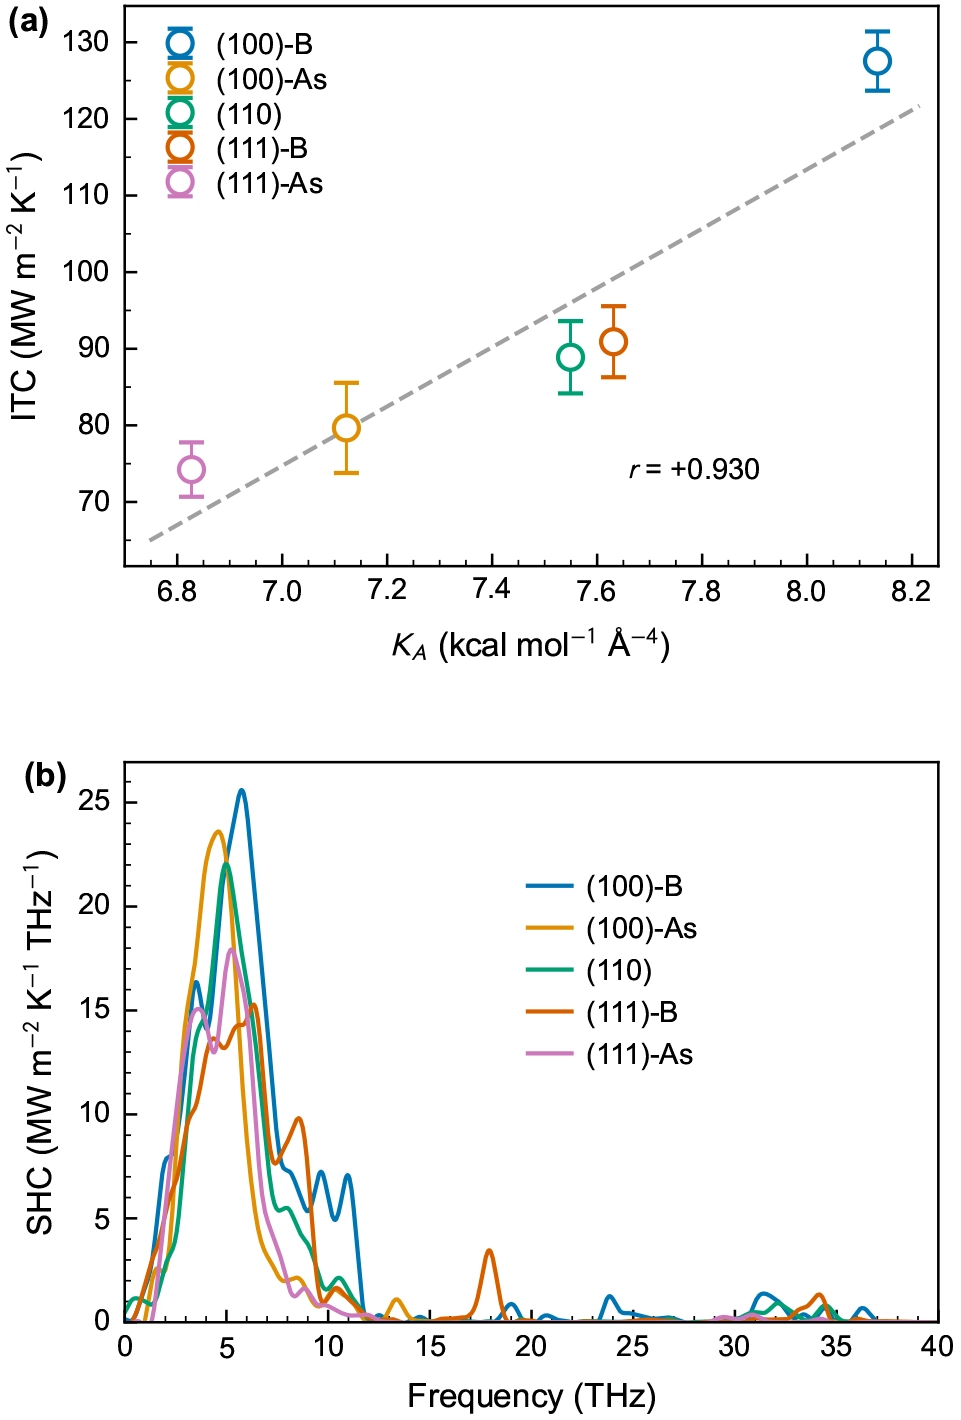
Figure 3. Interfacial properties of pristine BAs/epoxy interfaces across five crystal planes. (a) ITC as a function of the interfacial coupling stiffness KA. Error bars represent the standard error of the mean from ten independent NEMD trajectories, the dashed line is a linear fit, and r is the Pearson correlation coefficient; (b) SHC as a function of frequency. BAs: boron arsenide; ITC: interfacial thermal conductance; NEMD: non-equilibrium molecular dynamics; SHC: spectral heat conductance.
The thermodynamic adhesion of the interfaces is characterized by the interface energy. As shown in Figure S5, the total interface energies of the five faces are all negative, indicating thermodynamically bound states, and the values fall within a narrow range from -0.173 J m-2 for (100)-B to -0.208 J m-2 for (111)-As. The decomposition into van der Waals and electrostatic contributions shows that the Coulomb term accounts for only 2% to 13% of the total interface energy, so the adhesion is dominated by van der Waals interactions. The interface energy hardly distinguishes the B-terminated from the As-terminated faces, and thermodynamic adhesion is therefore not the origin of the termination dependence of ITC.
The contribution of electrostatic interactions was examined directly by charge-removal control simulations. These controls kept the interface configuration and all parameters unchanged, set only the charges of B and As to zero while retaining the epoxy charges, and started from NPT and NVT equilibration and proceeded through Langevin pre-equilibration and NEMD production in the same way as the original systems, with ten independent trajectories for each face (Section 2.2). The ITC changes of the five faces are all within 6% (Figure S6). The electrostatic difference between the B and As terminations is therefore of minor importance for both the magnitude of ITC, consistent with the low Coulomb fraction in the interface energy, and the termination dependence of ITC is not electrostatic in origin.
The termination dependence of interfacial transport is described by the interfacial coupling stiffness. KA is the area-normalized sum of the cross-interface force constants (Eq. 15) and measures the strength of the vibrational coupling between the two sides of the interface. The KA values of the five faces range from 8.13 kcal mol-1 Å-4 for (100)-B to 6.83 kcal mol-1 Å-4 for (111)-As, and the Pearson correlation coefficient with the ITC is 0.93 (Figure 3a). KA is determined by the cross-interface van der Waals and structural coupling, and its agreement with ITC indicates that the ITC differences among the terminations originate from the strength of the cross-interface vibrational coupling formed between each termination and the epoxy.
The spectral heat conductance resolves these differences by frequency, as shown in Figure 3b. All five spectra share the same general shape, featuring a dominant peak between 0 and 12 THz. The (100)-B interface has the largest main-peak amplitude, and the remaining interfaces cross one another in parts of the frequency range. The interfacial differences are most pronounced in the 6 to 12 THz peak region, where the spectra of the B-terminated surfaces retain large amplitudes while those of the As-terminated surfaces decay more rapidly as the frequency increases. Above 12 THz, only weak residual peaks extend to higher frequencies in some crystallographic orientations, confirming that BAs optical phonons contribute little to interfacial transport.
To verify whether the interfacial conclusions are affected by the known deviation of the Tersoff potential in the optical-branch frequency range, we integrated the SHC spectra in Figure 3b over the acoustic-branch frequency range of the BAs phonon spectrum (Table S1). More than about 93.5% of the total ITC of the five pristine interfaces arises from the acoustic-branch frequency range, while the high-frequency contributions, including those involving BAs optical phonons, are only of minor importance. Interfacial heat transfer at the pristine interfaces is thus dominated by acoustic phonons, and the optical-branch deviation of the potential has little influence on the interfacial conclusions of this work.
We also calculated the VDOS at each interface (Figure S7). The BAs VDOS spans approximately 0 to 33 THz, whereas the VDOS of epoxy extends to about 93 THz. Although the two spectra overlap partially in frequency, the correlation factor S varies only from 0.278 to 0.301 across all five interfaces, a surprisingly narrow range given the 1.72-fold ITC variation. Moreover, the interface with the highest S ((111)-As) has the lowest ITC. The VDOS overlap reflects the availability of vibrational states on the two sides of the interface, but it does not quantify how strongly these states are vibrationally coupled across the boundary. The crystallographic-orientation dependence of ITC is governed by the interfacial coupling strength, consistent with the strong correlation between KA and ITC.
The pristine BAs/epoxy ITC values (74-128 MW m-2 K-1) are roughly half those reported for BAs/Si interfaces (200-300 MW m-2 K-1)[27]. Si shares the diamond-cubic structure with BAs, yielding better lattice-constant matching and stronger vibrational coupling than the amorphous, spectrally broad epoxy. The BAs/Si interface is furthermore held together by covalent bonding, whereas the pristine BAs/epoxy boundary relies on weak van der Waals interactions, with small interface energies and a low Coulomb fraction (Figure S5). This bonding deficit makes the BAs/epoxy ITC ceiling intrinsically lower, and it also means that the relative improvement achievable through chemical modification is both more necessary and more informative. Comparable ITC values have been reported for BNNS/epoxy[29] and graphene/epoxy interfaces[64], and covalent functionalization has been shown to enhance ITC at graphene/epoxy boundaries through improved vibrational coupling[65]. Given BAs’s combination of ultra-high κ and effective electrical insulation[66], the question arises whether surface functionalization can raise thermal transport across the BAs/epoxy boundary toward levels more commensurate with BAs’s intrinsic thermal capability.
3.3 Functionalized interface thermal transport: Enhancement via covalent bridging
The pristine-interface results identified (100)-B as the surface with the highest ITC of 127.6 MW m-2 K-1, motivating its selection as the platform for functionalization studies. This choice is further supported by previous DFT calculations, which show that the three B-terminated low-index surfaces ((100), (110), and (111)) possess comparable calculated surface energies[67]. We note that this comparison refers to computed surface stabilities, and direct experimental data on the relative exposure probabilities of the BAs facets are not yet available. Five molecular species (-OH, -OC4H9, -OC8H17, -OC3H6NH2, and -OC7H14NH2) were anchored to surface B atoms via B-O bonds at four coverages ranging from 2% to 16%.
Figure 4 summarizes the functionalized-interface results. The normalized ITC, defined as ITC/ITC0 where ITC0 = 127.6 MW m-2 K-1, is plotted against coverage for all five molecules in Figure 4a. All molecules increase ITC monotonically with coverage, but the extent of enhancement differs considerably. At 2% coverage, the effect is small and similar across molecules (ITC/ITC0 ≈ 1.01-1.11), reflecting the limited contribution of sparsely distributed anchors. As coverage rises, a clear hierarchy emerges and the aminoalkoxy molecules outperform the pure alkoxies, which in turn outperform the simple hydroxyl. At 16% coverage, -OC3H6NH2 produces the largest ITC enhancement, reaching roughly twice the pristine value (Figure 4a). -OC7H14NH2 follows closely, and both aminoalkoxy species consistently exceed the pure alkoxy chains at every coverage level. Among the pure alkoxies, -OC8H17 and -OC4H9 yield comparable ITC gains, whereas -OH provides only a modest increase, indicating that alkyl chain length does not play a decisive role within the range studied.
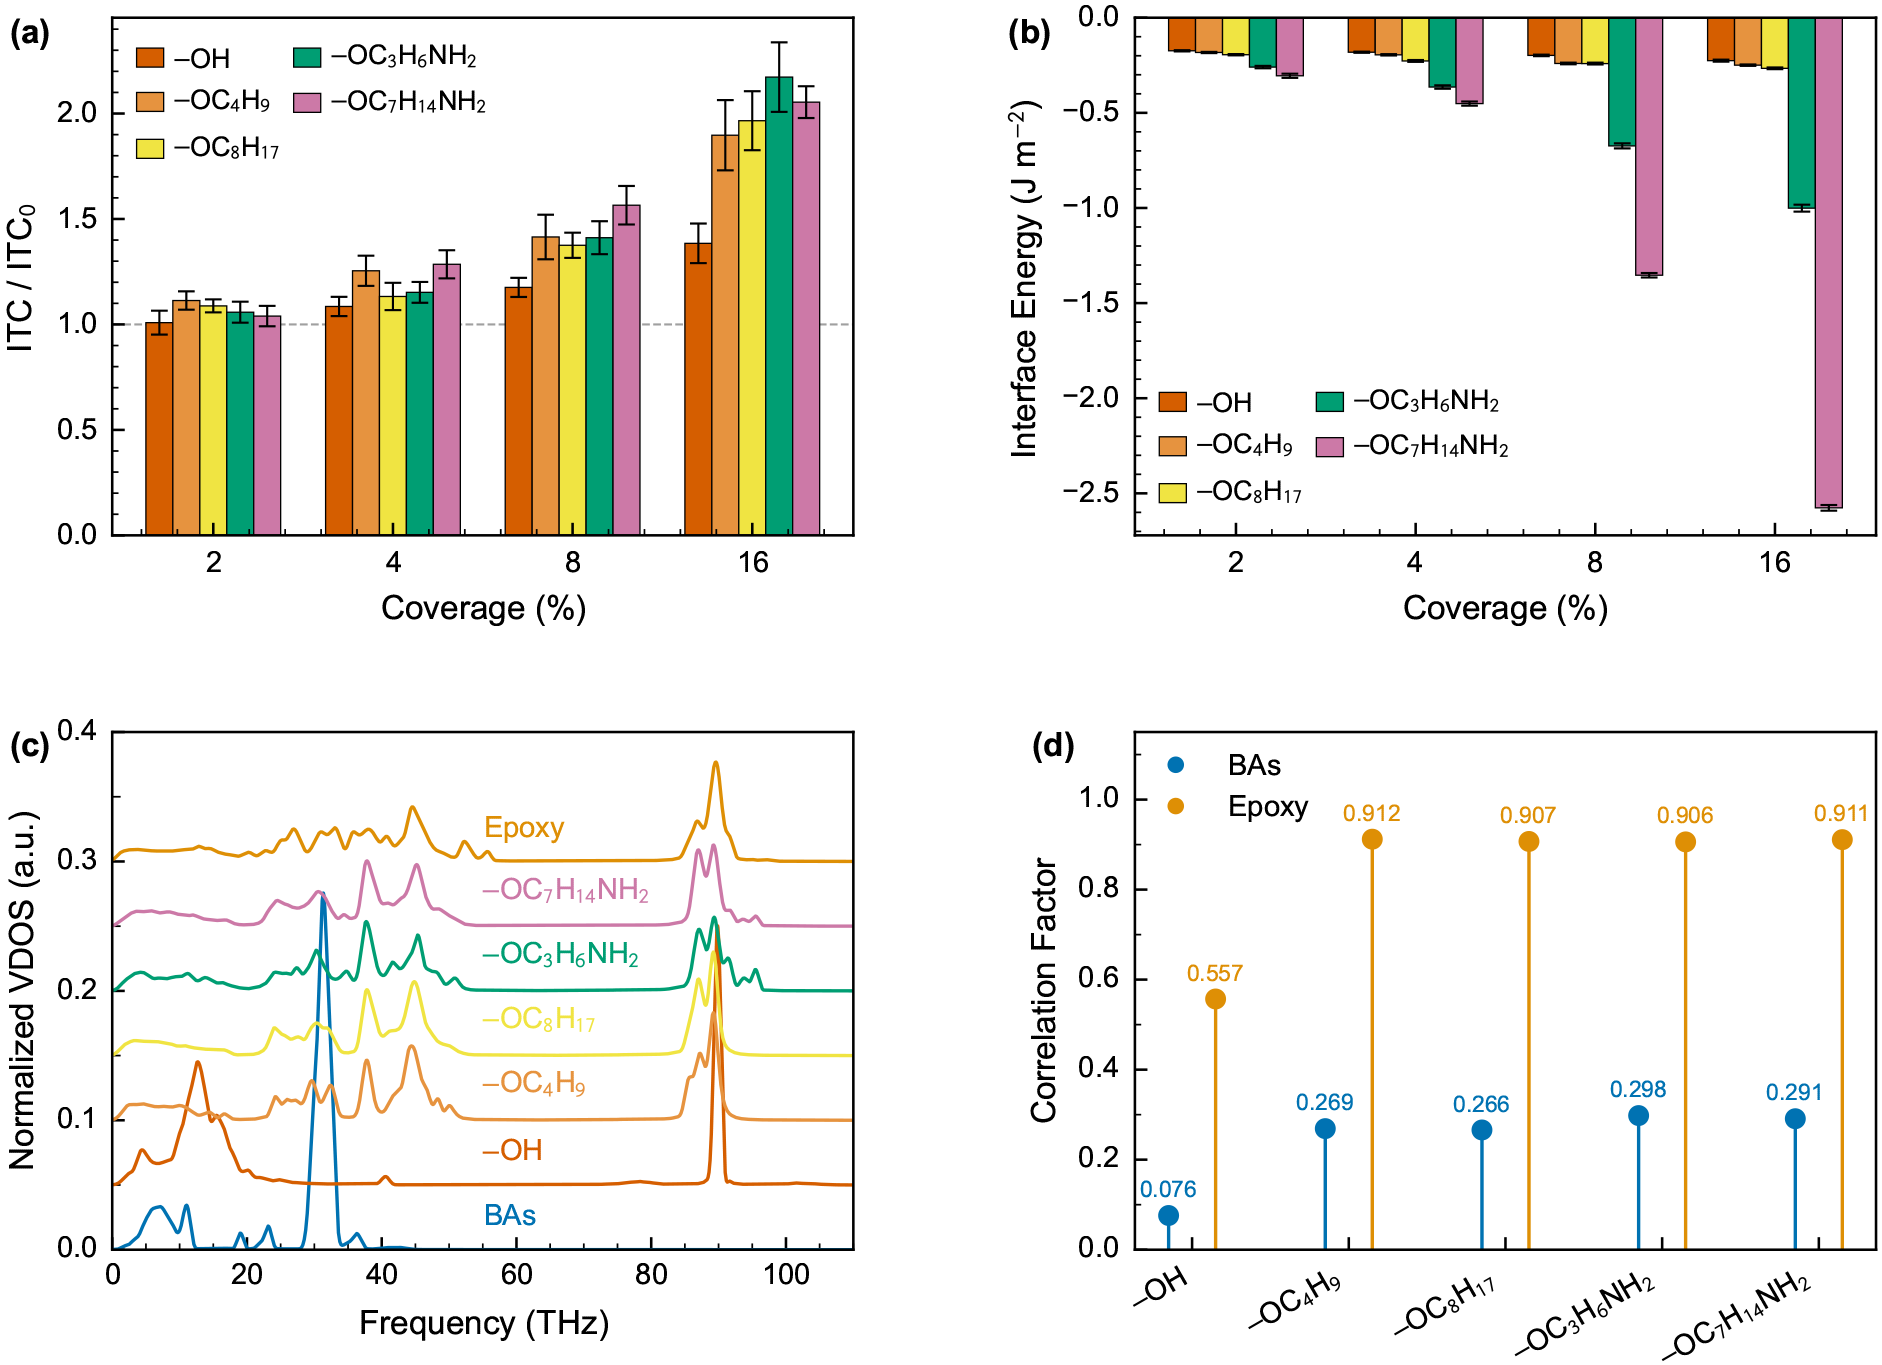
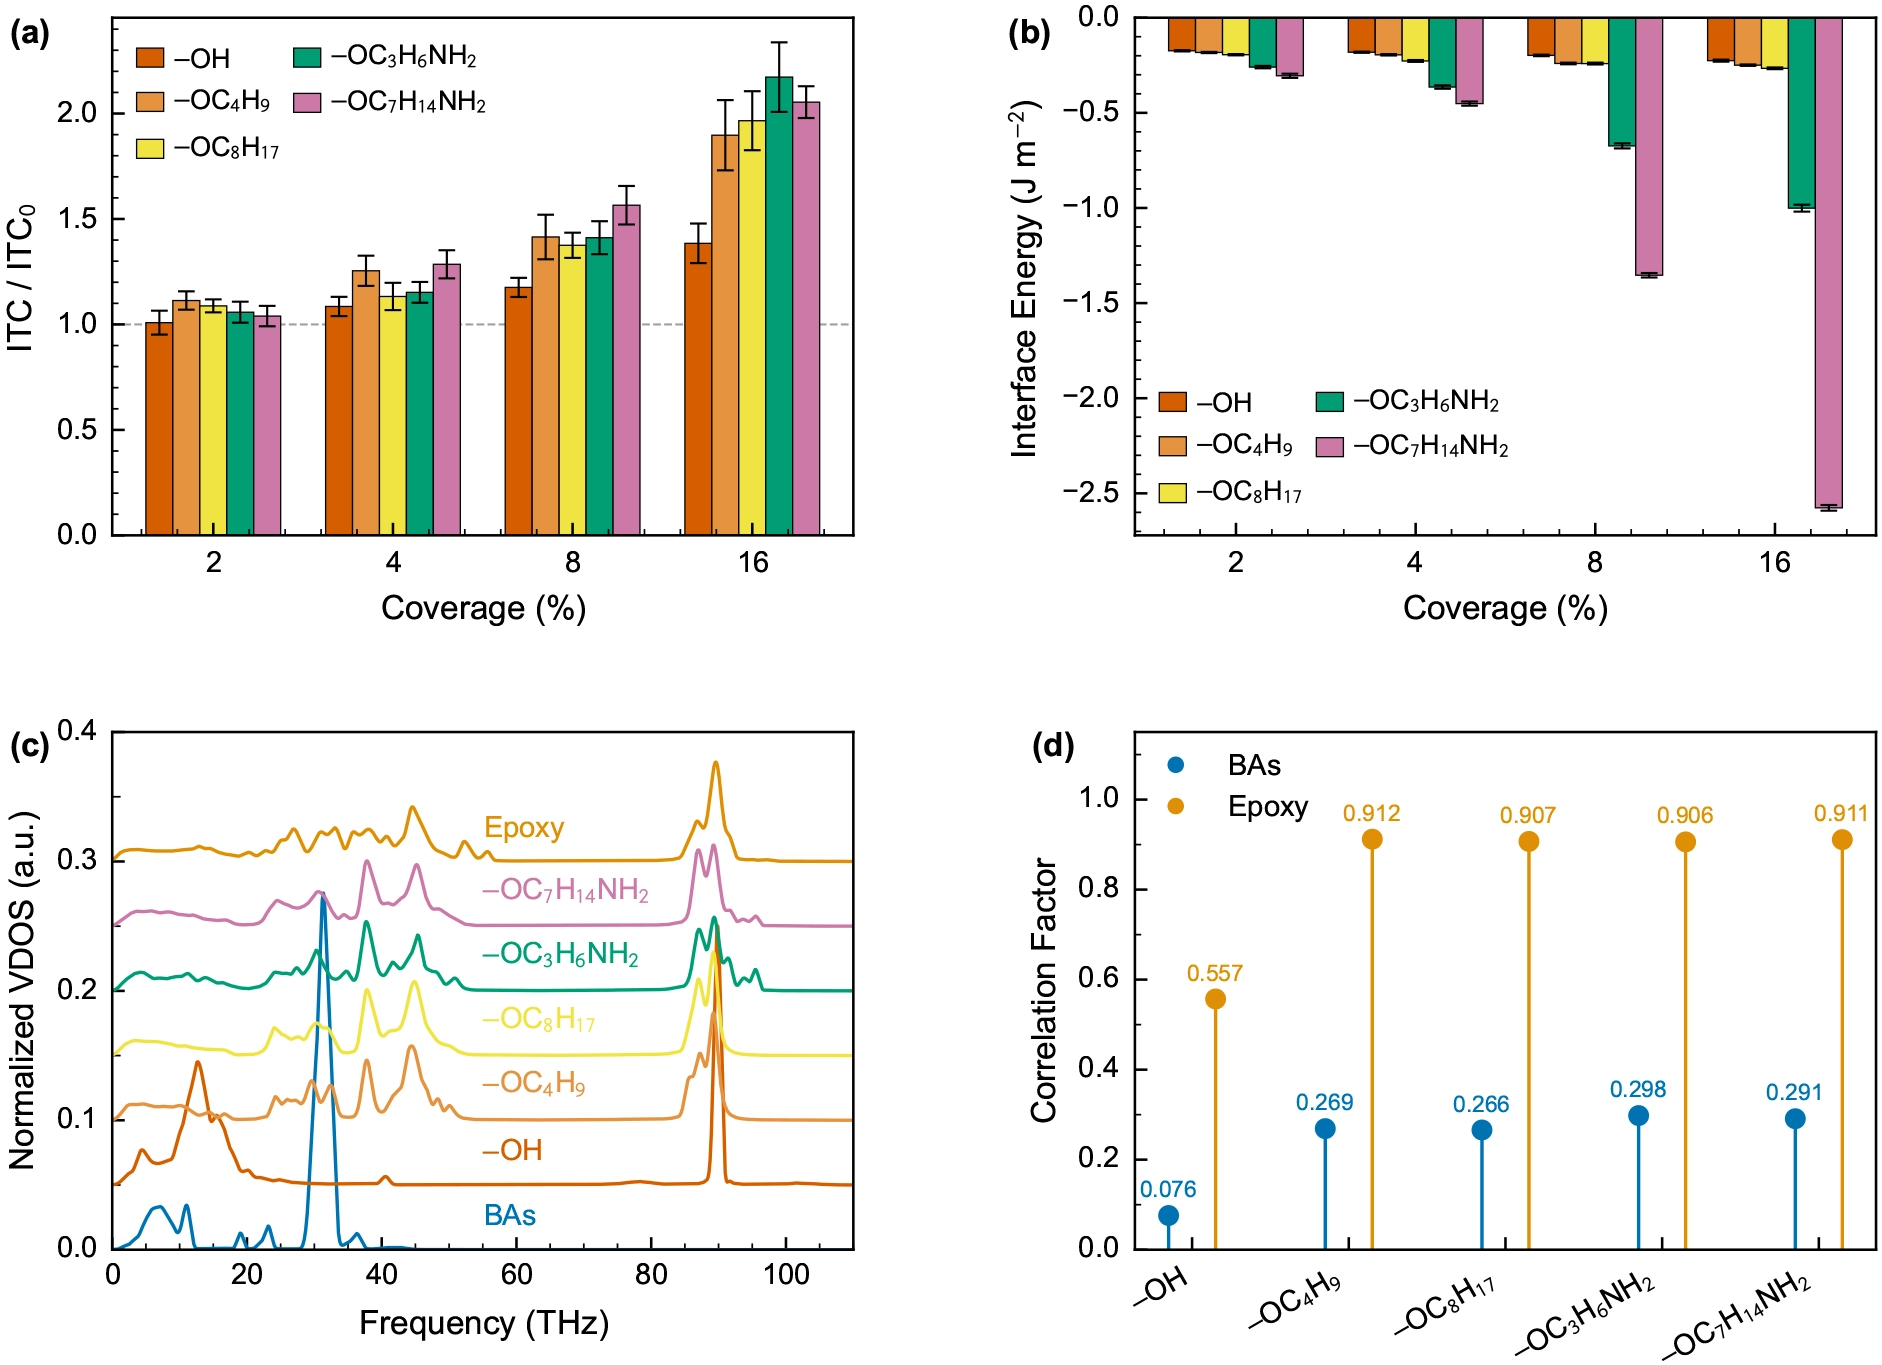
Figure 4. Coverage-dependent interfacial properties of functionalized BAs(100)-B/epoxy interfaces. (a) ITC normalized by the pristine value (ITC0 = 127.6 MW m-2 K-1), with error bars representing the standard error of the mean from ten independent NEMD trajectories; (b) Interface energy, with error bars representing the standard deviation over 30 snapshots; (c) Normalized VDOS; (d) Correlation factor S. BAs: boron arsenide; ITC: interfacial thermal conductance; NEMD: non-equilibrium molecular dynamics; VDOS: vibrational density of states.
The interface energies shown in Figure 4b reveal that the binding of the two aminoalkoxy molecules strengthens markedly with coverage, with -OC7H14NH2 increasing from -0.305 to -2.576 J m-2 and -OC3H6NH2 from -0.260 to -1.001 J m-2. The three non-cross-linking molecules show only moderate strengthening, with -OC8H17 varying from -0.195 to -0.266 J m-2, -OC4H9 from -0.183 to -0.249 J m-2, and -OH from -0.174 to -0.226 J m-2. The differentiation between the aminoalkoxy and the pure alkoxy species in interfacial binding is consistent with the formation of cross-links (Figure S10).
The interfacial coupling stiffness provides a unified explanation of the functionalization results. As shown in Figure S8, the KA values of the twenty functionalized systems increase with coverage from 8.9 to 12.3 kcal mol-1 Å-4 at 2% to 35.4 to 37.1 kcal mol-1 Å-4 at 16%, rising in step with ITC, and the ordering among the molecular families also agrees with that of ITC. The Pearson correlation coefficient between KA and ITC is 0.90 (Figure S8), echoing the value of 0.93 for the five pristine faces, so KA is a valid descriptor of ITC across both termination control and chemical functionalization. -OC7H14NH2 has the strongest binding yet a slightly lower ITC than -OC3H6NH2. The longer alkyl chain provides more van der Waals contact area and stronger binding, whereas the vibrational modes introduced by its additional methylene groups scatter rather than transmit heat-carrying phonons, so binding energy and transmission capability do not advance in step, and interfacial transmission is governed by the cross-interface coupling stiffness.
As shown in Figure 4c, the functional molecules have vibrational spectra closely resembling that of epoxy, spanning the same broad frequency range up to ~93 THz. From Figure 4d, one can find that all molecules overlap far more with epoxy (S ≈ 0.557-0.912) than with BAs (S ≈ 0.076-0.298), indicating that the molecules are vibrationally epoxy-like rather than crystal-like. The frequency-resolved SHC spectra (Figure S9) decompose the coverage-dependent enhancement by frequency. As coverage increases from 0% to 16%, all five molecules show enhanced SHC, but the enhancement is not uniformly distributed across the spectrum. The dominant contribution of the enhancement lies in the 0-12 THz peak region. This frequency range overlaps with the low-frequency acoustic modes of BAs and the broad low-frequency tail of the epoxy VDOS (Figure S7), reflecting the combined effect of the two interfacial coupling mechanisms at work. On the BAs side, the B-O covalent bond anchors each molecule firmly to the surface, providing a rigid coupling point that enhances near-interface phonon transmission. On the epoxy side, the organic chain extends into the matrix (Figure 1d), engaging the surrounding polymer through van der Waals interactions and, for aminoalkoxy species, covalent cross-links. The functional molecules thus act as thermal bridges[23], physically spanning the interface and channeling heat from the BAs acoustic modes into the epoxy matrix through these coupled interactions.
A weaker but physically meaningful secondary SHC feature appears in the optical-branch frequency range at higher coverages, most noticeably for the alkoxy and aminoalkoxy groups at 16%, as shown in Figure S9. In the calculated spectrum, this feature falls in the high-frequency region associated with BAs optical vibrations, where the pristine interface shows only a weak SHC contribution. The fact that this feature is enhanced for alkoxy and aminoalkoxy terminations, but not for hydroxyl termination, indicates that the B-O anchoring bond alone is not sufficient to generate this high-frequency contribution. Compared with the short and localized hydroxyl group, alkoxy and aminoalkoxy groups contain longer organic segments that can extend further into the epoxy matrix and provide a more effective mechanical bridge between the BAs surface and the polymer network. This extended coupling pathway may facilitate the transfer of high-frequency BAs-derived vibrations into the organic phase, thereby increasing the SHC spectral weight in the optical-branch frequency range. To assess the actual weight of the high-frequency transport channel activated by covalent bridging in the total interfacial heat transfer, we performed the same band-integration analysis on the SHC spectra of Figure S9 (Table S2). The results show that even at the highest coverage considered, more than about 84.1% of the total ITC of the functionalized interfaces still arises from the acoustic-branch frequency range. At this coverage, the high-frequency contribution of the four chain-bearing molecules increases markedly relative to the unfunctionalized interface, whereas that of -OH, which contains only the B-O anchoring bond and no extended organic segment, remains essentially unchanged. This is consistent with the mechanistic analysis above that the B-O anchoring bond alone is not sufficient to activate the high-frequency contribution. These results indicate that the interfacial coupling pathway formed by the covalent anchoring and the extended organic segments not only strengthens the existing transport channel within the acoustic-branch frequency range, but also opens a new channel beyond this range, turning the otherwise weak high-frequency contribution into a non-negligible yet still secondary transport channel. It should be noted that this high-frequency contribution mainly arises from the optical-branch frequency range of BAs, and the Tersoff potential places the optical branches at frequencies systematically shifted from the DFPT reference (Figure S1a). Nevertheless, considering that these results do not depend on the precise positions of the optical-branch peaks, the qualitative conclusions drawn above remain valid.
A comparison between alkoxy and aminoalkoxy functionalization further highlights the possible contribution of covalent cross-linking at high surface coverage. At the same high surface coverage, the aminoalkoxy-functionalized interface exhibits a slightly higher ITC than the corresponding alkoxy-functionalized interface. Because the two functional groups share a similar B-O anchoring motif but differ in the ability of aminoalkoxy groups to form covalent cross-links with the epoxy matrix, this additional ITC increase can be reasonably associated with cross-link formation between the surface-bound aminoalkoxy groups and the epoxy network. The results of MD simulations show that the number of covalent cross-links between aminoalkoxy groups and epoxy increases with surface coverage for the same interfacial area (Figure S10). The IE results show a similar tendency, with aminoalkoxy functionalization giving more favorable interfacial binding than alkoxy functionalization at high coverage. These observations suggest that, in addition to molecular bridging, covalent incorporation of the surface-bound functional groups into the epoxy network can contribute to stronger interfacial coupling.
To further probe the coverage dependence, we extended the two representative molecules to 32% and 40% coverage, with ten independent NEMD trajectories for each configuration following the same procedure as the main series (Figure S11). The ITC continues to increase monotonically, reaching 3.8 times the pristine value for -OC7H14NH2 and 3.2 times for -OC8H17 at 40% coverage, and the enhancement is not yet saturated within this range. For reference, the 16% coverage corresponds to about 1.4 chains nm-2, and experimentally reported grafting densities of organic modification on silica surfaces reach up to about 1.5 chains nm-2[68,69]. It should be noted that no experimental grafting density has been reported for BAs surfaces, and the above comparison serves only as a cross-material reference based on analogies with silica systems.
The maximum ITC enhancement observed here is more modest than the improvements reported for some other functionalization strategies. He et al. achieved up to 507% via self-assembled monolayers at semiconductor/polymer interfaces[23], and Zhang and Liu reported more than a sixfold improvement using layered hydrogen-bond networks at graphene/polymer interfaces[24]. Several factors contribute to this difference, including the much larger specific surface area of two-dimensional fillers, the higher areal density of functional groups achievable on flat surfaces, and the different nature of the filler-matrix interaction in those systems. Nevertheless, the present results demonstrate that BAs-based fillers respond to surface functionalization in a chemically intuitive manner and that both the choice of functional group and the surface coverage can be used to tune ITC over a meaningful range[29].
It should be noted that the interface models in this work involve three deliberate idealizations. The BAs facets are atomically flat, the grafted molecules are uniformly distributed, and the filler and the matrix remain in perfect contact. The ITC values reported here therefore represent upper bounds on the conductance attainable with the corresponding interface chemistries. The functionalization concept itself, however, is firmly grounded in experimental chemistry. The affinity of surface B sites for oxygen not only enables B-O anchoring but also drives surface oxidation, which means that native oxides and grafted molecules compete for the same surface sites. Analogous chemistry is well documented for boron nitride, where oxygen-radical grafting produces covalent boronate ester B-O-C bonds at surface B sites that can be hydrolyzed to B-OH groups and further derivatized[70]. Scalable BAs powder synthesis and BAs/epoxy composite fabrication have likewise been demonstrated[14,15]. In a realistic composite, nonuniform grafting, particle roughness and curvature, incomplete interfacial contact, and the coexistence of several crystallographic facets on a single particle would all modulate the ITC achieved locally, and the fully contacting, uniformly grafted interfaces studied here represent the upper end of this range.
4. Conclusion
We used molecular dynamics simulations to study thermal transport across BAs/epoxy interfaces. Specifically, we elucidated the intrinsic influence of surface termination on pristine boundaries and actively engineered the optimal interface via covalent functionalization.
Across five pristine BAs/epoxy interfaces spanning three principal crystal planes, ITC varies by a factor of 1.72 (74-128 MW m-2 K-1), with B-terminated surfaces consistently yielding higher values than As-terminated ones. The electrostatic decomposition of the interface energy and the charge-removal controls show that adhesion energy and electrostatic interactions are both of minor importance, and the termination hierarchy is governed by the area-normalized interfacial coupling stiffness KA, with correlation coefficients of 0.93 for the five pristine faces and 0.90 for the twenty functionalized systems.
On the (100)-B surface, five functional molecules at coverages from 2% to 16% all enhance ITC monotonically. The aminoalkoxy -OC3H6NH2 achieves the largest enhancement, roughly doubling the pristine ITC at 16% coverage (277.1 MW m-2 K-1). Two complementary mechanisms underlie this improvement. Interfacial contact enhancement, common to all anchored molecules, extends the effective contact area and increases atomistic coupling points between BAs and epoxy. Covalent cross-linking, specific to aminoalkoxy species, creates additional thermal pathways through chemical bonding with the epoxy matrix, accounting for the further improvement.
This work provides a systematic quantitative characterization of interfacial thermal transport across BAs/polymer interfaces. The finding that B-terminated surfaces systematically outperform As-terminated surfaces links interfacial thermal transport to the surface termination of BAs, and the interfacial coupling stiffness offers a quantitative criterion for crystallographic-orientation selection in composite fabrication. The demonstrated effectiveness of covalent surface functionalization, achievable through established B-O anchoring chemistry, provides a practical strategy for improving thermal performance in BAs-based thermal interface materials.
Supplementary materials
The supplementary material for this article is available at: Supplementary materials.
Acknowledgements
ChatGPT 5.4 (OpenAI) was used solely for language polishing and text refinement. The authors take full responsibility for the integrity, originality, and accuracy of the work. The authors acknowledge the computational resources provided by the AMS Global Data Center. We thank Prof. Fan Yang and Prof. Zhiyong Wei for helpful discussions.
Authors contribution
Ai H: Conceptualization, funding acquisition, methodology, writing-original draft.
Song X: Visualization, investigation, methodology.
Feng L: Data curation, investigation.
Zhou H: Data curation, formal analysis.
Hong L: Software, validation.
Cui Z: Data curation, investigation.
Guo R: Conceptualization, supervision, writing-review & editing.
Conflicts of interest
The authors declare no conflicts of interest.
Ethical approval
Not applicable.
Consent to participate
Not applicable.
Consent for publication
Not applicable.
Availability of data and materials
The data that support the findings of this study are available from the corresponding author upon reasonable request.
Funding
This work was supported by Shandong Provincial Natural Science Foundation (Grant No. ZR2023QA006).
Copyright
© The Author(s) 2026.
References
-
3. Feng T, Lindsay L, Ruan X. Four-phonon scattering significantly reduces intrinsic thermal conductivity of solids. Phys Rev B. 2017;96(16):161201.[DOI]
-
7. Niyikiza AB, Xiang Z, Zhang F, Pan F, Li C, Delmont M, et al. Thermal conductivity of boron arsenide above 2100 W per meter per Kelvin at room temperature. Mater Today. 2025;90:11-14.[DOI]
-
9. Dou Z, Lei C, Wu K, Yu G. The development of thermal interface materials. Nat Electron. 2025;8(12):1146-1155.[DOI]
-
12. Kang JS, Li M, Wu H, Nguyen H, Aoki T, Hu Y. Integration of boron arsenide cooling substrates into gallium nitride devices. Nat Electron. 2021;4(6):416-423.[DOI]
-
15. Lee B, Ryu S. Massive synthesis in vacuum of high thermal conductivity boron arsenide for underfill application. Electron Mater Lett. 2026;22(2):157-165.[DOI]
-
16. Cuong Nguyen V, Nguyen Pham V, Thien Nguyen C, Hoang Ai Pham L, Khiem Nguyen D, Thi Kieu Lien M, et al. Layer-by-layer assembly of boron arsenide and copper nanoflake-based aramid nanofibers for thermoconductive electromagnetic interference shielding materials with superior mechanical flexibility and flame retardancy. J Ind Eng Chem. 2024;138:492-501.[DOI]
-
17. Nan CW, Birringer R, Clarke DR, Gleiter H. Effective thermal conductivity of particulate composites with interfacial thermal resistance. J Appl Phys. 1997;81(10):6692-6699.[DOI]
-
18. Chen J, Xu X, Zhou J, Li B. Interfacial thermal resistance: Past, present, and future. Rev Mod Phys. 2022;94(2):025002.[DOI]
-
21. Abbas M, Septevani AA, Yurid F, Joshi A, Gupta M, Rangappa SM, et al. Thermal interface polymer-based composites materials: A critical review. Multiscale Multidiscip Model Exp Des. 2025;8(3):191.[DOI]
-
22. Lai Q, Li D, Bian J, Wu JJ, Yang KC, Lin HL, et al. Review of progress in polymer-based interfacial thermal management composites. J Appl Polym Sci. 2026;143(12):e70324.[DOI]
-
26. Li H, Liu Y, Wang T, Chen Y, Lou J, He Z, et al. Suppression of orientation dependent heat transport across Al/α-Al2O3 interfaces by interfacial atomic disorder. Phys Rev B. 2026;113(16):165304.[DOI]
-
27. Wei Z, Yang Z, Liu M, Wu H, Chen Y, Yang F. Thermal boundary conductance between high thermal conductivity boron arsenide and silicon. J Appl Phys. 2020;127(5):055105.[DOI]
-
28. Zhou W, Liang N, Xiao W, Tong Z, Tian F, Song B. Ultrahigh interfacial thermal conductance for cooling gallium oxide electronics using cubic boron arsenide. Phys Rev Appl. 2025;24(3):L031005.[DOI]
-
29. Liu Z, Sun X, Xie J, Zhang X, Li J. Interfacial thermal transport properties and its effect on thermal conductivity of functionalized BNNS/epoxy composites. Int J Heat Mass Transf. 2022;195:123031.[DOI]
-
30. Thompson AP, Aktulga HM, Berger R, Bolintineanu DS, Brown WM, Crozier PS, et al. LAMMPS - a flexible simulation tool for particle-based materials modeling at the atomic, meso, and continuum scales. Comput Phys Commun. 2022;271:108171.[DOI]
-
31. Fan Z, Chen W, Vierimaa V, Harju A. Efficient molecular dynamics simulations with many-body potentials on graphics processing units. Comput Phys Commun. 2017;218:10-16.[DOI]
-
36. Wan X, Demir B, An M, Walsh TR, Yang N. Thermal conductivities and mechanical properties of epoxy resin as a function of the degree of cross-linking. Int J Heat Mass Transf. 2021;180:121821.[DOI]
-
37. Yu S, Yang S, Cho M. Multiscale modeling of cross-linked epoxy nanocomposites to characterize the effect of particle size on thermal conductivity. J Appl Phys. 2011;110(12):124302.[DOI]
-
40. Benkabou F, Chikr.Z C, Aourag H, Becker PJ, Certier M. Atomistic study of zinc-blende BAs from molecular dynamics. Phys Lett A. 1999;252(1-2):71-76.[DOI]
-
41. Mayo SL, Olafson BD, Goddard WA. DREIDING: A generic force field for molecular simulations. J Phys Chem. 1990;94(26):8897-8909.[DOI]
-
42. Rappe AK, Casewit CJ, Colwell KS, Goddard WA, Skiff WM. UFF, a full periodic table force field for molecular mechanics and molecular dynamics simulations. J Am Chem Soc. 1992;114(25):10024-10035.[DOI]
-
43. Hockney RW, Goel SP, Eastwood JW. Quiet high-resolution computer models of a plasma. J Comput Phys. 1974;14(2):148-158.[DOI]
-
44. Yang N, Zeng X, Lu J, Sun R, Wong CP. Effect of chemical functionalization on the thermal conductivity of 2D hexagonal boron nitride. Appl Phys Lett. 2018;113(17):171904.[DOI]
-
47. Kresse G, Joubert D. From ultrasoft pseudopotentials to the projector augmented-wave method. Phys Rev B. 1999;59(3):1758-1775.[DOI]
-
49. Baroni S, de Gironcoli S, Corso AD, Giannozzi P. Phonons and related crystal properties from density-functional perturbation theory. Rev Mod Phys. 2001;73(2):515-562.[DOI]
-
51. Green MS. Markoff random processes and the statistical mechanics of time-dependent phenomena. II. J Chem Phys. 1954;22(3):398-413.[DOI]
-
52. Kubo R. Statistical-mechanical theory of irreversible processes. I. J Phys Soc Jpn. 1957;12(6):570-586.[DOI]
-
54. Fan Z, Pereira LFC, Wang HQ, Zheng JC, Donadio D, Harju A. Force and heat current formulas for many-body potentials in molecular dynamics simulations with applications to thermal conductivity calculations. Phys Rev B. 2015;92(9):094301.[DOI]
-
55. Schelling PK, Phillpot SR, Keblinski P. Comparison of atomic-level simulation methods for computing thermal conductivity. Phys Rev B. 2002;65(14):144306.[DOI]
-
57. Nosé S. A unified formulation of the constant temperature molecular dynamics methods. J Chem Phys. 1984;81(1):511-519.[DOI]
-
59. He J, Zhang L, Liu L. Improving thermal conduction across cathode/electrolyte interfaces in solid-state lithium-ion batteries by hierarchical hydrogen-bond network. Mater Des. 2020;194:108927.[DOI]
-
61. Sääskilahti K, Oksanen J, Volz S, Tulkki J. Frequency-dependent phonon mean free path in carbon nanotubes from nonequilibrium molecular dynamics. Phys Rev B. 2015;91(11):115426.[DOI]
-
62. Liu N, Shen C, Cao Y, Xue S, Wu P, Lin Z, et al. Physics-grounded understanding of thermal boundary conductance between Ga2O3 and SiC from a feedforward neural network potential. arXiv [Preprint]. 2026.[DOI]
-
63. Stukowski A. Visualization and analysis of atomistic simulation data with OVITO-the Open Visualization Tool. Model Simul Mater Sci Eng. 2010;18(1):015012.[DOI]
-
64. Yang X, Wang X, Wang W, Fu Y, Xie Q. Atomic-scale insights into interface thermal resistance between epoxy and boron nitride in nanocomposites. Int J Heat Mass Transf. 2020;159:120105.[DOI]
-
67. Chen Z, Zhao J, Yin L, Chen Z. B-terminated (111) polar surfaces of BP and BAs: Promising metal-free electrocatalysts with large reaction regions for nitrogen fixation. J Mater Chem A. 2019;7(21):13284-13292.[DOI]
-
68. Ji T, Ma C, Brisbin L, Mu L, Robertson CG, Dong Y, et al. Organosilane grafted silica: Quantitative correlation of microscopic surface characters and macroscopic surface properties. Appl Surf Sci. 2017;399:565-572.[DOI]
Copyright
© The Author(s) 2027. This is an Open Access article licensed under a Creative Commons Attribution 4.0 International License (https://creativecommons.org/licenses/by/4.0/), which permits unrestricted use, sharing, adaptation, distribution and reproduction in any medium or format, for any purpose, even commercially, as long as you give appropriate credit to the original author(s) and the source, provide a link to the Creative Commons license, and indicate if changes were made.
Publisher’s Note
Science Exploration remains a neutral stance on jurisdictional claims in published
maps
and institutional affiliations. The views expressed in this article are solely those
of
the author(s) and do not reflect the opinions of the Editors or the publisher.
Share And Cite


Science Exploration Style
Ai H, Song X, Feng L, Zhou H, Hong L, Cui Z, et al. Engineering interfacial thermal conductance across BAs/Epoxy boundaries via surface termination control and covalent bridging. Thermo-X. 2027;3:202633. https://doi.org/10.70401/tx.2026.0036
Tips
Copy completed.
Submit a Manuscript
Author Instructions
Cite this Article
Article Metrics
0
View
0
Download
Cited
Article Updates

- Abstract
- Keywords
- 1. Introduction
- 2. Computational Methods
- 3. Results and Discussion
- 4. Conclusion
- Supplementary materials
- Acknowledgements
- Authors contribution
- Conflicts of interest
- Ethical approval
- Consent to participate
- Consent for publication
- Availability of data and materials
- Funding
- References
- Copyright
 Get citation
Science Exploration Style

Ai H, Song X, Feng L, Zhou H, Hong L, Cui Z, et al. Engineering interfacial thermal conductance across BAs/Epoxy boundaries via surface termination control and covalent bridging. Thermo-X. 2027;3:202633. https://doi.org/10.70401/tx.2026.0036
copy
Share Link
copy